Recommended articles:
-

-
Global Energy Interconnection
Volume 8, Issue 5, Oct 2025, Pages 874-890
Forecasting electricity prices in the spot market utilizing wavelet packet decomposition integrated with a hybrid deep neural network
Abstract
Abstract Accurate forecasting of electricity spot prices is crucial for market participants in formulating bidding strategies.However, the extreme volatility of electricity spot prices,influenced by various factors,poses significant challenges for forecasting.To address the data uncertainty of electricity prices and effectively mitigate gradient issues,overfitting,and computational challenges associated with using a single model during forecasting, this paper proposes a framework for forecasting spot market electricity prices by integrating wavelet packet decomposition (WPD) with a hybrid deep neural network.By ensuring accurate data decomposition, the WPD algorithm aids in detecting fluctuating patterns and isolating random noise.The hybrid model integrates temporal convolutional networks (TCN)and long short-term memory(LSTM)networks to enhance feature extraction and improve forecasting performance.Compared to other techniques,it significantly reduces average errors,decreasing mean absolute error(MAE)by 27.3%,root mean square error(RMSE)by 66.9%, and mean absolute percentage error (MAPE) by 22.8%.This framework effectively captures the intricate fluctuations present in the time series, resulting in more accurate and reliable predictions.
0 Introduction
In contemporary society, electricity has become a fundamental and indispensable energy source, with its consumption serving as a key driver of social and economic advancement [1,2].Moreover, continuous advancements in energy technology have led to the increased integration of renewable energy sources into the electricity market,which may contribute to price volatility and pose challenges to power system stability.Accurate forecasting of spot market prices is essential for market participants, as it supports stable market operations, facilitates the development of effective trading strategies, and implements strong risk management practices [3,4].
Prior to forecasting, data denoising is essential for managing the substantial volume of information and mitigating noise interference inherent in time series data[5,6].Such noise can significantly reduce the accuracy of forecasting.Conventional methods, such as wavelet transforms,Empirical Mode Decomposition(EMD),and Complete Ensemble Empirical Mode Decomposition with Adaptive Noise (CEEMDAN), have been widely employed in time series analysis to address noise interference [7,8].Moreover, one study addressed data anomalies by implementing a resolution measurement system for effective detection and evaluation [9].Additionally, the Stacked Pruning Sparse Denoising Autoencoder(SPSDAE) has been utilized to extract essential features from input data while discarding unreliable characteristics[10].
However,traditional denoising methods may also introduce certain limitations.For instance, Variational Mode Decomposition(VMD)is prone to boundary effects,while EMD is vulnerable to mode aliasing[11].To address these challenges, the wavelet packet decomposition (WPD)approach, which enables multi-resolution analysis and detailed frequency band decomposition, presents a valuable solution for enhancing forecasting models [12].By segmenting the frequency spectrum while preserving key time-domain characteristics,WPD effectively reduces noise interferencewhilemaintainingessentialsignal information.
Simultaneously,various influential factors contribute to the inherent uncertainty of electricity prices [13,14],prompting researchers to explore diverse methodologies for accurate price prediction.Previous studies have extensively employed regression analysis [15] and artificial neural networks [16-18] for electricity price forecasting, each offering distinct advantages.Traditional regression analysis primarily relies on identifying correlations within the data series to generate forecasts.To enhance the robustness of regression models, recent studies have introduced adaptive frameworks that dynamically adjust model parameters in response to fluctuating market conditions.These methods often incorporate real-time data assimilation, allowing models to refine their predictions as new data become available, thereby improving their ability to handle sudden price fluctuations and seasonal variations[19].A research study utilized entropy and mutual information for feature selection, effectively eliminating redundant inputs and enhancing forecasting accuracy [20].However, while conventional statistical methods are computationally efficient, their forecasting accuracy is often compromised by anomalous data fluctuations.
Moreover, with advancements in statistical computing,prediction techniques based on functional data methods have demonstrated effectiveness in forecasting.This method primarily utilizes the information within data sample units to integrate the inherent characteristics of data structures.The model explores data dependencies by decomposing the trend structure of continuous functions to make predictions [21,22].However, this approach requires relatively complete datasets and is highly dependent on data quality.Additionally, its prediction accuracy tends to be less stable over longer periods, which has limited its widespread application in the energy market [23].Compared to machine learning prediction methods, functional prediction methods are relatively simple and easy to interpret, making them well-suited for time series analysis.Nevertheless,in scenarios involving large datasets and high-dimensional data, machine learning methods often have distinct advantages.Therefore, the performance of prediction models based on functional and structural characteristics must be evaluated within the specific application context [24].
Machine learning algorithms have garnered significant interest due to their effectiveness in managing nonlinear time series and their robust computational capabilities[25,26].An advanced long short-term memory (LSTM)model with an attention mechanism has further improved forecasting accuracy, particularly in scenarios with high renewable energy penetration [27].To enhance feature extraction, a recent study integrated an inception-based convolutional architecture, thereby strengthening both the depth and breadth of feature learning and improving the capture of data relevance for forecasting models [28].Additionally,a dynamic multivariate forecasting approach using a rolling window has been employed to jointly predict electricity prices and load demand,addressing the limitations of single-variable forecasting [29].In a separate effort, researchers developed a dual-stage feature selection approach integrated with LSTM models, incorporating market coupling effects to enhance predictive accuracy[30].
Moreover,the limitations of single forecasting methods in capturing the complexities of nonlinear electricity price time series have been well-documented [31].Improving forecasting accuracy requires integrating the strengths of different models while accounting for critical correlated factors,such as renewable energy generation,load requirements, market prices, and environmental impacts [32-35].
Recent research has increasingly focused on integrating multiple models to enhance forecasting accuracy,as singlemodel approaches are often susceptible to challenges such as gradient explosion or reduced accuracy during data processing and feature extraction [36-38].Current studies emphasize combining models that excel in feature extraction with those that demonstrate strong forecasting capabilities.However, when forecasting involves large quantities, LSTM models may face challenges, including gradient explosion and overfitting.
Consequently,temporal convolutional networks(TCN)can be integrated with LSTM to enhance the model,leveraging the parallel computing capabilities of TCN to improve operational speed.The combination of these two models can lead to superior forecasting outcomes.TCN enhances the feature extraction capabilities of the hybrid model by expanding convolutional operations[39],while LSTM addresses the limitations of TCN in handling diverse input features,ultimately improving forecasting accuracy.Additionally, reference [40] implemented an LSTM-TCN configuration for photovoltaic power forecasting, demonstrating superior performance in capturing temporal dependencies compared to conventional standalone models.Experimental comparisons confirm that hybrid models, which combine LSTM and TCN, significantly outperform single-model approaches in terms of forecast accuracy and data interpretation.However,directly processing the original data may lead to complex computations within the hybrid deep neural network.Therefore, decomposing local features and reducing noise can improve the model’s predictive performance.
Compared to other forecasting models, some models may offer advantages in computational complexity; however, their predictive performance tends to be less stable.For instance,GRU-based models often struggle with large datasets,while transfer learning models rely heavily on the similarity between the source task and the target task[41].If significant differences exist between the features of the source task and those of electricity price forecasting, the effectiveness of transfer learning may be greatly diminished.Additionally, many traditional models assume linear relationships within the data, limiting their ability to capture the nonlinear characteristics inherent in electricity price fluctuations.Therefore,LSTM is regarded as a more advanced machine learning-based forecasting approach,as its gating mechanism effectively adapts to the complexities of electricity price fluctuations [42].Moreover, it can be integrated with the parallel convolution operations of TCN to conduct a comprehensive analysis of electricity price trends.Consequently, LSTM models are typically prioritized in forecasting tasks.
This paper introduces an advanced electricity price forecasting model that integrates the WPD algorithm with a hybrid TCN-LSTM neural network.The WPD algorithm offers high decomposition accuracy, effectively separating complex time series into frequency-specific components.By incorporating both TCN and LSTM,the hybrid model enhances feature extraction and effectively captures longterm dependencies.Key contributions of this study include:
1) Data decomposition and denoising techniques are rarely applied in research on electricity price series forecasting.This paper employs WPD to refine time series data by identifying potential fluctuation patterns and isolating sporadic influences.Compared to other algorithms, WPD demonstrates superior denoising effectiveness, improving the predictive model’s ability to understand price fluctuation patterns and underscoring the importance of data denoising in electricity price forecasting.
2) This paper proposes a TCN-LSTM model capable of parallel computations, flexible receptive adaption,and advanced data processing.These characteristics enhance the model’s applicability and flexibility,demonstrating its reliable accuracy in electricity price forecasting while also highlighting its robustness in addressing various electricity price prediction scenarios.
3) The model integrates multiple influencing factors and their interrelationships in price forecasting,with a particular emphasis on market supply and demand dynamics, thereby improving forecast reliability and accuracy.
The remainder of this paper is structured as follows:Section 1 introduces the fundamental principles of WPD,TCN,and LSTM.Section 2 presents the proposed forecasting model, which integrates WPD with a hybrid deep neural network.Section 3 describes the case study and its corresponding findings.Finally, section 4 summarizes the paper and outlines directions for future research.
1 Methodologies
1.1 Wavelet packet decomposition method
The WPD algorithm enhances traditional wavelet analysis by performing multiple iterations of wavelet transforms on the input sequence and representing the results in an analysis tree.Electricity prices, load, and power are influenced by various factors,resulting in complex time series data.WPD effectively analyzes these series across multiple frequency bands,extracting stable and periodic signal components essential for feature extraction in further analysis.Additionally, WPD mitigates noise in time series data, filtering out high-frequency components from electricity prices and related signals,thereby stabilizing the data and facilitating subsequent modeling.
Applying WPD to time series enables the extraction of distinct frequency components from the signal sequence,allowing for the independent selection of frequency spectra that align with the characteristics of the time series data.This process enhances time-frequency resolution, providing a precise foundation for capturing subtle variations within the data.The fundamental principle of WPD involves decomposing a signal into separate frequency bands using orthogonal high-pass and low-pass filters,thereby enabling a detailed analysis of different frequency components.This multi-band decomposition method is particularly well-suited for complex and highly volatile time series data, allowing the model to manage dynamic fluctuations in prices and load demands more effectively.
The steps for performing WPD analysis on time series data are as follows:
1) Select a suitable wavelet filter, apply the wavelet packet transform to the sampled signal,and generate wavelet packet coefficients in a hierarchical tree structure.This process enables the WPD algorithm to capture detailed information by decomposing the signal into multiple frequency bands, allowing for a comprehensive analysis across the entire frequency spectrum.The decomposition process is governed by the calculation of node coefficients, as illustrated in Eq.(1).This hierarchical approach ensures that both high-frequency noise and lowfrequency trends are effectively isolated, enhancing the model’s ability to identify relevant patterns and fluctuations within the data.
where  and
and  represent the decomposition coefficients corresponding to nodes at the j-th level of the hierarchy, respectively; h2m l and g2m l denote the lowpass and high-pass filter banks, respectively.These filters facilitate the separation of signal components by frequency, with the low-pass filter capturing broader trends and the high-pass filter isolating finer details.
2) Decomposition based on wavelet functions
The application of WPD relies on a set of orthogonal wavelet functions.Commonly used wavelet functions include the Daubechies (dbN), Biorthogonal wavelet systems, and Symlets.The wavelet functions within the dbN wavelet system are defined in Eqs.(2)-(4).
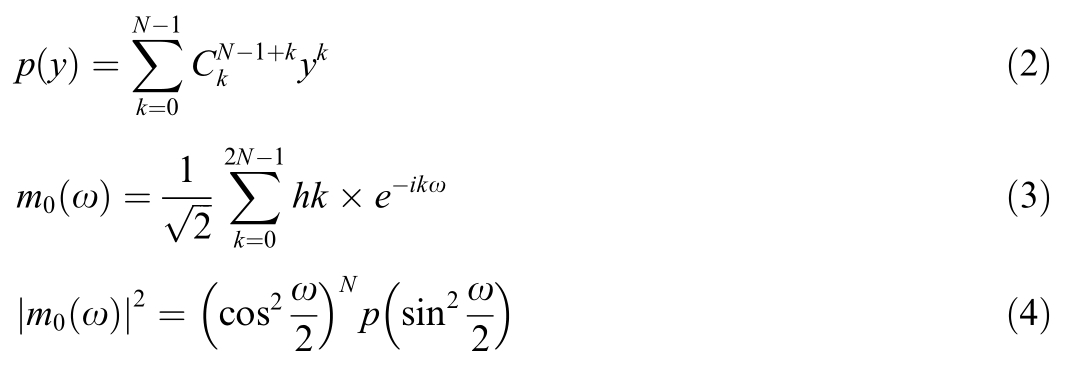
Moreover, as shown in Eq.(5), when applying WPD within the wavelet function system,it is essential to ensure that the high-pass and low-pass filter coefficients remain orthogonal.
3) Performing threshold denoising on the wavelet packet signal
Thresholding plays a fundamental role in denoising wavelet packet signals.The criteria for setting thresholds can be defined using adaptive thresholding methods.
4) Reconstruction of wavelet packet coefficients
To restore the time series after noise reduction, the denoised information from each decomposed frequency band must be reassembled.The reconstruction process follows the algorithm presented in Eq.(6).Furthermore,Fig.1 illustrates the WPD process and the reconstruction of the time series data through a structured flowchart.
1.2 Temporal convolutional network
TCN is a specialized neural network architecture designed to process time series data effectively by incorporating the strengths of Convolutional Neural Networks.The TCN model utilizes causal convolutions to preserve the temporal order of sequences, dilated convolutions to capture long-range dependencies without significantly increasing computational complexity,and residual connections to ensure efficient gradient flow through the network.
1) Causal Convolution
TCN calculations are governed by strict temporal rules to prevent future data from influencing current predictions,ensuring that information at each time step depends only on preceding data.To satisfy the causal convolution requirements and maintain alignment between the output length and the input length, zero padding is applied to the left side of the hidden layer tensor.
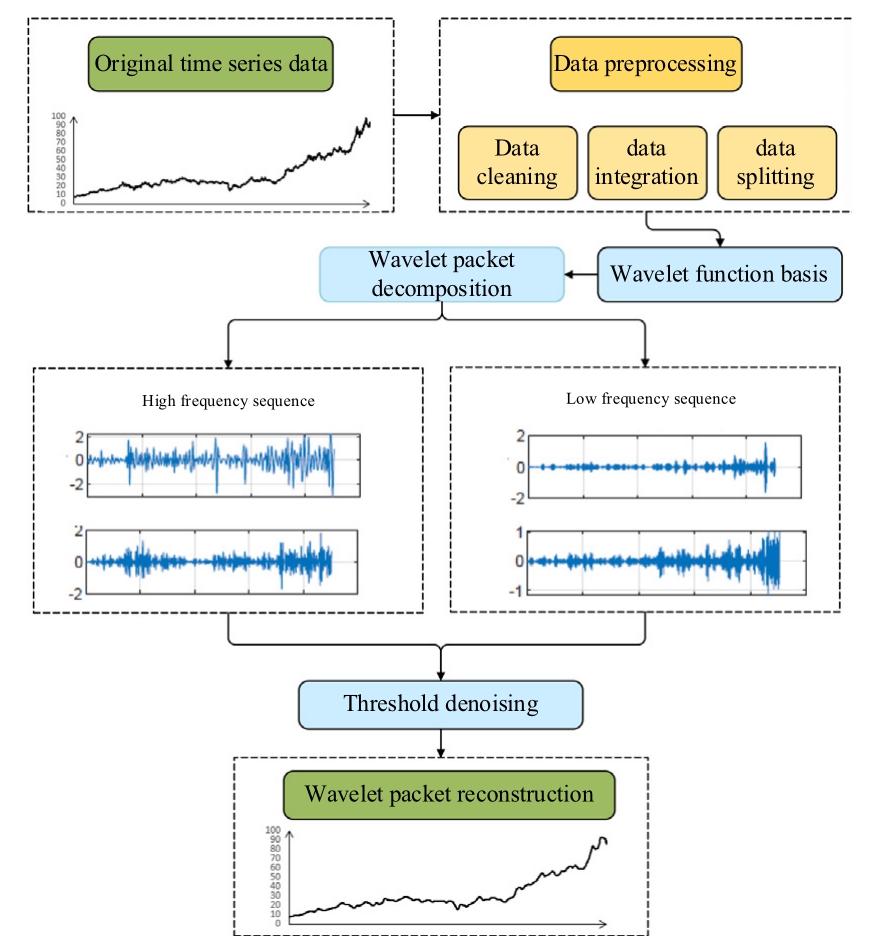
Fig.1.Schematic representation of WPD and threshold denoising.
2) Extended convolution
Dilated convolution enhances the model’s receptive field by periodically sampling the time series.This enables the model to capture long-term dependencies within the series while maintaining a computational cost comparable to that of adding more layers and parameters.The wide receptive field is achieved by sampling at exponentially increasing intervals through dilated convolution.As shown in Eq.(7), there is a direct relationship between the convolution kernel and the dilation factor in relation to the receptive field in the TCN.
where d represents the expansion coefficient, which indicates the size of the convolution window; and b denotes the extended base.
The extended convolution operation applied at time t is formally represented in Eq.(8), showcasing the model’s ability to process time series data across multiple scales.
where x represents an element in the sequence X,and f signifies a filter.
3) Residual connection
To enhance accuracy and prevent the TCN model from discarding important data during cross-layer feature extraction,the network incorporates residual convolution,which allows features from lower layers to be passed on to higher layers.The process of residual linking is outlined in Eq.(9).
Fig.2 illustrates the operation of causal dilated convolutions and skip-layer connections within the residual convolution framework.In this structure, the weight normalization module adjusts the weight vector to maintain balance, while the ReLU activation function refines output values by converting them into non-negative numbers,thus encouraging a more streamlined,sparsely represented model, as demonstrated in Eq.(10).The dropout module helps combat overfitting by selectively setting certain neuron weights to zero during training based on a predefinedprobability,therebyenhancingmodel generalization.
1.3 Long and short-term memory algorithm
Unlike traditional recurrent neural networks, which often face challenges such as gradient explosion,vanishing gradients, and limited memory for historical data in long sequences, LSTM networks utilize gating mechanisms to address these issues effectively.
These gates — the input, forget, and output gates —work together to regulate the flow of information,enabling LSTMs to selectively retain essential information over time while discarding irrelevant data.
Fig.3 illustrates the internal structure of the LSTM memory cell, which is crucial for the model’s capacity to manage dependencies across time steps.
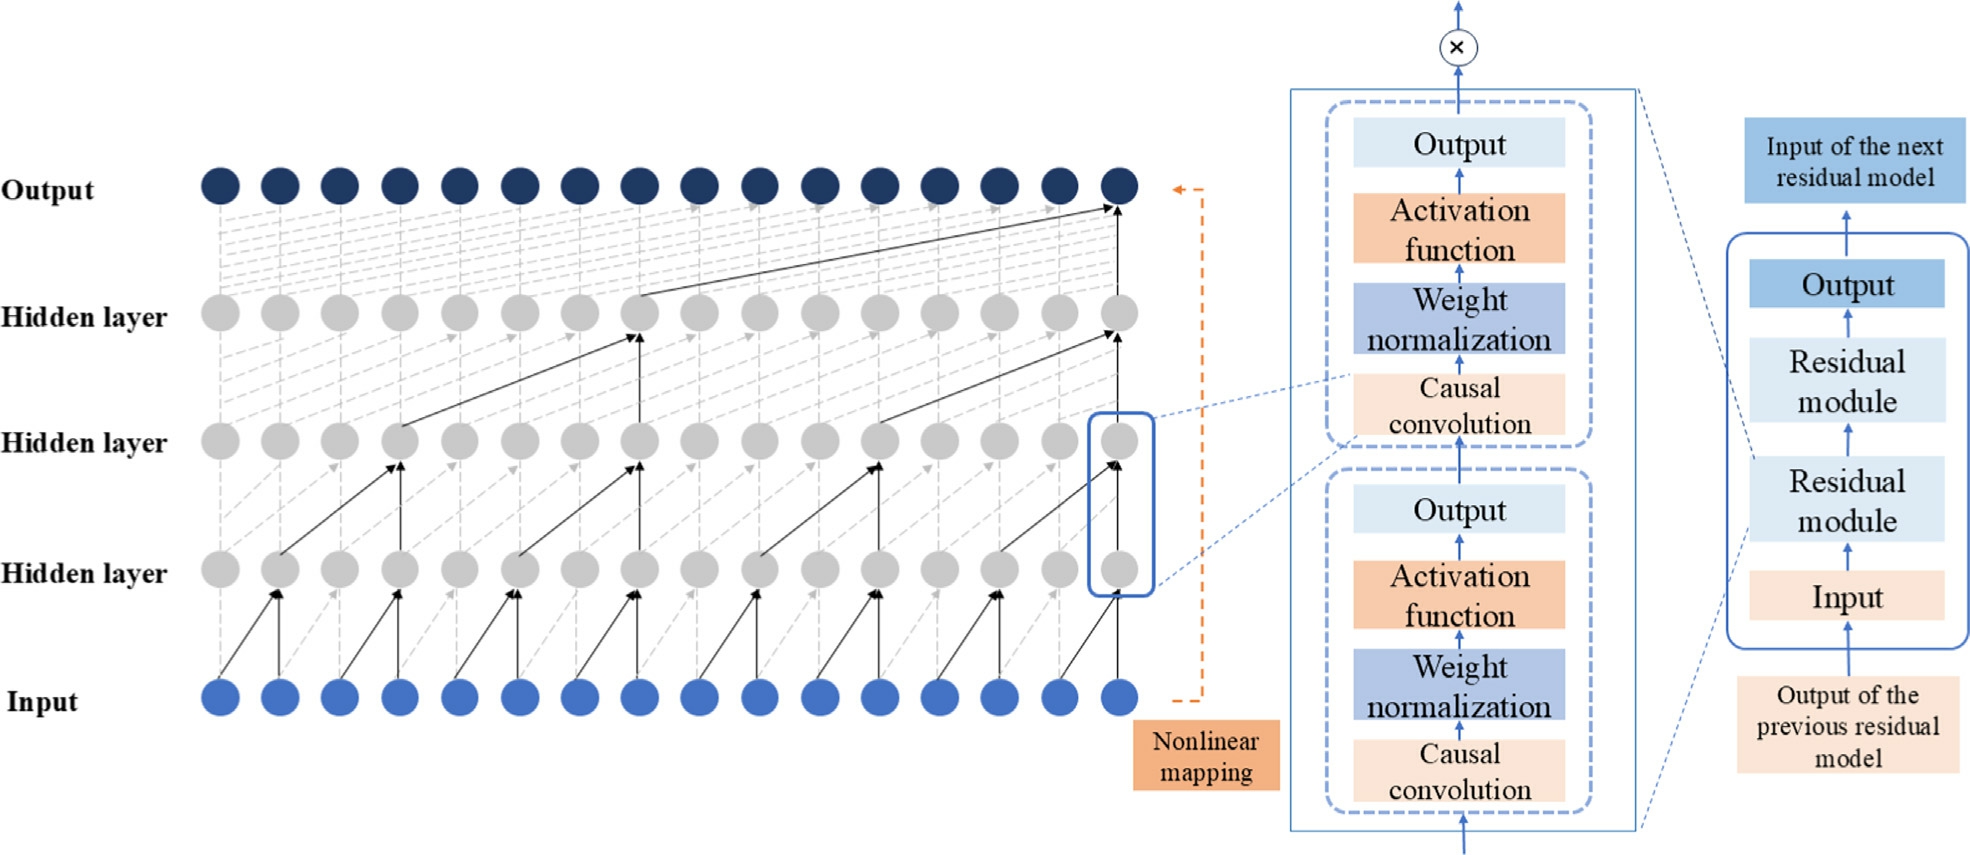
Fig.2.Schematic diagram illustrating the expanded convolution’s residual connection structure.
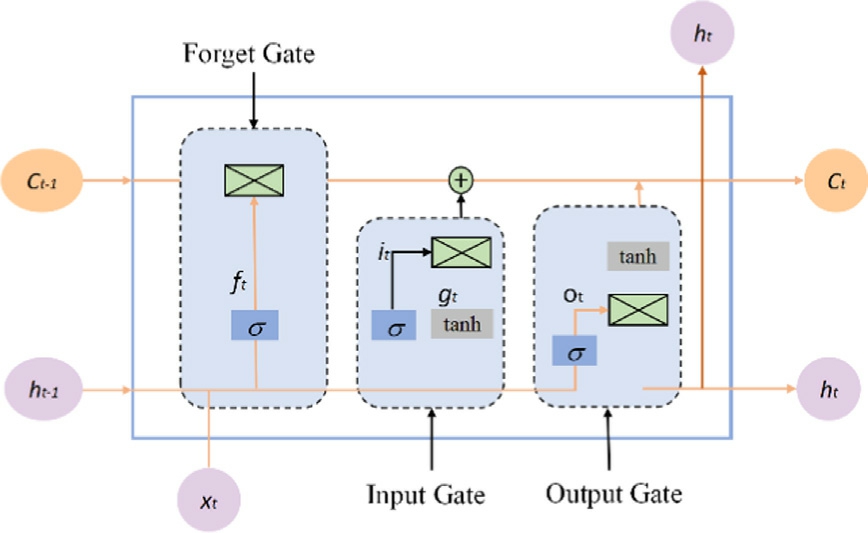
Fig.3.Schematic representation of the LSTM unit structure.
The LSTM unit cell processes information in the following four stages.
1) Discard information
The LSTM unit cell discards specific stored information based on the decision of the forget gate.This gate combines the current input with the previous output to determine the state of the data within the cell.A value of 1 indicates full retention, while a value of 0 indicates complete disposal.The forget gate’s processing flow is illustrated in Eq.(11).
where ft is the forget gate; σ is the sigmoid function; and W f and bf denote the weight matrix and bias associated with the forget gate.
2) Determine updated information
The input gate decides which new information should be retained within the cell.A tanh layer generates a candidate vector, which is then added to the cell state, while a sigmoid layer regulates the specific information to be updated.The processing steps of the input gate are shown in Eqs.(12) and (13).
where it is the retention value of the input information,Wi is the bias of the input gate, Ct is the candidate cell state,and bi and bc are both biases.
3) Update unit status
ft is responsible for discarding old information, while it determines which new information to retain after updating the cell state, based on the settings of the forget gate and update gate.Eq.(14) depicts the updating procedure.
where Ct denotes the state of the unit,and Ct 1 signifies the information retained in the neural unit at the previous time step.
4) Output results
The processed information is then weighted by a coeffi-cient,enabling the model to adaptively adjust the influence of each data point, ultimately yielding the final output.The detailed processing steps of the output gate are presented in Eqs.(15) and (16).
where ot is the output gate, Wo and bo denote the weight matrix and bias of the output gate,and ht signifies the hidden layer output of the cell unit.
2 Forecasting model for the electricity spot market
The method is structured into five sequential modules.Initially,the dataset undergoes thorough cleaning and segmentation to prepare for analysis.Subsequently,the WPD algorithm decomposes the time series,isolating underlying fluctuation trends and improving the model’s sensitivity to significant market shifts.The TCN then captures essential features, focusing on short-term dependencies, which are further analyzed by the LSTM model to produce refined forecasts.The final stage involves a comprehensive error analysis using multiple evaluation metrics to assess model robustness and precision.
2.1 Data preprocessing
Time series data acquisition often encounters abnormalities and missing values.To address this, the moving average technique can be employed to validate and supplement the dataset, effectively reducing noise from auxiliary data sources.Before model training, the dataset is split into training and testing subsets at a 19:1 ratio to enhance model generalization.The training subset is used for model learning, enabling the development of the forecasting structure and continuous optimization of network weight parameters, while the test subset evaluates model performance.Additionally, dataset normalization—scaling feature values to the [0,1] range—helps minimize dimensional discrepancies, streamlining data processing and enhancing model robustness.
2.2 Data processing utilizing WPD and correlation analysis
By applying the WPD algorithm,the time series data is effectively decomposed into high-frequency and lowfrequency components, enabling targeted threshold-based denoising.This process enhances the model’s ability to extract meaningful features, improving electricity price forecasting accuracy by minimizing the impact of stochastic noise.In this study, the Db4 wavelet is selected for its balance of simplicity and computational efficiency, ensuring optimal data decomposition.Subsequently,either hard or soft thresholding methods are applied for refined denoising, as detailed in Eqs.(17) and (18).

where![]() 0 6745, J log2N, wj k is the wavelet coefficient after decomposition, and wj k is the wavelet coefficient after noise reduction.While soft thresholding produces smoother processed information, it may introduce issues such as blurring of edge details and potential information distortion.In contrast, hard thresholding denoising methods better preserve the integrity of signal edge characteristics.Given that electricity prices exhibit high volatility,edge information plays a crucial role in forecasting accuracy.Therefore, this study adopts the hard thresholding method for denoising the time series.
0 6745, J log2N, wj k is the wavelet coefficient after decomposition, and wj k is the wavelet coefficient after noise reduction.While soft thresholding produces smoother processed information, it may introduce issues such as blurring of edge details and potential information distortion.In contrast, hard thresholding denoising methods better preserve the integrity of signal edge characteristics.Given that electricity prices exhibit high volatility,edge information plays a crucial role in forecasting accuracy.Therefore, this study adopts the hard thresholding method for denoising the time series.
Moreover, multiple variables exert differing influences on electricity price series due to the inherent relationships among various time series.Therefore, conducting a correlation analysis for each time series before training the forecasting model can help identify key influencing factors and enhance forecast accuracy.This study employs the Pearson correlation coefficient method to assess linear correlations between variables.The detailed computation process is presented in Eq.(19).

where R represents the correlation coefficient; Smean and Kmean represent the average values of sequences Si and Ki,respectively; and q denotes the size of the data sample.A larger value of R signifies a stronger correlation,while a smaller value indicates a weaker correlation.
Correlation analysis helps evaluate the impact of various factors on electricity prices.If two or more variables show a strong correlation and exhibit similar influences on electricity prices, it is recommended to retain only one variable.This method helps minimize overfitting in the forecasting results that may arise from multicollinearity.
2.3 The forecasting model based on hybrid deep neural networks
Within the TCN-LSTM forecasting module, the architecture of the TCN layer is determined by the number and size of convolution kernels, as well as the specified dilation factor.Meanwhile, the LSTM layer is defined by its neuron count, optimized to handle sequential dependencies.The model’s final output is synthesized through a fully connected layer, which aggregates relevant features by performing a weighted matrix-vector product.This consolidation of all extracted information enhances the model’s forecasting performance.
In this model, the core of the TCN component is to apply convolution operations to extract features from the time series.For the sequence X, the convolution operation is represented as given in Eq.(20).
where F tTCN denotes the feature representation at the tth time step, F t 1 TCN is the feature representation at the (t-1)-th time step, and bTCN represents the bias term of the TCN module.
In the LSTM module, the convolution feature output from the TCN module is employed as the input to the LSTM module,allowing predictive computations to be performed within the neurons of the LSTM module.The corresponding computations are described in Eqs.(21)-(26).
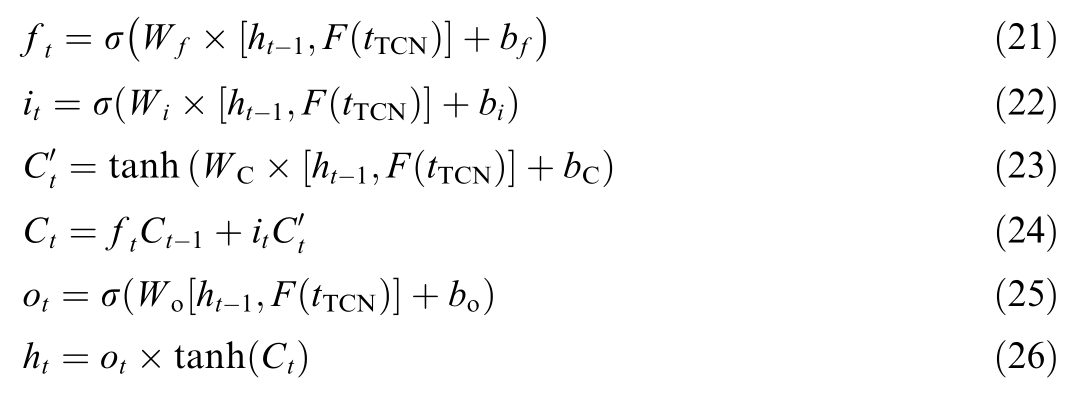
Then, in the fully connected layer, the hidden states from the LSTM module serve as the foundation for predictive calculations.The final prediction result is derived through weighted processing in the fully connected layer,as shown in Eq.(27).
where Ph denotes the final output prediction result, wy indicates the weight matrix of the fully connected layer,and by denotes the bias term of the fully connected layer.
Finally, iterative training is performed by minimizing the loss function between the actual values and the predicted values.In this experiment, the MSE is employed as the loss function for training, as shown in Eq.(28),allowing the model to learn from the time series data and make accurate predictions.
2.4 Forecasting results analysis
In this study,a comprehensive evaluation of the model’s forecasting accuracy is conducted using three key performance metrics: Mean Absolute Error(MAE),Mean Absolute Percentage Error (MAPE), and Root Mean Square Error (RMSE).The specific computational formulas for each metric are detailed in Eqs.(29)-(31), illustrating their respective contributions to evaluating model robustness and predictive precision in forecasting electricity prices.
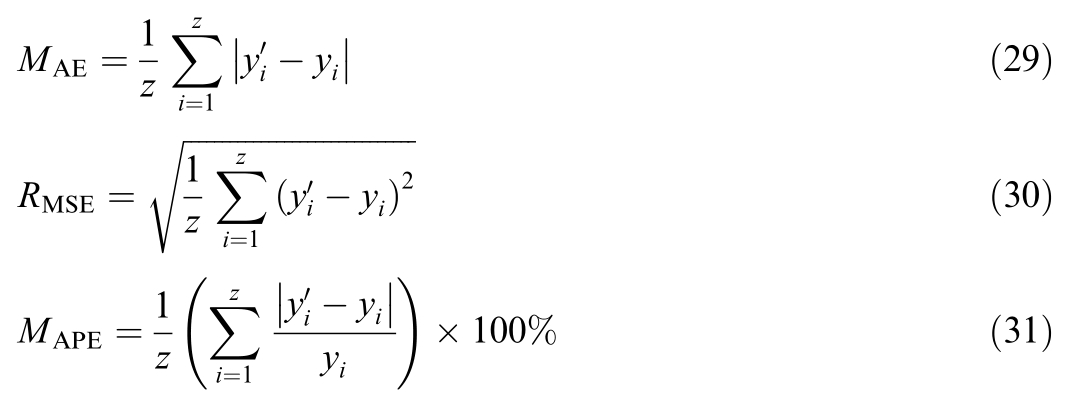
where z represents the number of data points in the test set, yi represents the forecasted electricity price produced by the model, and yi signifies the actual value of the electricity price data.
Fig.4 presents the unified framework of the WPD and hybrid deep neural network forecasting model developed in this research.
3 Case study
3.1 Case 1:Assessing the predictive accuracy of the proposed model
3.1.1 Dataset source
To rigorously assess the forecasting accuracy of the proposed method, historical data from the UK spot market,including electricity prices, load demand, nuclear power,photovoltaic output, and wind power generation, were employed for model training and validation.The dataset covers the period from January 2015 to January 2019.Fig.5 illustrates the time series of historical electricity prices, offering critical insights into price dynamics over multiple years.In this study, the dataset is partitioned into a training set and a testing set.The training set is used for model learning and parameter optimization.The testing set is the portion of the dataset reserved for testing the model’s performance after training.
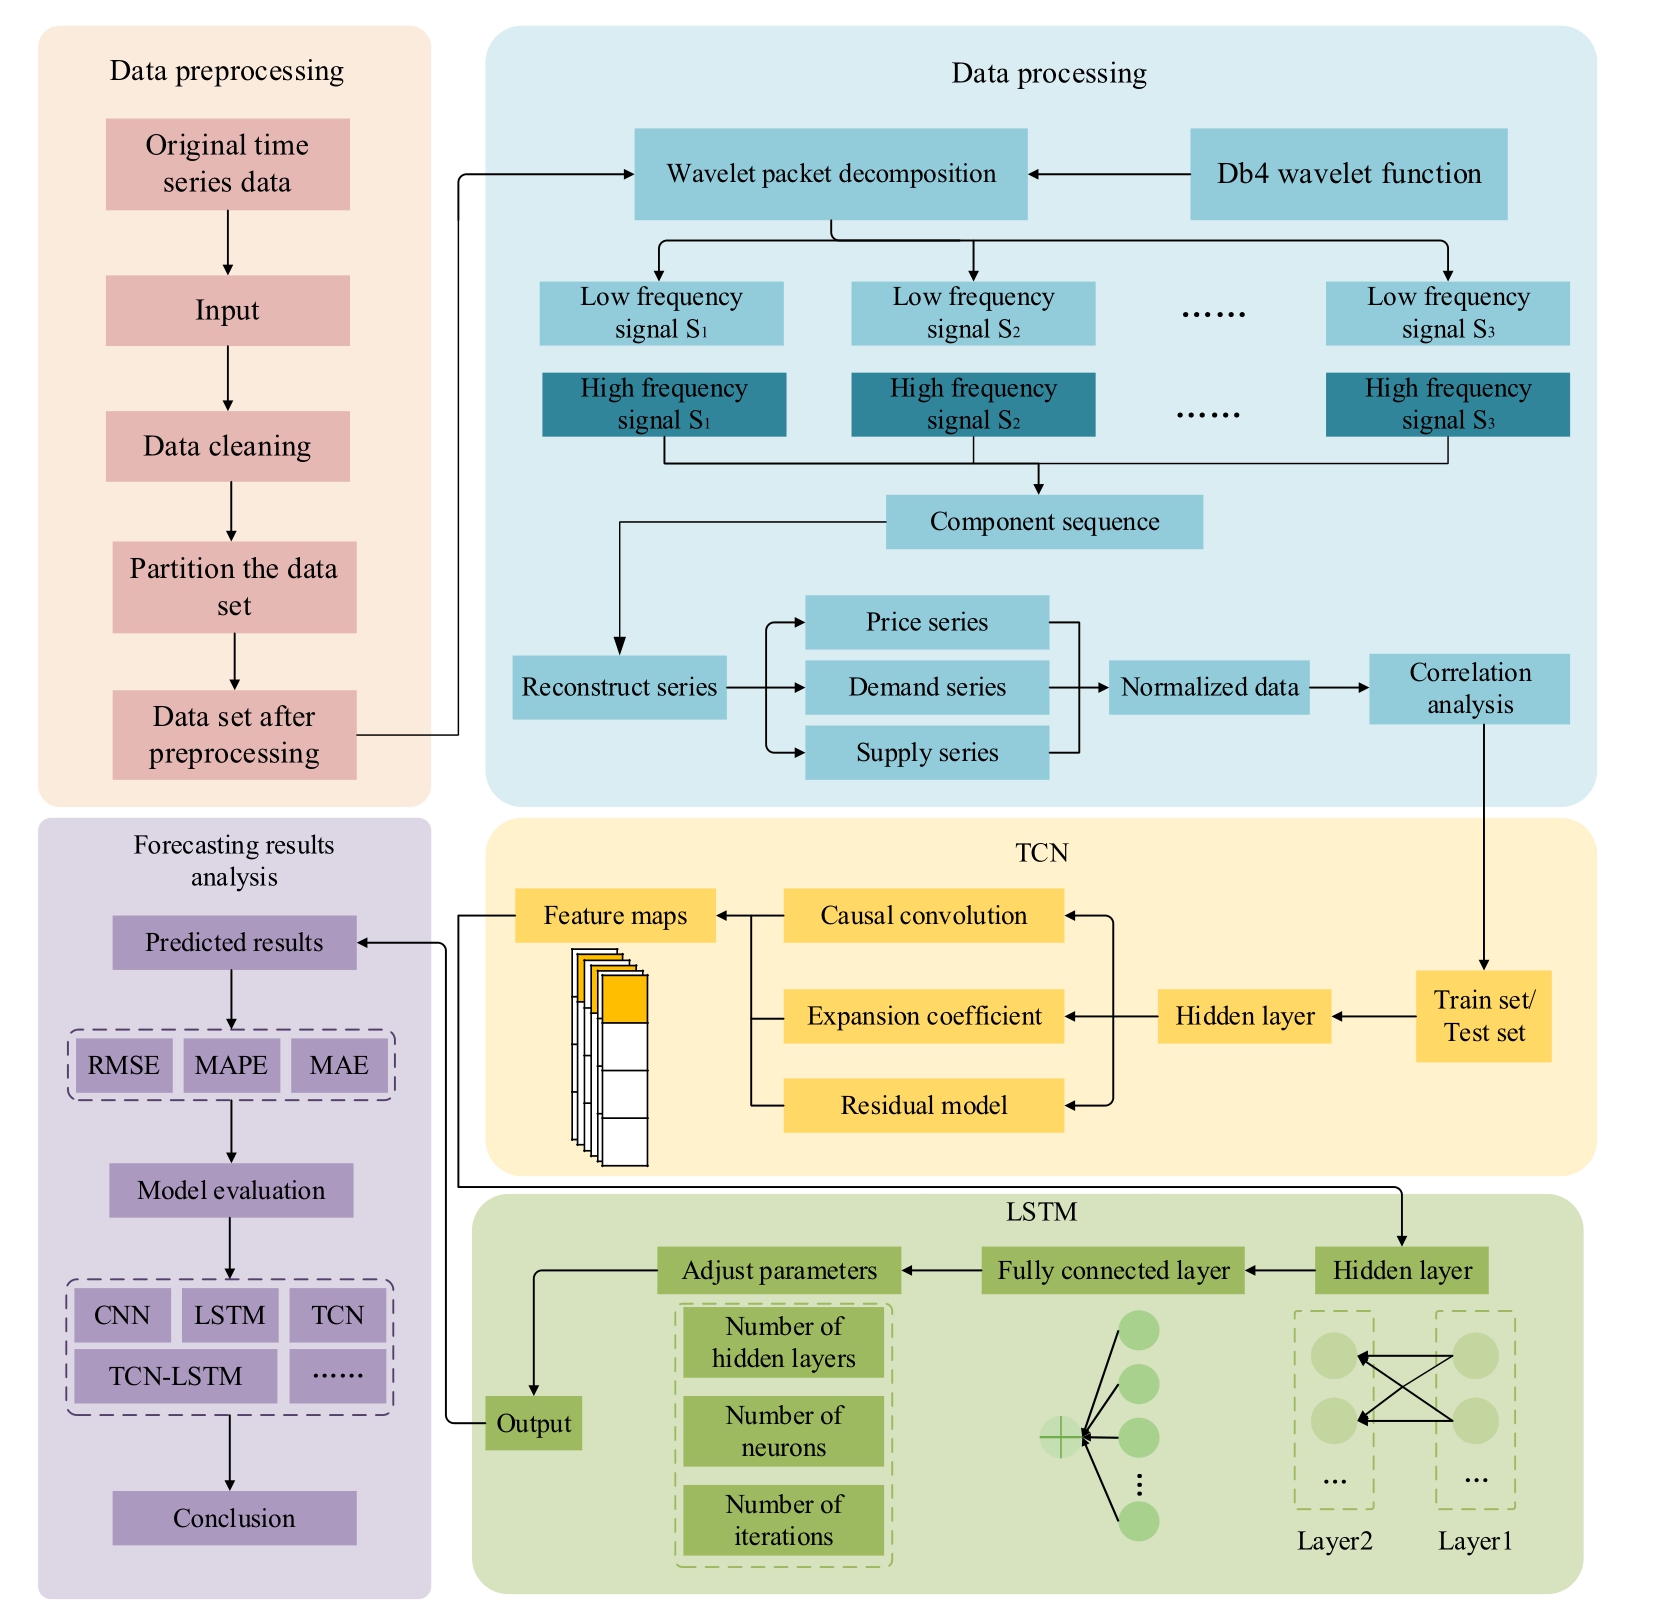
Fig.4.Diagram illustrating the workflow of the WPD combined with a hybrid deep neural network forecasting model.
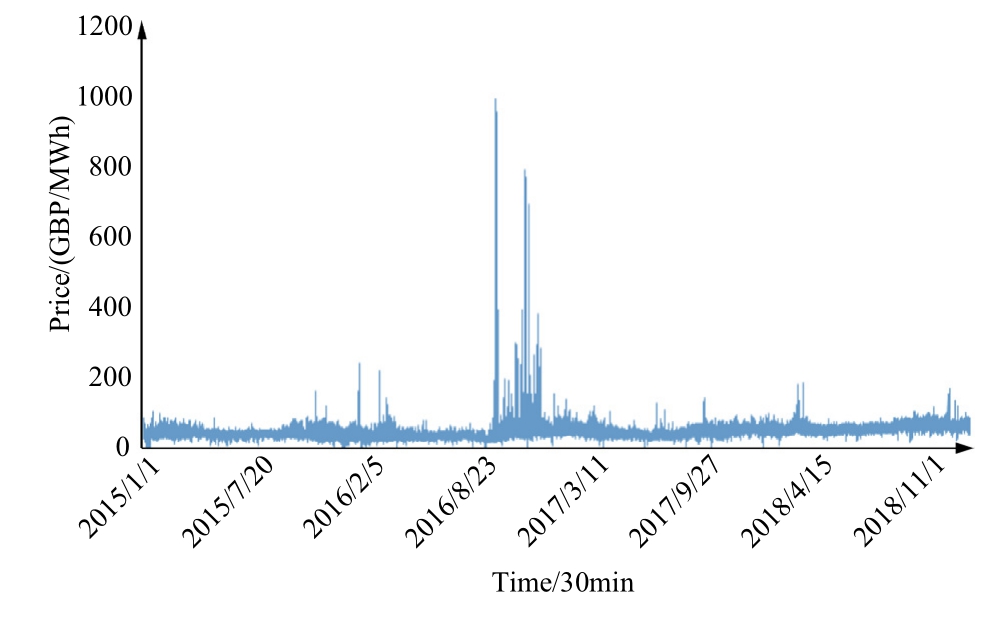
Fig.5.Historical electricity price time series data.
The data decomposition was conducted using the WPD algorithm in MATLAB,which utilizes its signal processing toolbox to provide ready-to-use functions for wavelet transforms and WPD.The hybrid deep neural network forecasting model was developed and trained in PyCharm utilizing Python, leveraging the TensorFlow framework and Keras library to optimize the model’s deep learning capabilities.
3.1.2 Source of the dataset
1) Data signal denoising analysis
The original data series contains noise, complicating model forecasting.To address this, WPD can be utilized for time series decomposition and denoising.Fig.6 and Fig.7 illustrate the node signals and corresponding spectra obtained by decomposing the historical electricity price time series.
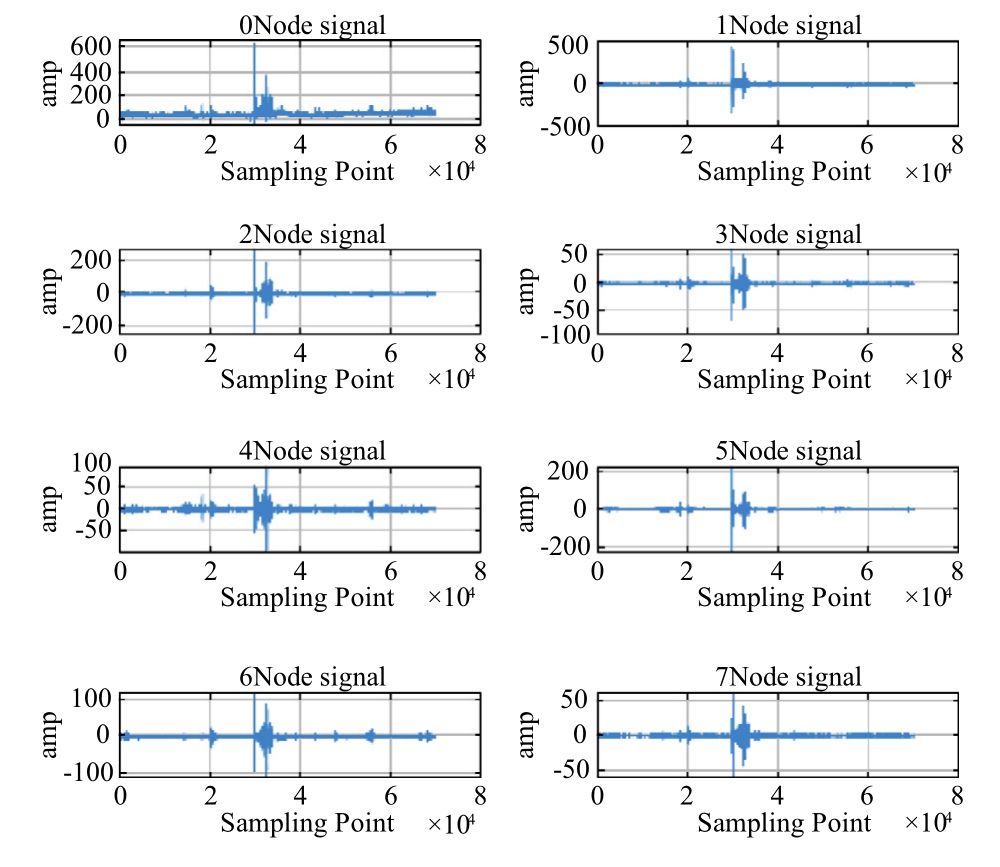
Fig.6.Coefficients of signal decomposition for nodes.
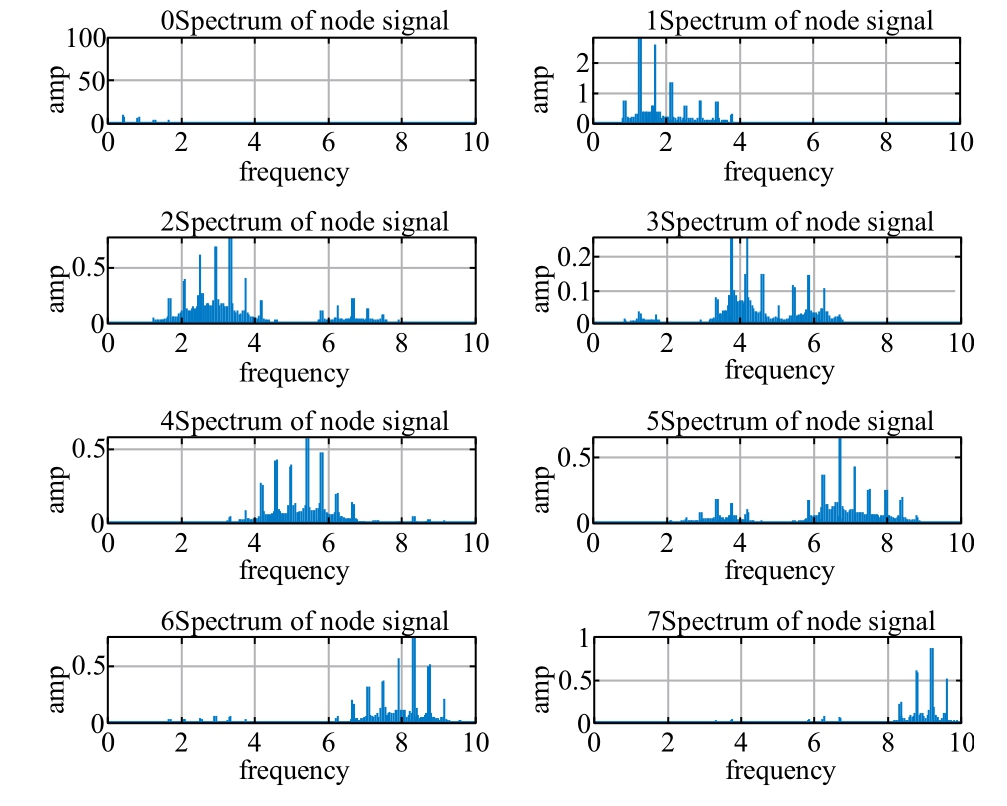
Fig.7.Signal spectrum for each node.
The node signal spectrum analysis reveals a decline in frequency component amplitudes as frequency increases,with most of the electricity price signal’s energy concentrated in the low-frequency component.Specifically, the 0 node comprises approximately 96% of the total signal capacity, highlighting its primary role in capturing essential data trends.As a result, the 0 node is preserved as a key feature of the electricity price signal, while highfrequency nodes,representing decomposed noise,are effectively reduced through thresholding techniques to improve data clarity.
To preserve critical edge information in the time series,a threshold-based denoising method is applied,addressing the dataset’s inherent high volatility, short fluctuation cycles,and significant amplitude variations.This denoising process refines the data series by reducing outliers and anomalies compared to the original, leading to a notably lower peak value.By clarifying overarching data trends,this adjustment enhances the model’s feature extraction capabilities while mitigating the impact of outliers.As an illustrative example, September 27, 2017, serves as a benchmark day;Fig.8 visualizes the comparative effectiveness of noise reduction for this date,highlighting the model’s improved accuracy and stability.
2) Correlation analysis of factors influencing electricity price
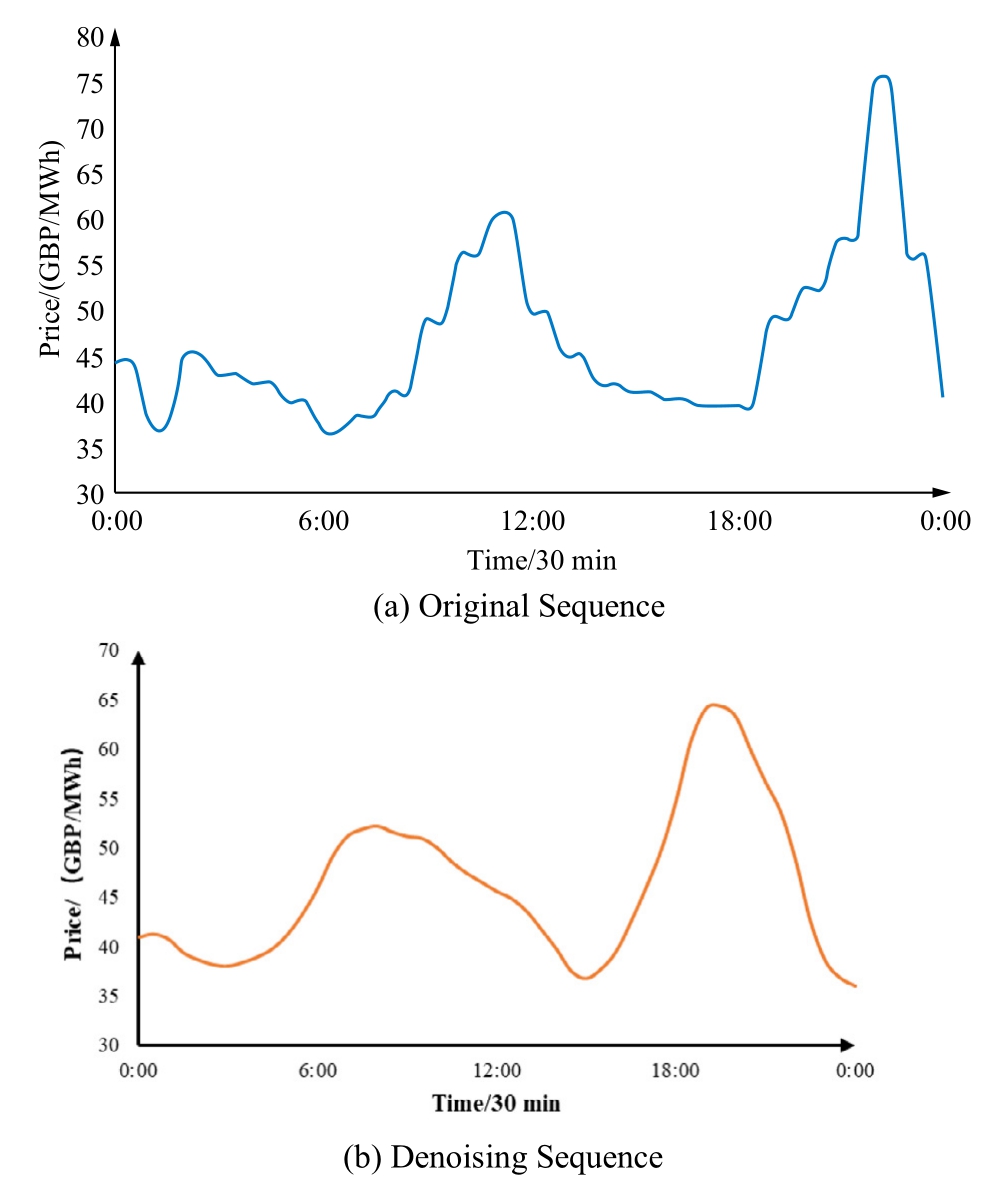
Fig.8.Time series of historical electricity prices after noise reduction.
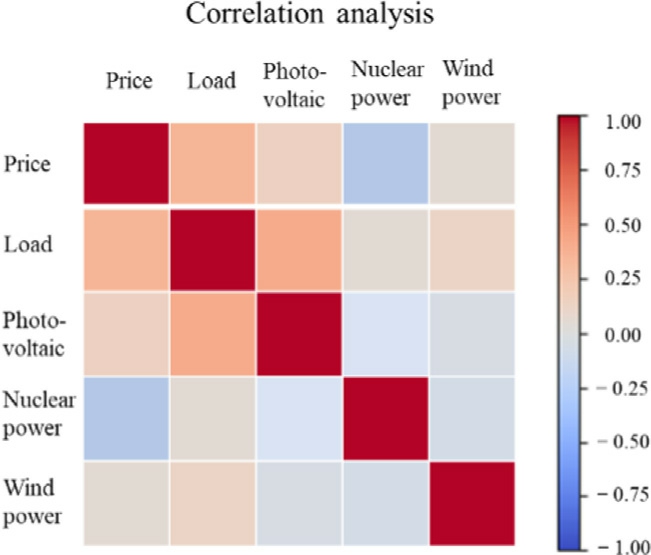
Fig.9.Correlation thermodynamic map of feature sequences.
Fig.9 presents the correlation thermodynamic map,illustrating the interrelationships among multiple time series and their respective influences on electricity price dynamics.Using Pearson correlation coefficients, this study assesses the complex associations between electricity prices and key influencing factors such as load demand,photovoltaic energy output, nuclear power generation,and wind energy production.By analyzing these relationships, this study provides deeper insights into how each factor contributes to electricity price fluctuations.This correlation assessment serves as a foundation for enhancing the predictive capacity of the model,particularly in identifying primary drivers and latent patterns within the data.
The analysis reveals a distinct inverse correlation between electricity prices and nuclear power generation,emphasizing the economic advantages of new energy sources.In contrast, load demand, photovoltaic energy,and wind power exhibit positive correlations with spot market prices, highlighting their role in shaping the supply-demand balance within the market.Notably, photovoltaic generation demonstrates a nuanced inverse relationship with electricity prices,likely due to the diurnal production cycle of solar energy.Although this effect is less pronounced than the positive influence of load demand on electricity prices, it underscores the seasonal and time-sensitive nature of photovoltaic output.As solar intensity increases during daylight hours, rising temperatures drive up load demand.Table 1 presents detailed correlation coefficients across these time series variables,providing quantitative insights into their interconnected roles in electricity pricing dynamics.
Analyzing the correlations among the time series provides deeper insights into their interdependencies, helping to isolate key components and offer valuable insights for training the model to forecast spot market prices affected by various factors.The correlation coefficients indicate that no significant associations exist among the four influencing factors,suggesting the absence of multicollinearity.This confirms that the forecasting of electricity prices based on these time series is both feasible and reliable.
3) Determination of model parameters
Following extensive parameter optimization, the TCN network was configured with three hidden layers,a convolution kernel size of 3,a dropout rate of 0.2,and an expansion coefficient array of [1,2,4,8].The LSTM layer comprises 64 neurons and utilizes the Adam optimizer to ensure efficient and stable convergence.The model was trained for 300 iterations with a learning rate of 0.0002 and a batch size of 128.This optimized configuration significantly enhances the model’s ability to capture complex temporal dependencies.
3.1.3 Forecasting results analysis
To validate the robust forecasting capabilities of the WPD-integrated hybrid deep neural network model proposed in this study, we conduct comparative analyses across several TCN and LSTM combination models.Each model incorporates five distinct time series inputs, with uniform layer configurations and parameter settings, to maintain consistency in model architecture and ensure fair comparisons.The forecasting performance of various models is demonstrated in Fig.10.
A comparative analysis of forecasting results reveals that the WPD-enhanced hybrid deep neural network model consistently outperforms individual forecasting models.While conventional single-model approaches effectively capture overarching electricity price trends, they often fall short of accurately predicting localized extreme values within the time series.In contrast, the proposed combined model achieves superior forecasting accuracy and demonstrates broader applicability in addressing the complexities of electricity price prediction.This enhanced performance can be attributed to the WPD’s effective data preprocessing, which stabilizes the input data, and the TCN’s expanded receptive field, which improves feature extraction.Together, these components enable the model to identify the essential elements critical for accurate and reliable forecasts.This integration allows the model to better capture nuanced patterns within volatile data,reinforcing its value in high-stakes electricity market forecasting applications.
Table 1 Correlation coefficients among the feature sequences.

FeaturesPricePhotovoltaicLoadWind powerNuclear power Price10.140.290.040.21 Load0.290.2510.120.05 Photovoltaic0.1410.250.090.06 Nuclear power0.210.060.050.081 Wind power0.040.090.1210.08
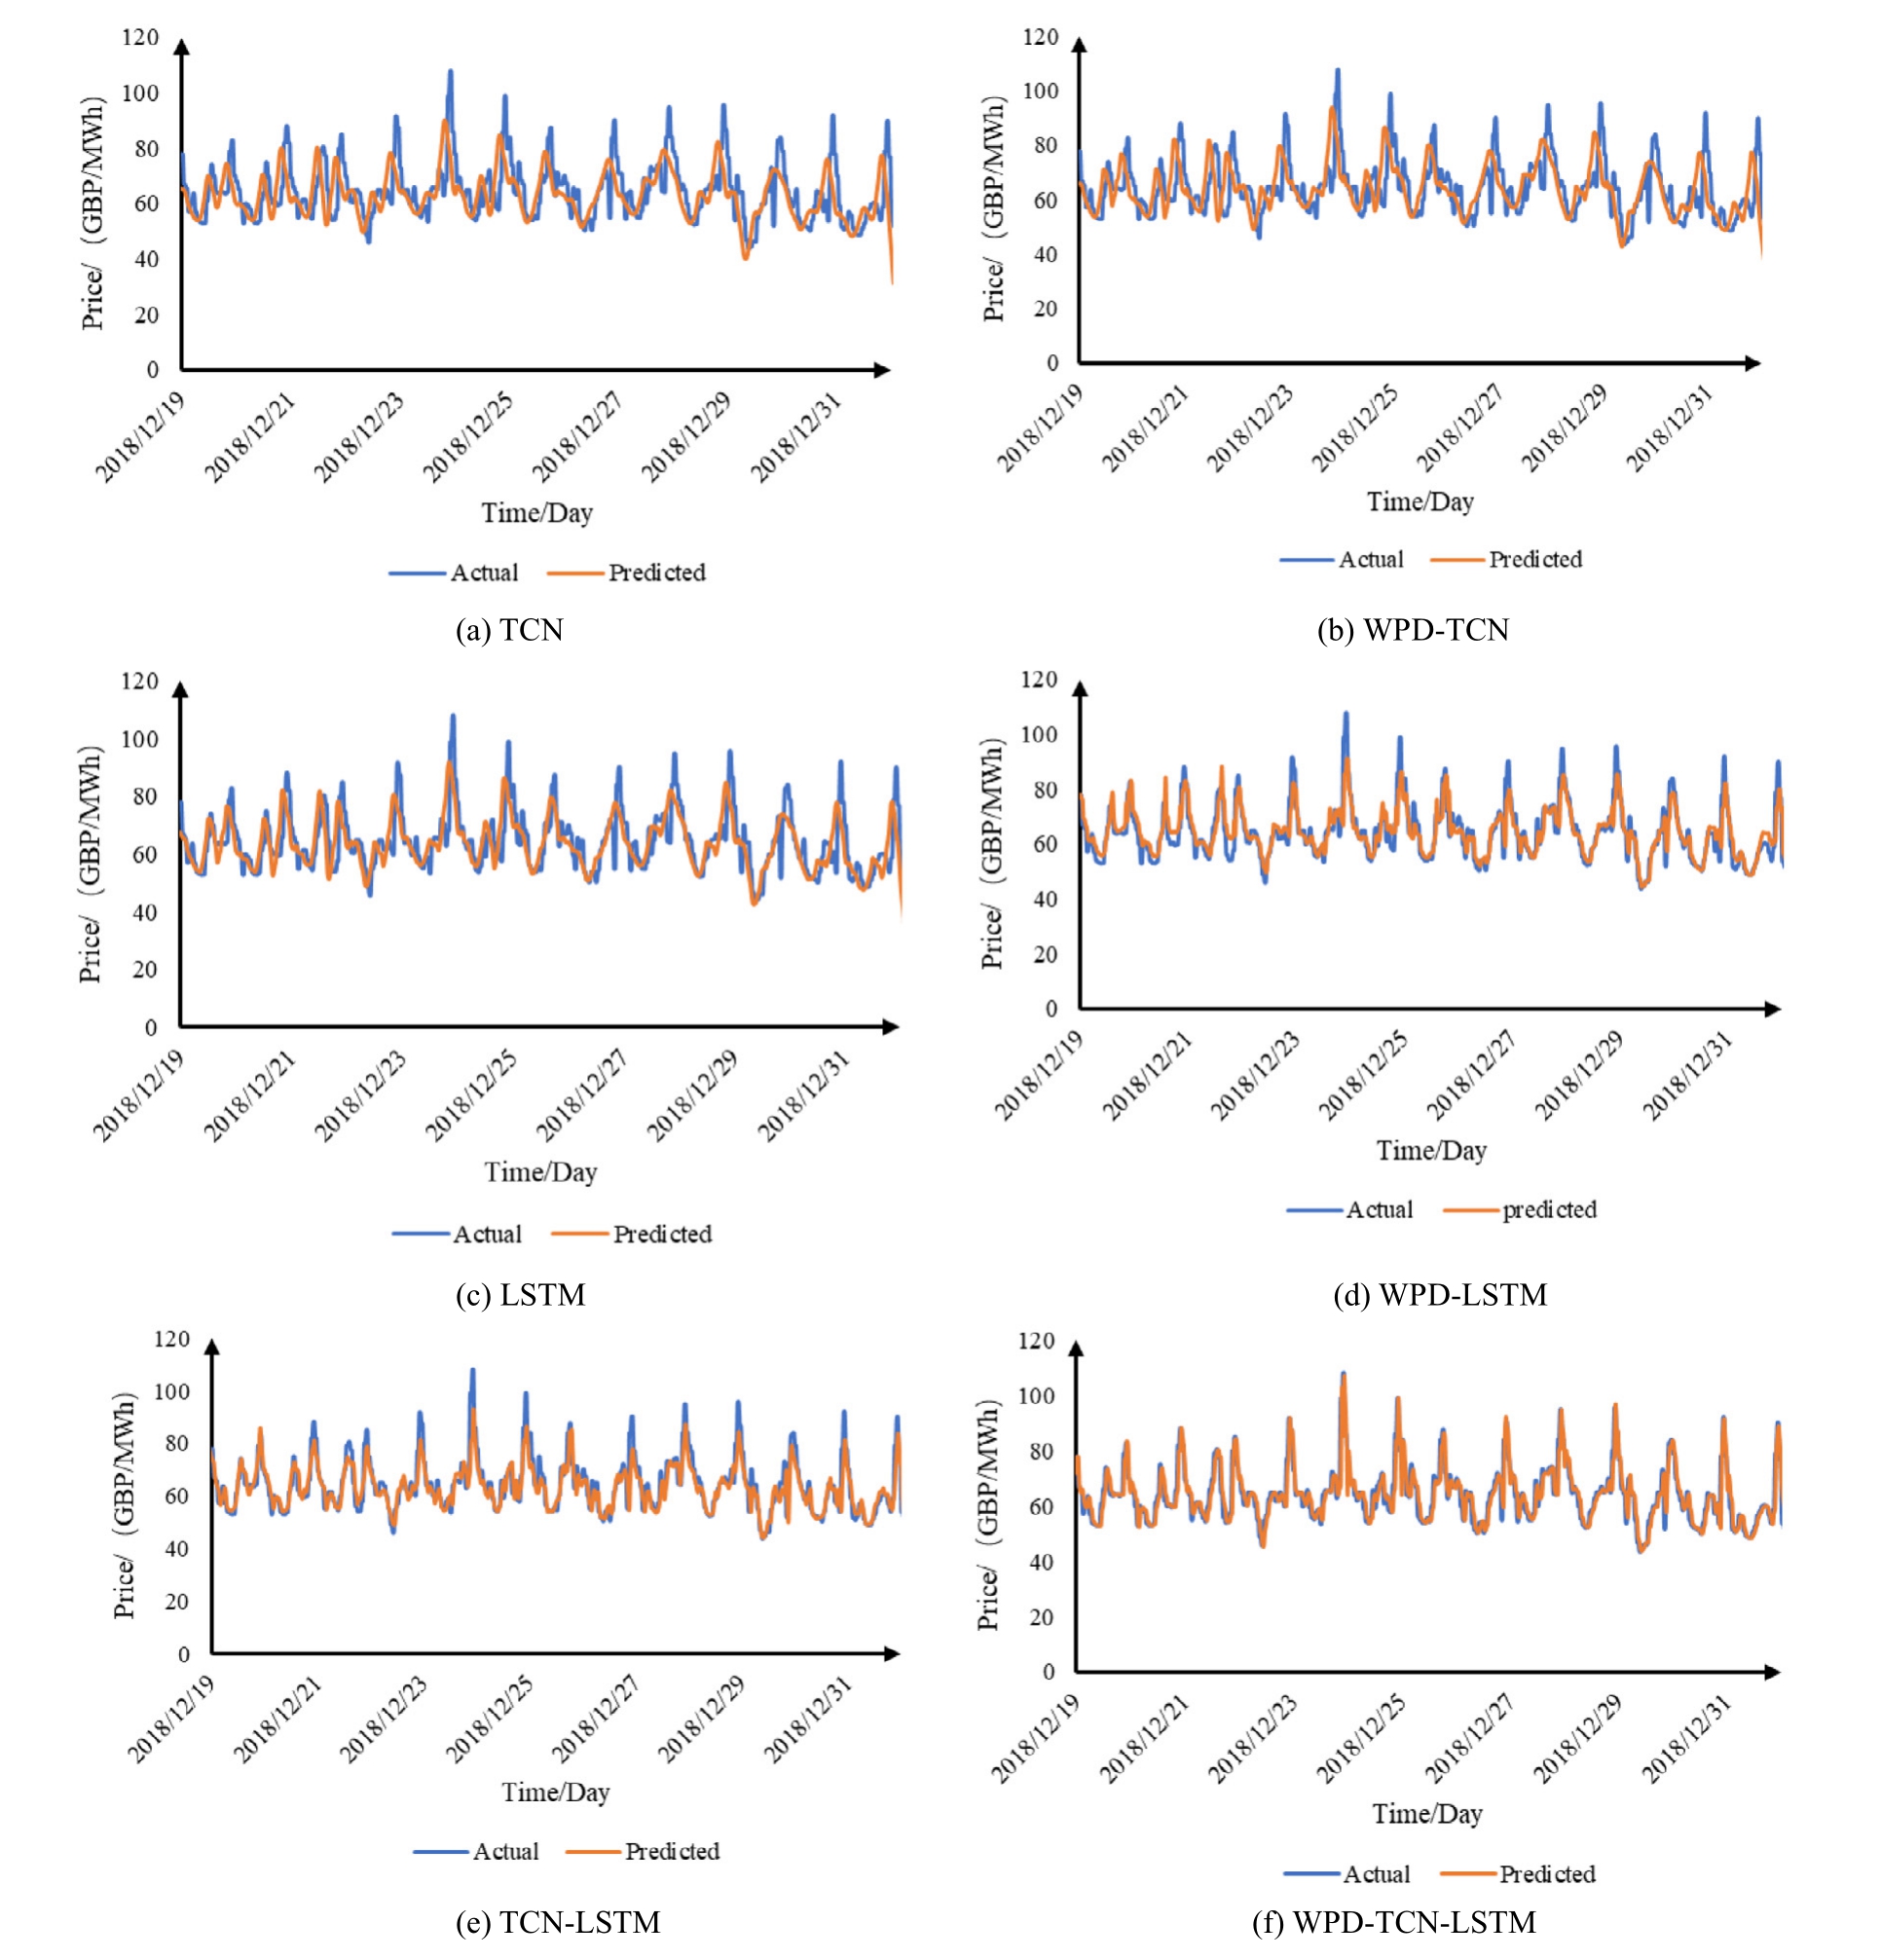
Fig.10.Forecasting performance of various models.
Additionally, the forecasting errors of the proposed model are compared with those of standard neural network models, including CNN and LSTM models with attention mechanisms.Table 2 presents this comparison,highlighting the superior performance of the WPDintegrated hybrid deep neural network model in predicting electricity prices.
The table results show that all models achieve high forecasting precision,as reflected in the MAPE and MAE metrics.The proposed method significantly improves accuracy, reducing MAE by 27.3% compared to the average MAE of other models,achieving a value of 4.00.Additionally,RMSE is reduced by 66.9%relative to the average RMSE of 5.40,while MAPE decreases by 22.8%,resulting in a value of 11.9%.These findings highlight the superiority of the WPD and hybrid deep neural network model in electricity price forecasting, as it yields the lowest error rates and strongest fitting performance.Furthermore, the combined TCN-LSTM model outperforms individual models, demonstrating the advantage of integrating these architectures to capture data characteristics and correlations.Finally, WPD’s role in post-denoising time series analysis has contributed to reducing forecasting errors across all models, emphasizing the importance of stabilizing time series data for improved forecasting accuracy.
Additionally, the proposed forecasting model enhances operational efficiency.The TCN model achieves faster computation speeds than other neural network models due to its parallel processing capability.This allows forecasting calculations to proceed independently of previous steps, enhancing overall performance.
For market decision-makers, forecasting errors can result in inaccurate judgments regarding resource allocation,cost control,and risk management.If electricity price forecasts are too high,power companies may overinvest in generation capacity,leading to resource wastage.This not only raises fixed costs but can also disrupt the balance between electricity supply and demand.
Table 2 Error comparison of different models.
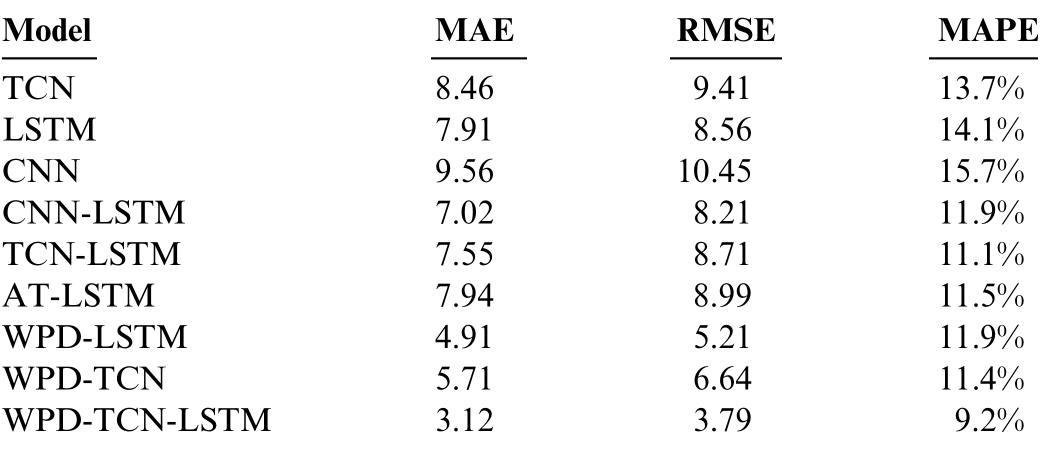
ModelMAERMSEMAPE TCN8.469.4113.7%LSTM7.918.5614.1%CNN9.5610.4515.7%CNN-LSTM7.028.2111.9%TCN-LSTM7.558.7111.1%AT-LSTM7.948.9911.5%WPD-LSTM4.915.2111.9%WPD-TCN5.716.6411.4%WPD-TCN-LSTM3.123.799.2%
At the same time, forecasting errors can lead to mistakes in procurement decisions.For instance, if a power company purchases electricity in large quantities when prices are predicted to be low, but actual prices turn out to be higher, this could significantly increase costs and reduce profits.
Consider a specific electricity sales company as an example.The company must purchase electricity when prices are low and sell it when prices rise to maximize profits.It is assumed that the company uses a forecasting model to predict electricity prices in order to formulate procurement and sales for the upcoming days.
Under an ideal procurement and sales strategy, the company purchases electricity when the price falls below 80 GBP/MWh and sells it when the price exceeds 100 GBP/MWh, aiming for an expected return rate of 25%.
1) If the forecast error is within 5%
In this scenario, the worst-case situation would involve purchasing electricity at a price 5%higher than the market price and selling at a price 5%lower than the market price.This results in a buying price of 95 GBP/MWh and a selling price of 84 GBP/MWh, respectively.The return rate would be 13.1%.Because the electricity sales company can still secure at least half of the expected profit, smaller forecast errors result in reduced profit fluctuations, allowing the company’s profitability to remain relatively stable.
2) If the forecast error is within 11%
Similarly, in this scenario, the electricity sales company has purchase and sale prices of 88.8 GBP/MWh and 89 GBP/MWh, respectively, in the worst-case scenario.This means the company is nearly at a break-even point; however, under these circumstances, the company can still maintain profitability without incurring losses.As forecast errors increase, profitability fluctuations become more pronounced, making stable returns unattainable.Therefore, the company must improve forecasting accuracy to ensure it achieves the expected profits.
3) If the forecast error is over 12%
Taking 15% as an example, the worst-case scenario would involve purchasing electricity at a price of 92 GBP/MWh and selling it at a price of 85 GBP/MWh,resulting in a company return rate of 7.6% and significant losses.Therefore, a large forecast error can lead to inaccurate purchasing strategies, ultimately impacting the overall profit level.
3.2 Case2: Evaluating model superiority with different denoising techniques
In electricity price forecasting, removing random noise from data is essential.Common denoising techniques in this field include smoothing curves, decomposition filtering, and threshold denoising, all of which can greatly improve model accuracy by effectively eliminating noise.Choosing an appropriate denoising method requires tailoring it to the specific application, as the efficacy of each technique depends on the data characteristics, chosen methods, and corresponding parameter settings.
Common signal denoising techniques encompass wavelet decomposition, WPD,Fourier decomposition, CEEMDAN, and VMD, each with unique strengths and challenges.Wavelet decomposition, for instance, divides signals across various frequencies and scales, employing thresholding to mitigate noise, benefiting from timefrequency localization and multi-scale analysis, though it requires careful wavelet basis selection to prevent overdenoising.WPD enhances frequency resolution, beneficial for complex signals but may lead to computationally intensive over-denoising.CEEMDAN, which stabilizes decomposition through noise adjustment parameters and iterative processing, minimizes overfitting risks but demands precise parameter tuning.VMD offers detailed decomposition into distinct frequency modes but necessitates careful selection of parameters such as frequency bandwidth, decomposition levels, and amplitude range.Each of these denoising techniques is applied to the dataset prior to its integration with the TCN-LSTM model for electricity price forecasting,enabling a comparative assessment of their effectiveness.This approach underscores the advantages of the proposed method, as illustrated by the model performances shown in Fig.11.
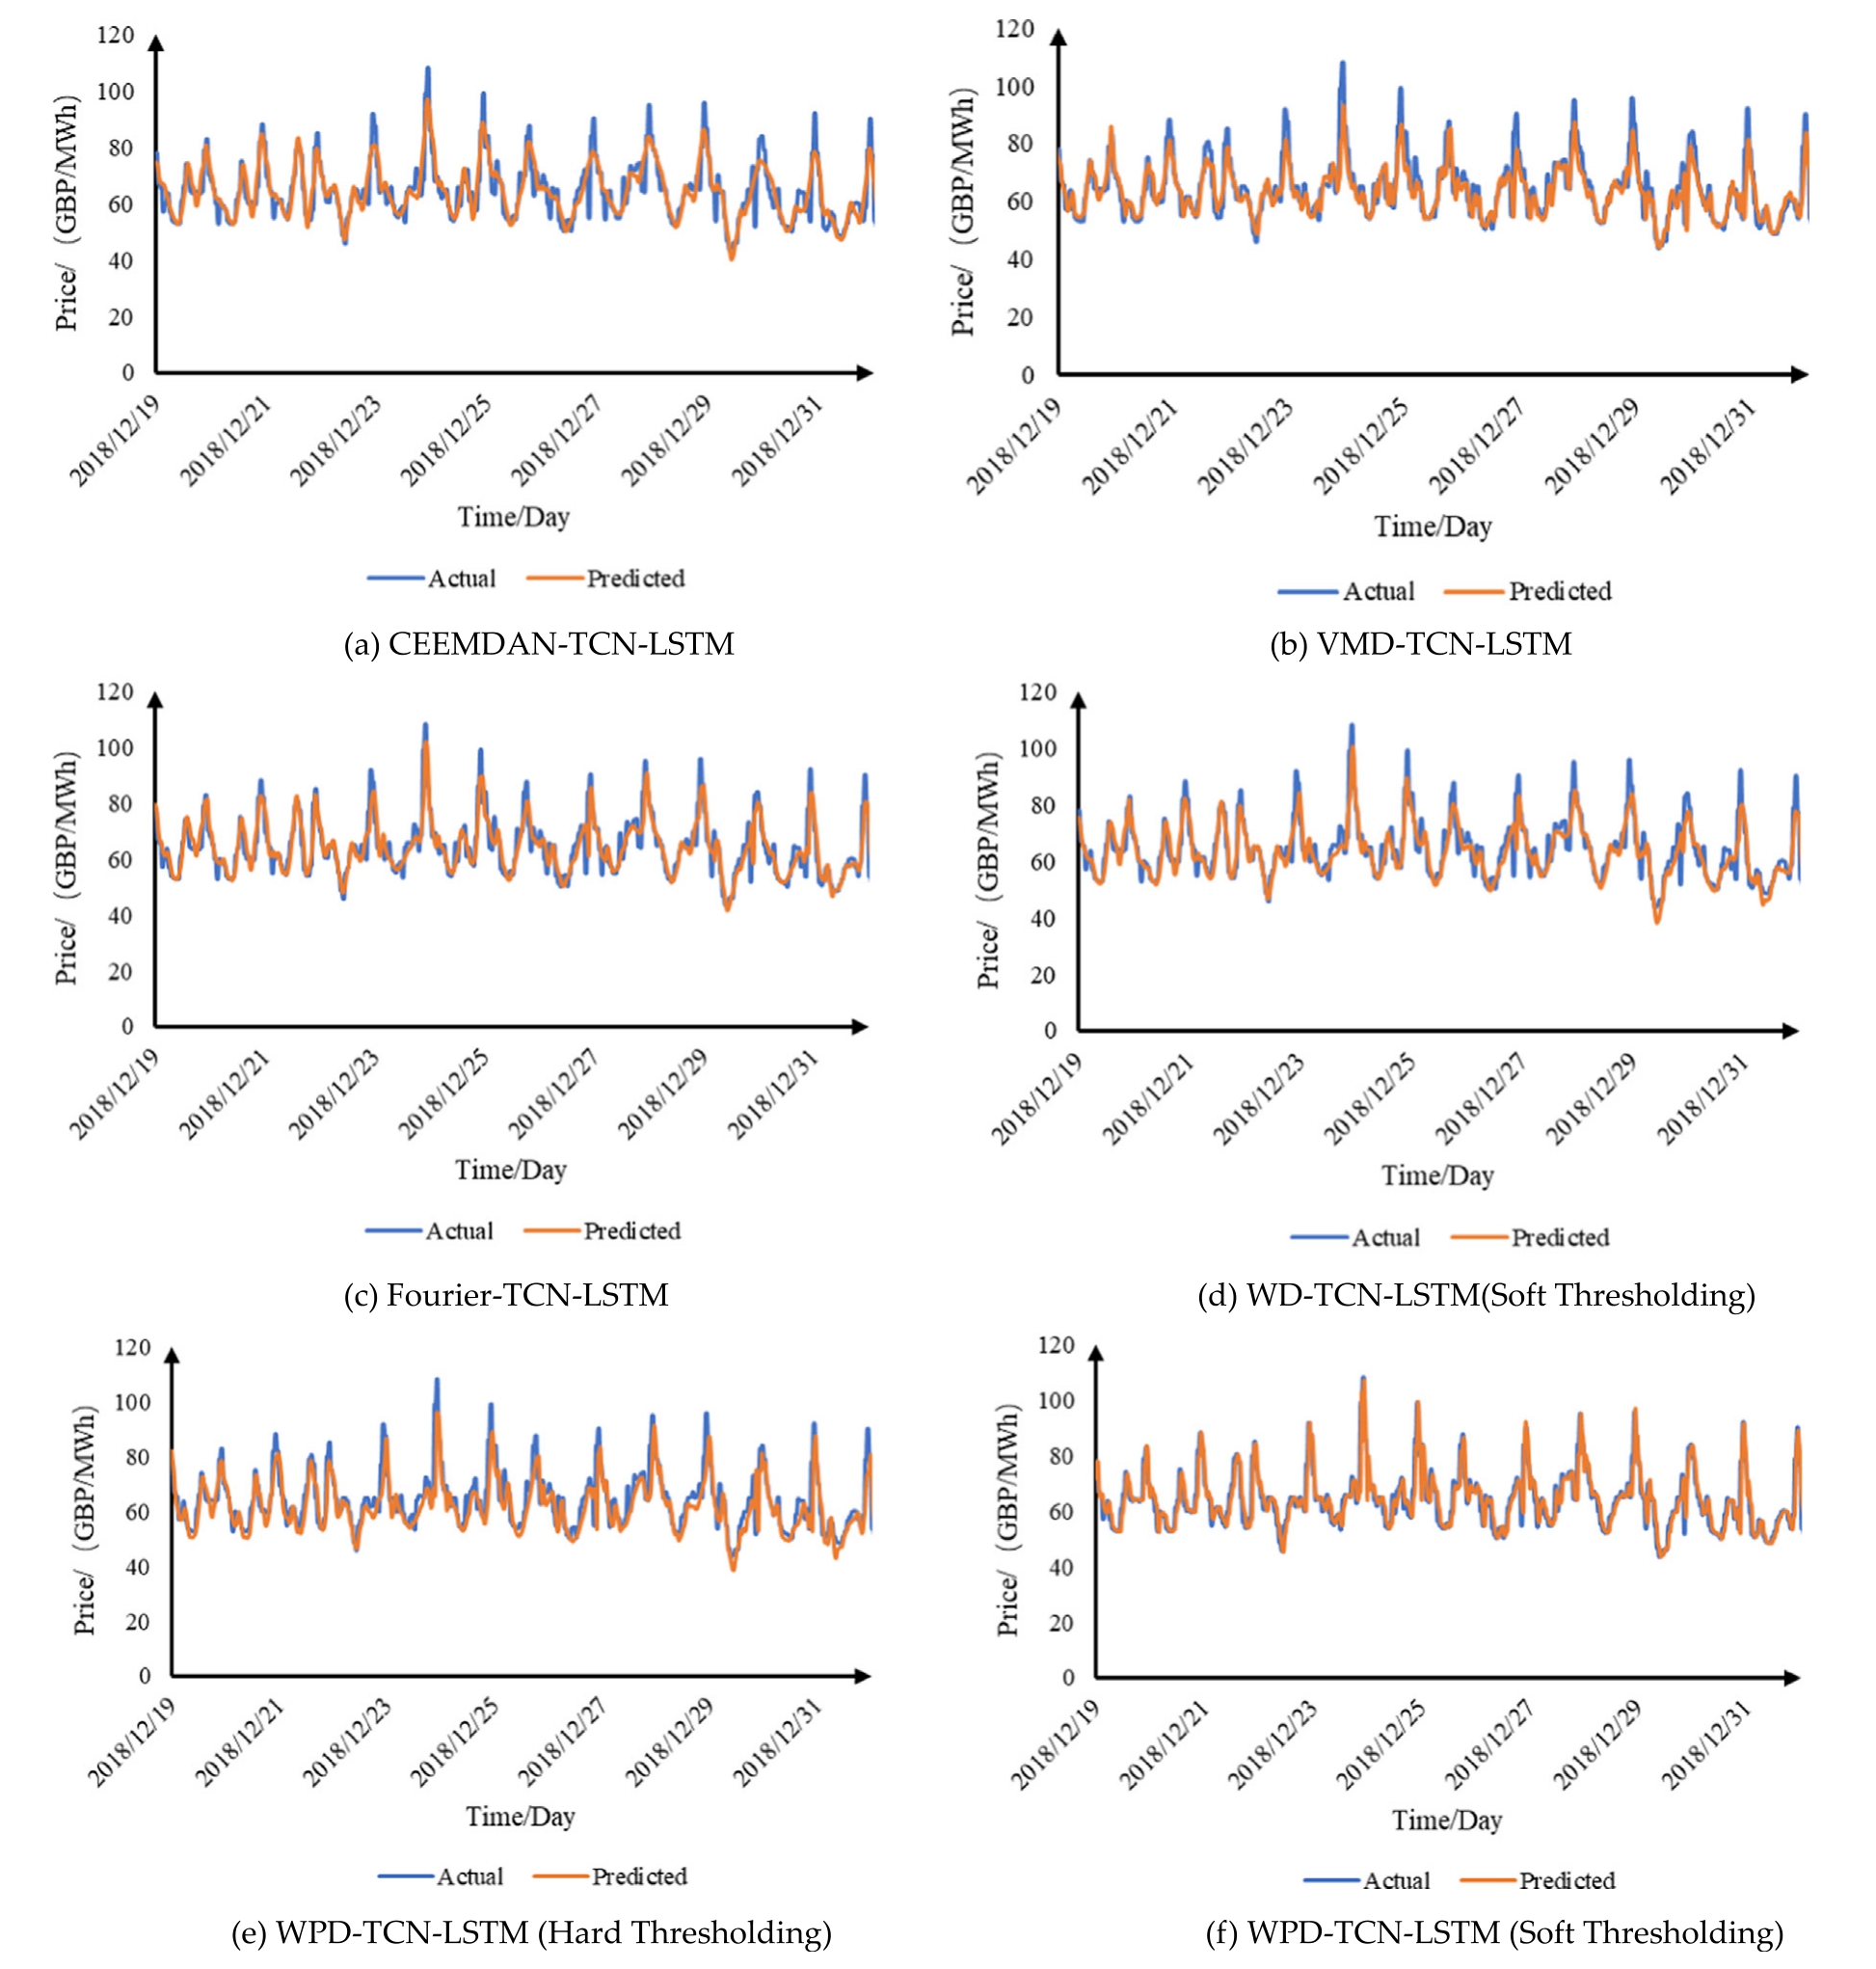
Fig.11.Comparison of prediction outcomes across various denoising methods.
The image above illustrates that incorporating a data signal denoising approach can enhance the prediction performance of power prices when using machine learning.Among the various methods,the WPD with soft threshold denoising significantly improves the TCN-LSTM model’s prediction accuracy, demonstrating the proposed approach’s effectiveness.The forecasting results indicate that hard threshold denoising outperforms soft threshold denoising for energy price time series.Soft threshold processing often yields a smoother output but can lead to information distortion, such as blurred edge details.In contrast, the hard threshold denoising method is more effective at preserving edge characteristics of the signal.Since edge variations are significant in highly volatile time series, such as electricity prices, this preservation is essential for accurate forecasting.Therefore, this study utilizes the hard threshold method for denoising.Table 3 summarizes the prediction error analysis for different data denoising techniques.
3.3 Case 3: Assessing model robustness across various datasets
A forecasting model is considered robust if it demonstrates resilience against noise, uncertainty, and external interference, consistently maintaining stability and reliability despite fluctuations or shifts in data distribution.To rigorously assess the robustness and generalization capacity of the proposed method, cross-dataset testing is conducted using data from the day-ahead electricity market in Queensland, Australia, and the spot market in the Hexi district of Gansu Province.This cross-regional dataset evaluation allows for a comprehensive analysis of the model’s adaptability across diverse market conditions and fluctuating data patterns.Fig.12 and Fig.13 present these datasets,which are characterized by varying levels of price volatility and distinct market dynamics, providing a robust framework for validating the model’s performance and effectiveness.
Table 3 Error comparison of different models.
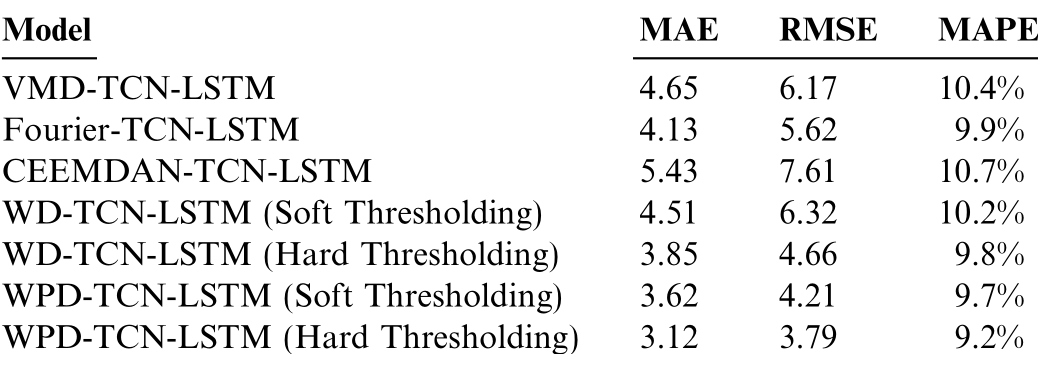
ModelMAERMSEMAPE VMD-TCN-LSTM4.656.1710.4%Fourier-TCN-LSTM4.135.629.9%CEEMDAN-TCN-LSTM5.437.6110.7%WD-TCN-LSTM (Soft Thresholding)4.516.3210.2%WD-TCN-LSTM (Hard Thresholding)3.854.669.8%WPD-TCN-LSTM (Soft Thresholding)3.624.219.7%WPD-TCN-LSTM (Hard Thresholding)3.123.799.2%
Fig.12 shows the extreme volatility of electricity prices in the Hexi district spot market in Gansu Province, with some stable periods.In contrast, Fig.13 reveals low volatility but frequent price spikes in Queensland’s dayahead market.These differences highlight distinct price fluctuation patterns in the two markets.The proposed model successfully forecasts both datasets without adjusting parameters like neuron count or iteration number.Final forecasting results are displayed in Fig.14 and Fig.15.
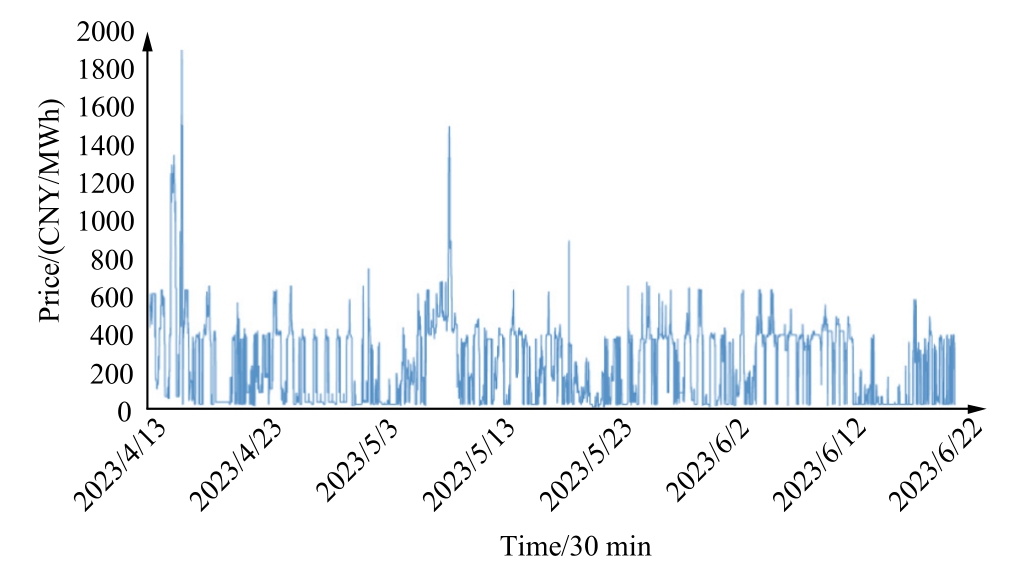
Fig.12.Electricity prices in the spot market of Hexi district, Gansu province.
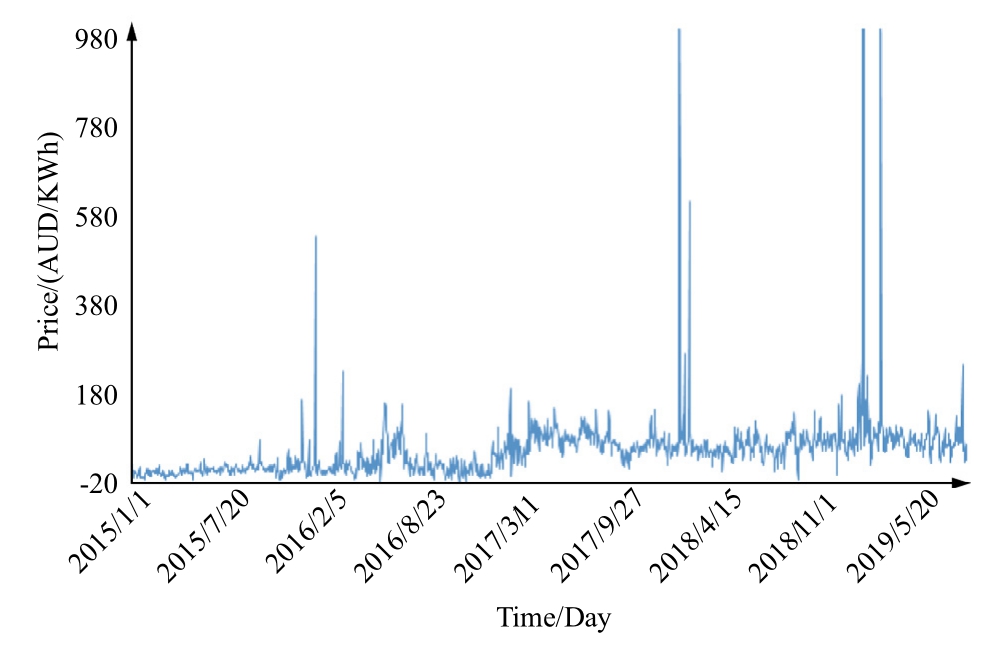
Fig.13.Electricity prices in the day-ahead market of Queensland,Australia.
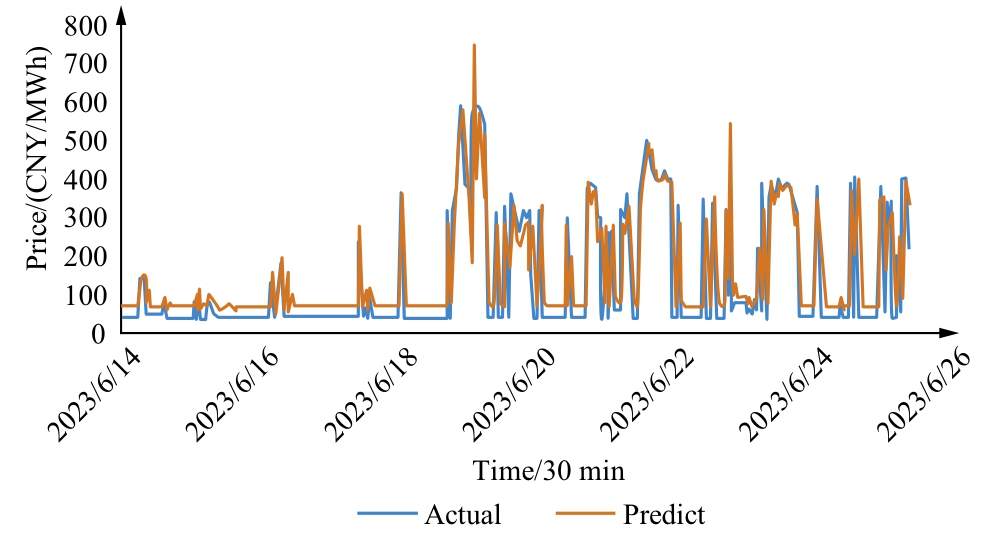
Fig.14.Forecasting results for the spot market in Gansu province.
As shown in Fig.14,the model’s accuracy is somewhat limited during volatile phases in the Hexi district’s electricity price sequence, mainly due to limited training on this dataset.However, the model captures turning points well,indicating strong fitting accuracy.In contrast, Fig.15 reveals that frequent price spikes in Australia’s dayahead market complicate feature extraction, causing output delays and reducing accuracy in adverse price predictions.Fig.16 and Fig.17 display the predictive performance of each model.
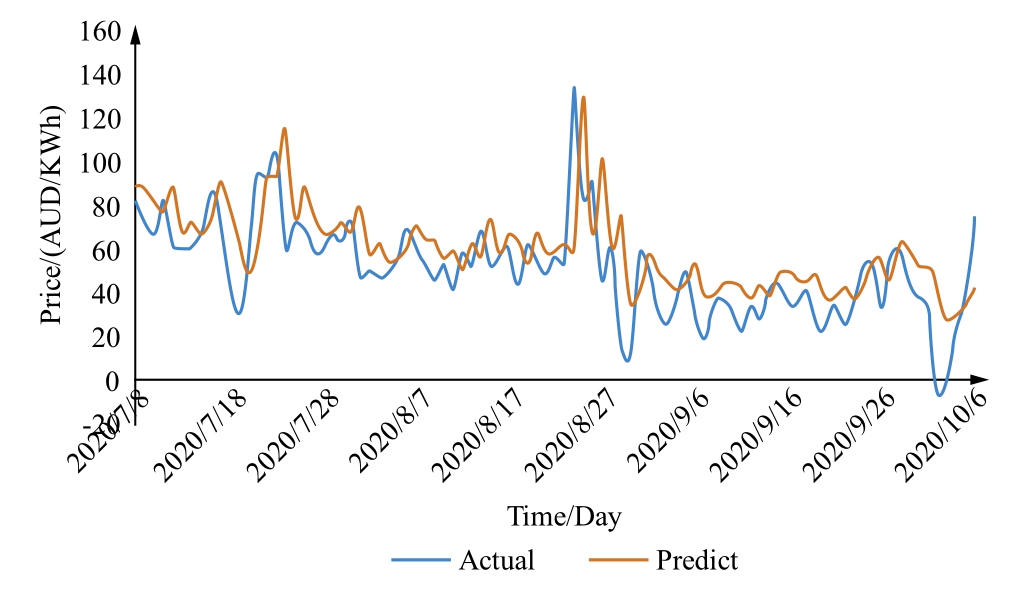
Fig.15.Day-ahead market forecasting results in Australia.
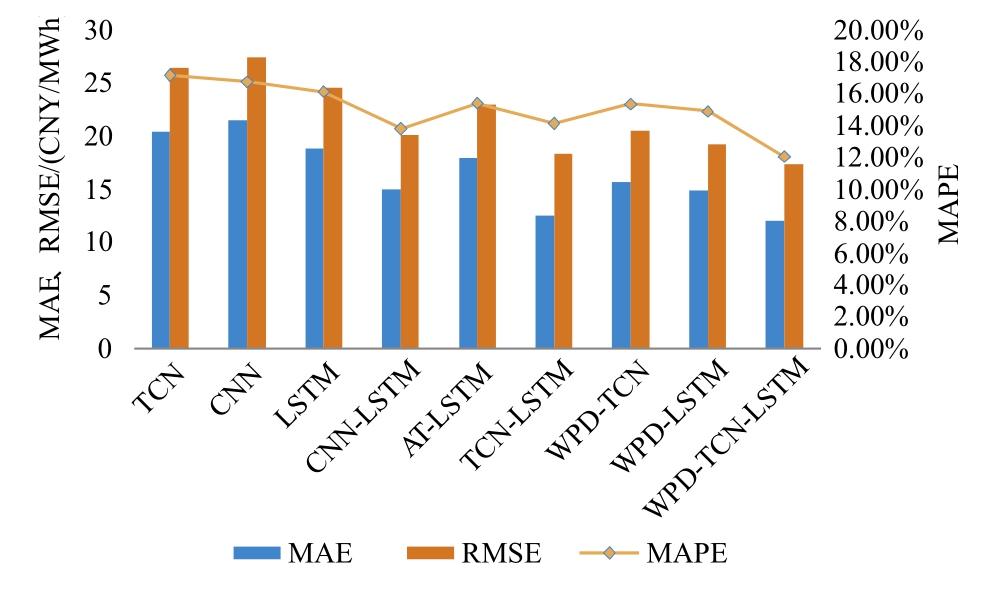
Fig.16.Forecasting errors for electricity prices in the spot market of Hexi district, Gansu province.
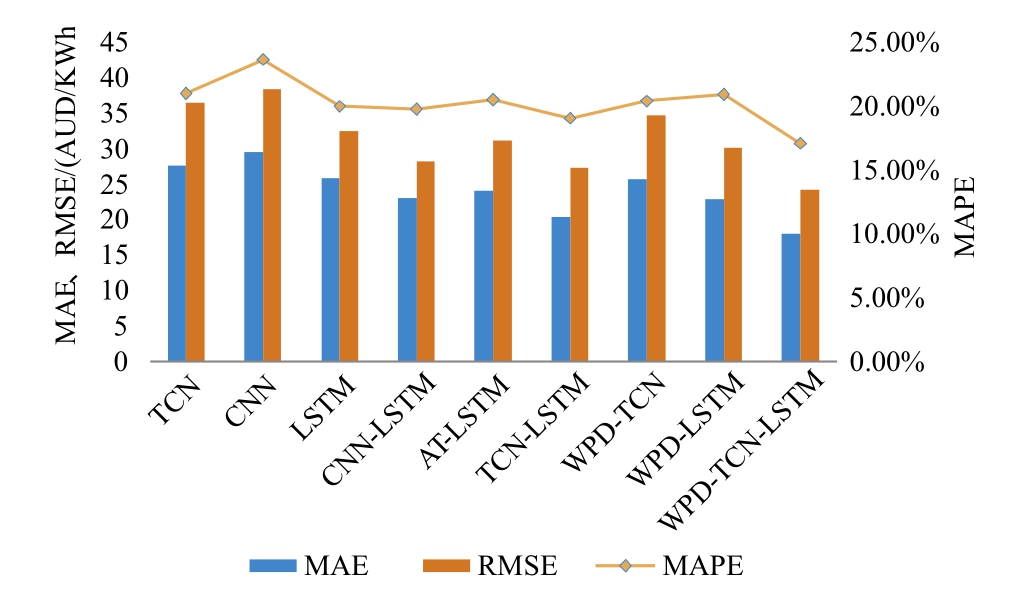
Fig.17.Forecasting errors for electricity prices in the day-ahead market of Queensland, Australia.
The proposed forecasting model accurately captures electricity price fluctuations and trends in both Australia’s day-ahead market and Gansu’s Hexi district spot market,as shown by error analysis.These results demonstrate the model’s strong generalization and enhanced robustness across different datasets.
4 Conclusion
This paper introduces a robust forecasting model for spot market electricity prices, leveraging the WPD algorithm combined with a hybrid deep neural network.WPD stabilizes time series data by decomposing it into manageable frequency components, reducing noise and capturing underlying data patterns.The hybrid model integrates a TCN for advanced feature extraction and LSTM for analyzing long-term dependencies within the data.This dual approach enables the model to accurately capture both short-term fluctuations and persistent trends in electricity price series.
In experimental evaluations, particularly in Case 1, the proposed model demonstrates substantial accuracy improvements, with reductions in MAE, RMSE, and MAPE of 27.3%, 66.9%, and 22.8%, respectively.The experimental results demonstrated the reliable accuracy of the TCN-LSTM model in electricity price forecasting research, indicating that the performance of the predictive model can be further improved by leveraging the advantages of different methods, providing insights for future electricity price forecasting studies.
In Case 2,the comparative results of different denoising algorithms indicated that the WPD can effectively retain high-frequency components of information when extracting features,aiding the predictive model in processing data quickly and accurately.The high prediction results also confirmed the necessity of data denoising in electricity price forecasting.Meanwhile, Case 3 demonstrated that the proposed hybrid model has good robustness and can adapt to different forecasting scenarios, further highlighting the superiority of the hybrid model.
To reduce electricity price prediction errors and enhance the decision-making capabilities of the model,future efforts can further integrate diverse data such as socioeconomic indicators and more environmental variables to capture more accurate periodic fluctuations and minimize errors.In addition,the predictive model can consider exploring hyperparameter optimization or improvements to the loss function to help the model train more efficiently, thereby better adapting to the requirements of the prediction scenario and reducing prediction errors.
CRediT authorship contribution statement
Heping Jia: Resources, Investigation, Conceptualization.Yuchen Guo: Writing - original draft, Methodology,Investigation.Xiaobin Zhang: Visualization, Validation,Resources.Qianxin Ma:Writing-review&editing.Zhenglin Yang:Project administration.Yaxian Zheng:Conceptualization.Dan Zeng: Visualization, Resources.Dunnan Liu: Resources.
Declaration of competing interest
The authors declare the following financial interests/personal relationships which may be considered as potential competing interests: Xiaobin Zhang is currently employed by State Grid Gansu Electric Power Company;Zhenglin Yang, Yaxian Zheng, Dan Zeng are currently employed by China Electric Power Research Institute.
Acknowledgments
This work was partially supported by projects funded by the National Key R&D Program of China(2022YFB2403000) and the State Grid Corporation of China Science and Technology Project (522722230034).
References
-
[1]
C¸.B.Bozlak,C.F.Yas¸ar,An optimized deep learning approach for forecasting day-ahead electricity prices,Electr.Pow.Syst.Res.229(2024) 110129. [百度学术]
-
[2]
B.Q.Lin,T.X.Lan,Progress of increasing-block electricity pricing policy implementation in China’s first-tier cities and the impact of resident policy perception, Energy Policy 177 (2023) 113544. [百度学术]
-
[3]
H.C.Hua, B.Gashi, M.Y.Zhang, Robust risk-sensitive control,Int.J.Robust Nonlinear Control 33 (10) (2023) 1-26. [百度学术]
-
[4]
J.Cardo-Miota, E.Pe´rez, H.Beltran, Deep learning-based forecasting of the automatic frequency reserve restoration band price in the Iberian electricity market,Sustain.Energy Grids Netw.35 (2023) 101110. [百度学术]
-
[5]
W.Shi, Y.F.Wang, Y.Y.Chen, et al., An effective two-stage electricity Price forecasting scheme, Electr.Pow.Syst.Res.199(2021) 107416. [百度学术]
-
[6]
F.Succetti, A.Rosato, M.Panella, An adaptive embedding procedure for time series forecasting with deep neural networks,Neural Netw.(2023) (Available online 9 September 2023). [百度学术]
-
[7]
H.Shayeghi, A.Ghasemi, Day-ahead electricity prices forecasting by a modified CGSA technique and hybrid WT in LSSVM based scheme, Energy Conver.Manag.74 (2013) 482-491. [百度学术]
-
[8]
Y.X.He, J.X.Zhang, Real-time electricity pricing mechanism in China based on system dynamics, Energy Convers Manag.94(2015) 394-405. [百度学术]
-
[9]
K.R.Mestav, X.Y.Wang, L.Tong, A deep learning approach to anomaly sequence detection for high-resolution monitoring of power systems, IEEE Trans.Power Syst.38 (2023) 4-13. [百度学术]
-
[10]
H.Li,M.G.Gong,C.C.Wang,et al.,Self-paced stacked denoising autoencoders based on differential evolution for change detection,Appl.Soft Comput.71 (2018) 698-714. [百度学术]
-
[11]
W.Y.Zhang, F.Teng, J.Y.Li, et al., Denoising method based on CNN-LSTM and CEEMD for LDV signals from accelerometer shock testing, Measurement 216 (2023) 112951. [百度学术]
-
[12]
X.Q.Huang,Q.Li,Y.H.Tai,et al.,Hybrid deep neural model for hourly solar irradiance forecasting, Renew.Energy 171 (2021)1041-1060. [百度学术]
-
[13]
J.L.Zhang, Z.F.Tan, Y.M.Wei, An adaptive hybrid model for short-term electricity price forecasting, Appl.Energy 258 (2019)114087. [百度学术]
-
[14]
H.C.Hua,Z.M.Qin,Y.C.Qin,Data-driven dynamical control for bottom-up energy internet system,IEEE Trans.Sustainable Energy 13 (1) (2022) 315-327. [百度学术]
-
[15]
L.Y.Liu, F.F.Bai, C.Y.Su, et al., Forecasting the occurrence of extreme electricity prices using a multivariate logistic regression model, Energy 247 (2022) 123417. [百度学术]
-
[16]
K.G.Olivares, C.Challu, G.Marcjasz, et al., Neural basis expansion analysis with exogenous variables:forecasting electricity prices with NBEATSx,Int.J.Forecast.39(2)(2023)884-900. [百度学术]
-
[17]
M.Heidarpanah, F.Hooshyaripor, M.Fazeli, Daily electricity price forecasting using artificial intelligence models in the Iranian electricity market, Energy 263 (Part E) (2023) 126011. [百度学术]
-
[18]
L.Tschora, E.Pierre, M.Plantevit, et al., Electricity price forecasting on the day-ahead market using machine learning,Appl.Energy 313 (2022) 118752. [百度学术]
-
[19]
Z.Shao, Q.R.Zheng, S.L.Yang, et al., Modeling and forecasting the electricity clearing price: a novel BELM based pattern classification framework and a comparative analytic study on multi-layer BELM and LSTM, Energy Econ.86 (2020) 104648. [百度学术]
-
[20]
G.Memarzadeh, F.Keynia, Short-term electricity load and price forecasting by a new optimal LSTM-NN based forecasting algorithm, Electr.Pow.Syst.Res.192 (2020) 106995. [百度学术]
-
[21]
M.Uzair, I.Shah, S.Ali, An adaptive strategy for wind speed forecasting under functional data horizon: a way Toward enhancing clean energy, IEEE Access 12 (2024) 68730-68746. [百度学术]
-
[22]
I.Shah, N.Gul, S.Ali, et al., Short-term hourly ozone concentration forecasting using functional data approach,Econometrics 12 (2) (2024) 12. [百度学术]
-
[23]
F.Lisi,I.Shah,Forecasting next-day electricity demand and prices based on functional models, Energy Syst.11 (4) (2020) 947-979. [百度学术]
-
[24]
F.Jan, I.Shah, S.Ali, Short-term electricity prices forecasting using functional time series analysis, Energies 15 (9) (2022) 3423. [百度学术]
-
[25]
M.Lehna, F.Scheller, H.Herwartz, Forecasting day-ahead electricity prices: a comparison of time series and neural network models taking external regressors into account, Energy Econ.106(2021) 105742. [百度学术]
-
[26]
M.Afrasiabi, J.Aghaei, S.Afrasiabi, et al., Probability density function forecasting of electricity price: deep gabor convolutional mixture network, Electr.Pow.Syst.Res.213 (2022) 108325. [百度学术]
-
[27]
A.B.Meng,P.Wang,G.S.Zhai,et al.,Electricity price forecasting with high penetration of renewable energy using attention-based LSTM network trained by crisscross optimization, Energy 254(Part A) (2022) 124212. [百度学术]
-
[28]
Y.J.Tang,Z.Y.Song,Y.L.Zhu,et al.,Adopting a dendritic neural model for forecasting stock price index movement, Expert Syst.Appl.205 (2022) 117637. [百度学术]
-
[29]
P.Jiang, Y.Nie, J.Z.Wang, et al., Multivariable short-term electricity price forecasting using artificial intelligence and multiinput multi-output scheme, Energy Econ.117 (2023) 106471. [百度学术]
-
[30]
W.Li, D.M.Becker, Day-ahead electricity price forecasting applying hybrid models of LSTM-based deep learning methods and feature selection algorithms under consideration of market coupling, Energy 237 (2021). [百度学术]
-
[31]
S.Gunduz, U.Ugurlu, I.Oksuz, Transfer learning for electricity price forecasting, Sustainable Energy Grids Netw.34 (2023)100996. [百度学术]
-
[32]
T.Jasin´ski, Use of new variables based on air temperature for forecasting day-ahead spot electricity prices using deep neural networks: a new approach, Energy 213 (2020) 118784. [百度学术]
-
[33]
K.Maciejowska, W.Nitka, T.Weron, Enhancing load, wind and solar generation for day-ahead forecasting of electricity prices,Energy Econ.99 (2021) 105273. [百度学术]
-
[34]
J.M.Uribe, S.Mosquera-Lo´pez, O.J.Arenas, Assessing the relationship between electricity and natural gas prices in European markets in times of distress, Energy Policy 166 (2022)113018. [百度学术]
-
[35]
Z.G.Su,G.Q.Zheng,M.S.Hu,et al.,Short-term load forecasting of regional integrated energy system based on spatio-temporal convolutional graph neural network, Electr.Pow.Syst.Res.232(2024) 110427. [百度学术]
-
[36]
X.F.Guo, Q.N.Zhao, D.Zheng, et al., A short-term load forecasting model of multi-scale CNN-LSTM hybrid neural network considering the real-time electricity price, Energy Rep.6(Supplement 9) (2020) 1046-1053. [百度学术]
-
[37]
A.Kanwal, M.F.Lau, P.H.Sebastian, et al., BiCuDNNLSTM-1dCNN—a hybrid deep learning-based predictive model for stock price prediction, Expert Syst.Appl.202 (2022) 117123. [百度学术]
-
[38]
Y.Zhang, C.Li, L.Li, Electricity price forecasting by a hybrid model, combining wavelet transform, ARMA and kernel-based extreme learning machine methods, Appl.Energy 190 (2017) 291-305. [百度学术]
-
[39]
R.Rick, L.Berton, Energy forecasting model based on CNNLSTM-AE for many time series with unequal lengths, Eng.Appl.Artif.Intel.113 (2022) 104998. [百度学术]
-
[40]
T.Limouni, R.Yaagoubi, K.Bouziane, et al., Accurate one step and multistep forecasting of very short-term PV power using LSTM-TCN model, Renew.Energy 205 (2023) 1010-1024. [百度学术]
-
[41]
S.Khan,Y.Muhammad,I.Jadoon,et al.,Leveraging LSTM-SMI and ARIMA architecture for robust wind power plant forecasting,Appl.Soft Comput.170 (2025) 112765. [百度学术]
-
[42]
N.Zhou, B.W.Shang, M.M.Xu, et al., Enhancing photovoltaic power prediction using a CNN-LSTM-attention hybrid model with Bayesianhyperparameteroptimization,GlobalEnergy Interconnect.7 (5) (2024) 667-681. [百度学术]
Fund Information

