Recommended articles:
-

-
Global Energy Interconnection
Volume 8, Issue 5, Oct 2025, Pages 847-857
A multi-model management approach for power system transient stability assessment based on multi-moment feature clustering
Abstract
Abstract Transient stability assessment (TSA) based on artificial intelligence typically has two distinct model management approaches: a unified management approach for all faulted lines and a separate management approach for each faulted line.To address the shortcomings of the aforementioned approaches, namely accuracy, training time, and model management complexity, a multi-model management approach for power system TSA based on multi-moment feature clustering has been proposed.First, the steady-state and transient features present under fault conditions were obtained through a transient simulation of line faults.The input sample set was then constructed using the aforementioned multi-moment electrical features and the embedded faulty line numbers.Subsequently, K-means clustering was conducted on each line based on the similarity of their electrical features, employing t-SNE dimensionality reduction.The PSO-CNN model was trained separately for each cluster to generate several independent TSA models.Finally, a model effectiveness evaluation system consisting of five metrics was established,and the effect of the sample imbalance ratio on the model effectiveness was investigated.The model effectiveness was evaluated using the IEEE 39-bus system algorithm.The results showed that the multi-model management strategy based on multi-moment feature clustering can effectively combine the two advantages of superior evaluation performance and streamlined model management by fully extracting system features.Moreover, this approach allows for more flexible adjustments to line topology changes.
0 Introduction
Transient stability assessment (TSA) represents the primary methodology for ensuring the secure and stable operation of modern power systems.The ongoing integration of novel energy sources and power electronic devices into the power grid has led to an increase in uncertainty and voltage fluctuations.It is therefore imperative to develop rapid and precise models for asses sing the transient stability of power systems [1-3].The three most commonly utilized TSA methodologies are the time-domain simulati on approach [4], the direct approach [5-7], and the artificial intelligence (AI) approach [8-10].In recent years, there has been a notable increase in the demand for online transient stability analysis, which has in turn given rise to the necessity of higher real-time performance standards.In comparison to traditional time-domain simulation and direct approaches, the AI approach is more suitable for TSA online applications due to its rapid training speed and superior evaluation performance.
Among the AI approaches, deep learning technology has been developing rapidly in recent years, exhibiting enhan ced capabilities in data mining and autonomous learning [11].The integration of deep learning networks with the intricate dynamic features of power systems represents a promising avenue for advancing research in the field of TSA [12].Most extant studies have constructed a unified deep learning model for the training and evaluation of faults across the system.Literature [13] proposed a method for constructing a graph convolutional network model based on a multilayer perceptron.This method allowed for the extraction of features from both static and time-series multivariate data, as well as topological map domain data.The extra cted features were then fused using tensor fusion, enabling the simultaneous achievement of transient stability assessment and transient stability margin prediction.Similarly, Literature [14]automatically extracted spatial and temporal features from transient data based on a time-convolution network and graph-attention network, using only measur ed bus voltage magnitude and phase angle data as inputs.Literature [15]took AC and DC systems as the research object, based on two-stage partition modeling to reduce the dimensionality and redundancy of input features.Then clustering and partitioning were performed accordi ng to the similarity of bus voltage data to realize the information fusion of steady state features and fault data.Literature [16] input the generator rotor timing trajectory into the basic model of convolutional neural network (CNN), and through the method of parameter fine-tuning and active learning, the model can complete the TSA in a shorter time and with fewer samples.
The aforementioned method trained one large unified model for all faulty lines in the system, thereby facilitating straightforward model management.However, due to the differences in the electrical characteristics of the various lines, training all lines into a single TSA model will inevitably have an impact on the evaluation of the model to some extent.If the model is trained separately for each faulty line of the system, the model evaluation performance for a single line is superior.In this instance, however, the total number of models is equal to the number of lines in the system.If the system is of a considerable size, the number of models that must be constructed will be considerable in turn.Not only is the model training time too long, but it is also difficult to manage a large number of models in a unified way.
Combining the advantages and disadvantages of the above two model management approaches, this study proposed a multi-model management approach for power system TSA based on multi-moment feature clustering.The proposed approach took into account the dimensions of accuracy, model training speed, and model management difficulty.The method constructed multiple independent TSA models by clustering lines with similar characteristics based on the electrical characteristics of each line at different sampling moments.During the online assessment, only the lines with similar electrical features were entered into the same model.This not only resolved the issue of poor results when all lines were trained together but also reduced the number of models to be trained and facilitated model management.
First, the steady-state and transient features present under fault conditions were obtained through a transient simulation of line faults.The input sample set was then constructed using the aforementioned multi-moment electrical features and the embedded faulty line numbers.Subsequently, K-means clustering was conducted on each line based on the similarity of their electrical features, employing t-SNE dimensionality reduction.Since CNN is currently the most widely used neural network for TSA,and PSO is a more effective optimization algorithm that is well suited for optimizing CNN parameters, the PSOCNN model is trained separately for each clustering to generate multiple independent TSA models.Finally, a model effectiveness evaluation system consisting of five metrics was established,and the effect of the sample imbalance ratio on the model effectiveness was investigated.The model effectiveness was evaluated using the IEEE 39-bus system algorithm.The flowchart for clustering model management is shown in Fig.1.
The results demonstrate that, compared with the unified management of all lines and the separate modeling of each line, the multi-model clustering management approach based on multi-moment feature clustering can combine the two advantages of good evaluation performance and convenient model management.Furthermore, this approach is more conducive to the flexible adjustment of line topology changes.
Combining the clustering idea with the AI method in TSA, this study provides new ideas for the construction and management of TSA models [17].
1 Feature dimensionality reduction and line clustering
Before clustering, this study employed the t-SNE dimensionality reduction technique to address the challenge of high-dimensional electrical features.This method circumvented the potential issues associated with the‘‘curse of dimensionality,” such as the computational burden of calculating Euclidean distances in high-dimensional spaces.Furthermore, this study presented a visual representation of the clustering outcomes.
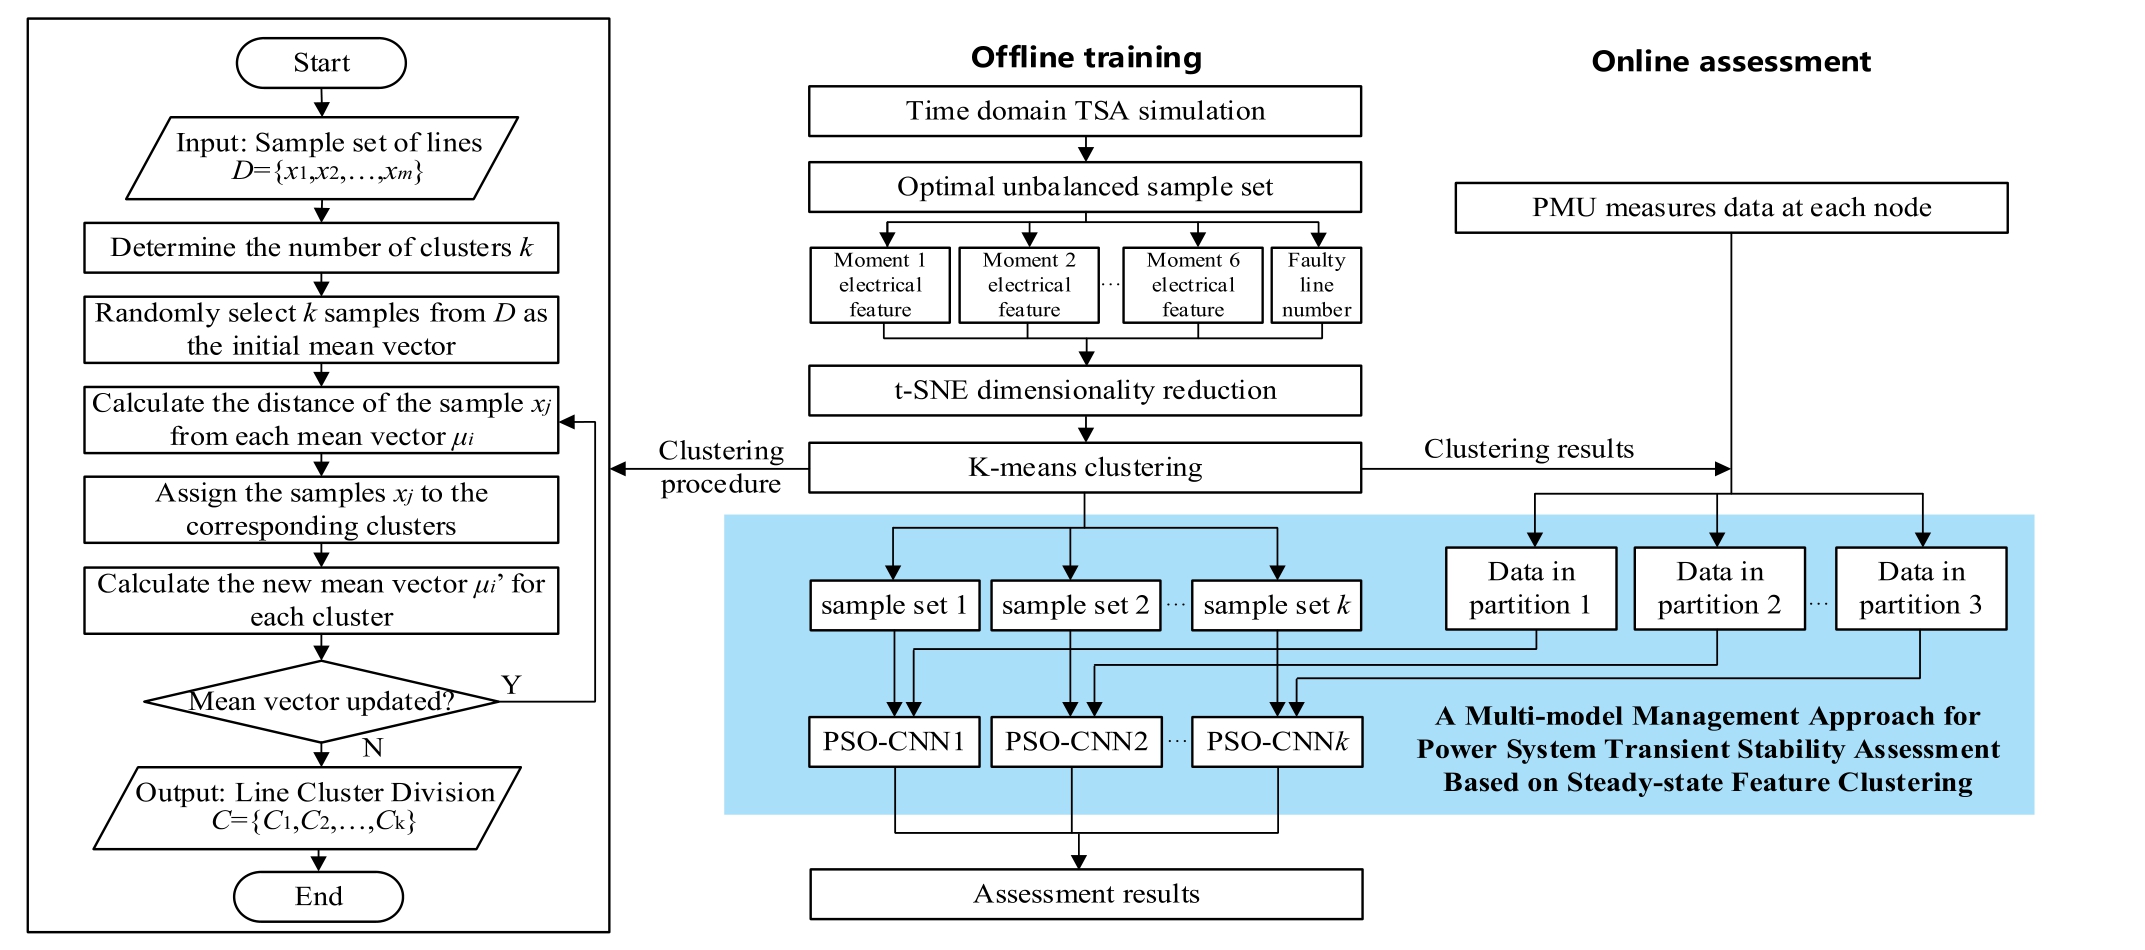
Fig.1.A model management approach for TSA based on steady state feature clustering.
To establish k models, each according to the similarity of electrical features, this study initially determined the optimal number of clusters, k, based on the feature dimensionality reduction using time-domain simulation data.Subsequently, the clustering algorithm was then employed to cluster the lines into k groups.This study employed the classical K-means algorithm as a case study to examine the efficacy of the clustering management approach.
1.1 Dimensionality reduction of high-dimensional electrical features
The t-distributed Stochastic Neighbor Embedding (t-SNE) algorithm is a nonlinear dimensionality reduction algorithm whose primary concept is to transform Euclidean distances between high-dimensional data points into conditional probabilities that define similarity.The t-SNE algorithm employs a specific probability distribution, the tdistribution, to efficiently process high-dimensional data represented as Euclidean distances.It effectively handles outliers in high-dimensional data and produces superior clustering in low-dimensional space [18].
Let us consider a set of high-dimensional data points,represented by the vector X =(x1, x2,, xn), and a set of low-dimensional data points, represented by the vector Y =(y1, y2, , yn).The conditional probability of selecting Xj as its nearest neighbor centered on the electrical data point Xi in the high-dimensional space with a Gaussian distribution can be expressed as pj|i.The conditional probability of selecting Yj as its nearest neighbor centered on the electrical data point Y i in the low-dimensional space with a t-distribution can be expressed as qj|i.Once pj|i and qj|i have been calculated,the KL dispersion is employed to construct a cost function, which is used to measure the similarity of the data distribution between the highdimensional and low-dimensional spaces.
The failure of Euclidean distance calculation in Kmeans can be circumvented by reducing the highdimensional electrical features to two dimensions and then applying K-means clustering.This failure is a consequence of the sparsity of data points in the high-dimensional space,which is also known as the‘curse of dimensionality’.Furthermore, this approach facilitates the visualization of the K-means clustering results.
1.2 Two-dimensional electrical feature clustering
The K-means algorithm is, in essence, a data partitioning algorithm based on the Euclidean distance.In this study, the K-means algorithm was employed as a case study to demonstrate the clustering of electrical features reduced to two dimensions [19,20].The flow of the algorithm is illustrated in Fig.1.
The number of clusters, k, has a significant impact on the efficacy of the algorithm.The determination of optimal k value is typically determined by plotting the sum of squares of the errors (SSE) curve within the clusters.The SSE formula is presented in (1).
2 PSO-CNN TSA model
Following the application of t-SNE dimensionality reduction and K-means clustering methods to cluster the lines into k classes, k TSA models must be trained for k sets of line data.In this study, the PSO-CNN model was employed for TSA after dimension reduction and clustering.
The PSO-CNN is a deep feed-forward neural network based on particle swarm optimization(PSO)[21], in which a substantial number of convolutional operations render it more powerful than traditional neural networks for feature extraction [22].In addition, the use of the PSO algorithm to optimize the hyperparameters has been shown to improve the training process for the CNN model.It should be noted that the selection of the PSO-CNN for the model construction in this paper is merely a superior example,and this does not imply that the clustering management approach must be applied on top of the PSO-CNN model.
2.1 Model construction
This study presented a TSA model constructed based on a two-layer CNN, comprising the following layers:Input feature, Convolutional layer 1, Pooling layer 1, Convolutional layer 2, Pooling layer 2, Flatten layer, Fullyconnected layer, and Output results.The Adam optimizer and exponential descent strategy are employed for supervised learning.
2.2 PSO parameter optimization
The optimization of hyperparameters in neural networks is crucial for their training effectiveness.Of these,the learning rate and convolution kernel size are two key parameters.The learning rate determines the step size of the training process.An excessive learning rate will lead to training divergence,whereas an insufficient learning rate will result in a slow convergence.The size of the convolutional kernel has a direct impact on the quality of feature extraction.
The transient stability assessment CNN model established in this paper has high-dimensional hyperparameters,and its hyperparameter optimization problem is a more complex high-dimensional optimization problem.The PSO algorithm has higher search efficiency in the highdimensional and complex hyperparameter space compared with traditional optimization methods.In addition, the PSO algorithm can better avoid local optimal solutions,is highly adaptive, and is more economical in terms of computational resource consumption.The main steps involved in utilizing the PSO algorithm to identify the optimal learning rate and convolutional kernel size are as follows:
1) A total of n data points were randomly selected for PSO from the original sample set, which contained fault data for each line.The value of n depends on the number of lines of the selected system.
2) The learning rate (lr) and the size of the convolution kernels for the two convolution layers (s1, s2) are used to construct the position vector of the particle.For the ith particle, the position vector is represented as xi =[lr, s1, s2], with upper and lower limits provided for each element of xi.
3) The training loss of the training set after each training epo ch is employed as the fitness function.
4) The objective is to determine the optimal value of xi =[lr, s1, s2] using the PSO algorithm, given the PSO parameters.
2.3 Construction of input feature set
To meet the requirements of the smart grid for online assessment, this study established a TSA model based on multi-moment sampling.Compared with the input feature construction method that only samples once, this method is c apable of collecting both pre-fault steady-state features and post-fault transient features,thereby enabling the capture of more system information to construct a more accurate TSA model.
Consequently, this study concentrated on the selection of multi-moment electrical features and fault location features with a view to prospective warning of transient voltage stability.To this en d, this study constructed an input feature set consisting of multi-moment features and 10-dimensional fault location features.
2.3.1 Electrical feature under multi-moment
The electrical features of a power system may be indicative of the system’s operational conditions.As the states of the generators, buses, and lines are the determinants of transient stability, this study has selected six features to characterize the system.These are the generator active output (gen_ac), the generator reactive output (gen_re), the bus voltage amplitude (bus_v_abs), the bus voltage angle(bus_v_θ), the line active power (line_ac), and the line reactive power (line_re).
The selection of electrical features at a single moment in time may result in a degree of uncertainty in the model prediction results.Furthermore, the question of whether to utilize pre-fault anticipated features or post-fault known features for training represents another key consideration.The objective of feature sampling in this study is to obtain more information about critical response features and to improve the evaluation performance of the model.Accordingly, this study sampled the electrical features data at six discrete moments (0.00 s, 0.05 s, 0.10 s, 0.15 s, 0.20 s,0.25 s) a t intervals of 0.05 s, commencing from 0.10 s before the occurrence of the fault.The schematic is presented in Fig.2.By incorporating the electrical features under multiple moments into the model, the model is capable of more precisely capturing the changes in the electrical features of the system during the fault and more accurately assessing the transient stability of the system.
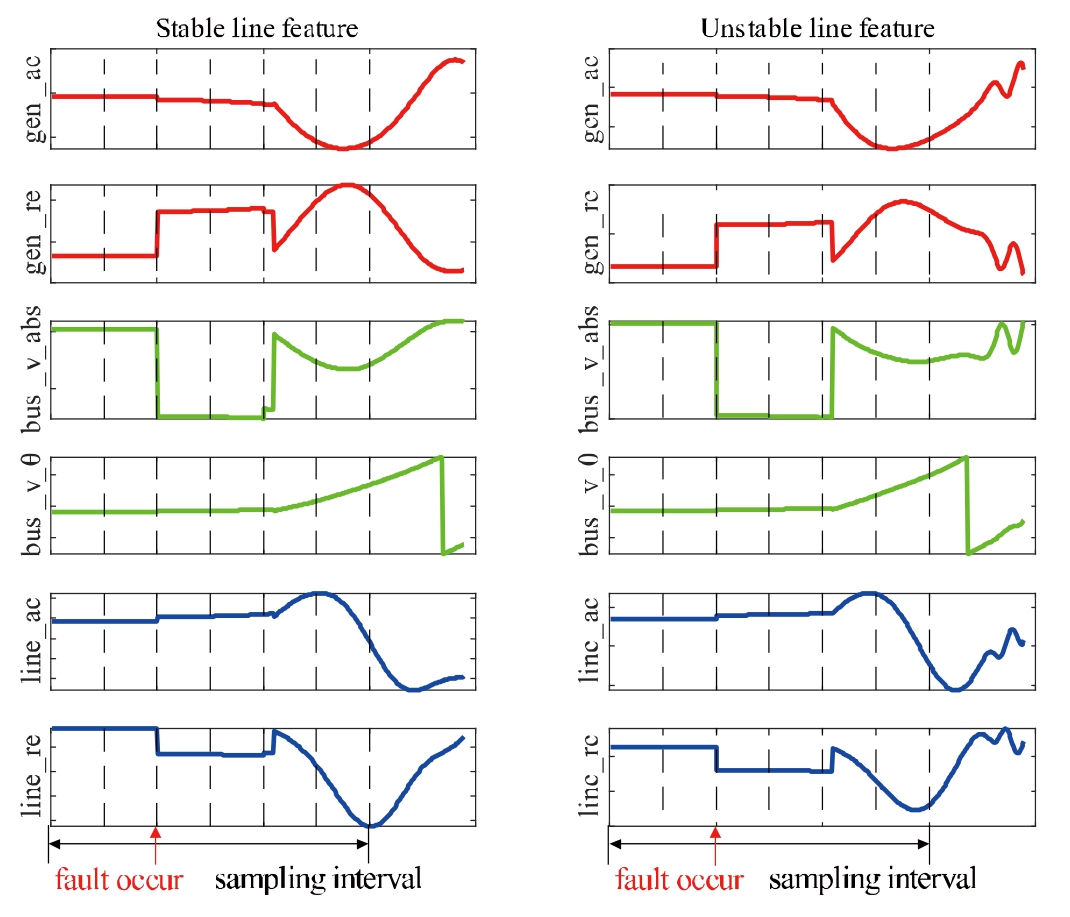
Fig.2.Sampling of electrical features at multi-moments.
2.3.2 Embedding encoded fault location feature
In this study, it is postulated that faults may occur on each non-generator line.The degree of threat to transient stability posed by faults on different lines is not homogeneous.Consequently, incorporating the locations of faults into the model represents an effective method for enhancing its performance in assessing transient stability.
The data about the location of faults belong to the discrete category.The numerical magnitude of these data points serves only to indicate the category to which they belong.If the fault location features are directly input into the model, it will result in the classifier incorrectly assuming that the data values are ordered in size.One-hot encoding, also referred to as one-bit effective encoding, employs N-bit state registers to encode N states.Each state is associated with a distinct independent register bit, and only one bit is valid at any given time.The application of One-hot encoding to discrete data can address the issue of classifiers erroneously interpreting categorical data as continuous numerical data [23].
However, the One-hot encoding data is a sparse matrix with a large number of 0 elements, which will result in a reduction in the effectiveness of model evaluation if it is directly input to the classifier.The embedding process based on One-hot encoding converts highdimensional discrete-space data into low-dimensional continuous-space data, thereby greatly improving the learning effect of the classifier for line numbering.In this study, the faulty line number was firstly encoded with One-hot encoding, and then embedding was processed into 10-dimensional continuous data, which was input into the model as the fault location feature part of the input feature set.
2.4 Model evaluation metrics
In this study, five metrics were selected to constitute the evaluation index system of the model, namely: Accuracy(ACC), F1-Score, False Positive Rate (FPR), discrimination time(t1),and training time(t2).The confusion matrix is shown in Table 1.
ACC is the most direct metric to measure the effectiveness of TSA.The expression for the ACC is shown in (2).
Nevertheless, in the event of sample imbalance, the ACC of a model does not provide a comprehensive assessment of its predictive capacity.In such cases, the F1-Score is typically employed as a measure of the efficacy of the model.The F1-Score can be regarded as a weighted average of the model’s precision and recall,as demonstrated in(3)-(5).The precision rate is used to indicate the number of actual positive samples among those predicted to be positive, while the recall rate indicates the proportion of actual positive samples that are judged to be positive.

Since the cost of omitting an unstable sample as a stable sample is usually much greater than the cost of misclassifying a stable sample as unstable, this study paid particular atten tion to the ratio of negative samples that are omitted as positive.This is represented by the False Positive Rate(FPR), as illustrated in (6).
Moreover, the model discrimination time (t1) and training time (t2) are two crucia l metrics for assessing the model’s processing speed.
3 Case study
3.1 Introduction of the algorithm system
This study employed the New England 10-machine 39-bus system as a case study.The system comprises 10 gen-erators, 39 buses, and 46 lines, of which 34 are nongenerator lines, 5 are contact switch lines, and a single power source is employed as a balancing bus.
Table 1 Confusion matrix.

Real valuePredicted value Stable (1)Unstable (0)Stable (1)TPFN Unstable (0)FPTN
3.2 Impact of the unbalanced ratio of samples
In this study, the PST toolbox of MATLAB was used for power flow calculation and transient assessment to batch generate the input sample set with a transient stability label.
In the presence of general faults, the number of stable samples generated by the time domain simulation is significantly greater than the number of unstable samples.The imbalance in data types will affect the effectiveness of model training.In this study, the effect of sample distribution imbalance on model effectiveness was invest igated by artificially controlling the ratio of unbalanced samples,and the optimal ratio of unbalanced samples was thus selected.The model was trained with different ratios of unbalanced sample sets and the results are presented in Table 2.
As shown in Table 2, an increase in the ratio of unbalanced samples results in a decrease in ACC and F1 scores and an increase in FPR.To put it another way, an increase in the proportion of unbalanced samples will result in a less effective model.However, this will simultaneously reduce the cost of time required to generate a given number of samples.Consi dering the aforementioned factors,this study employed an unbalanced sample ratio of 2:1 for training.The model in this case demonstrates an ACC of 99.41%, an F1-Score of 98.24%, and an FPR of 1.25%,while the sample generation time is not particularly long.
Following the generation of the unbalanced sample set,Z-score normalization is conducted to create the input sample set, which is then used for subsequent clustering and model training.
3.3 PSO parameter optimization and model structure determination
To ascertain the optimal training parameters and model structure, the PSO algorithm, as described in Section 2.2,was employed in this study to determine the optimal learning rate lrbest of 0.0068, and the optimal convolutional kernel size s1 best = s2 best = 2.The structural parameters of the network constructed from this are presented in Table 3.
To verify the efficacy of the PSO algorithm on the hyperparameters of CNN, a comparison was conducted between the CNN with randomly initialized parameters and the GS-CNN, with the PSO-CNN model constructed in this study.The results of this comparison are presented in Table 4.
As shown in Table 2, the PSO-CNN model has a significant advantage over the unoptimized CNN in terms of ACC, F1-Score, and FPR metrics.In addition, it also shows a large advantage over GS-CNN.The Relative Improvement Rate (RIR) of PSO-CNN for ACC, F1-Score, and FPR metrics are 61.44%, 37.90%, and 46.58%, respectively, which has a more significant RIR compared to GS-CNN.The formula of RIR is shown in(7).
3.4 Model effect study
In this study, the degree of feature similarity was assessed using the Euclidean distance based on t-SNE dimensionality reductio n.The K-means clustering algorithm was employed as a case algorithm for clustering each line.
3.4.1 K-value selection
The K-means algorithm necessitates the prior specification of the number of clusters, k.The selection of the k value is of crucial importance with regard to the training effect of the model.To ascertain the optimal k value, the elbow rule is employed,with the SSE curve plotted as illustrated in Fig.3.
In Fig.3, k = 3 represents the critical point of the image.At this juncture, further increases in k result in minimal alterations to the error within the cluster.Consequently, k = 3 is selected as the number of clusters.
3.4.2 t-SNE dimensionality reduction and K-means clustering results
The t-SNE dimensionality reduction algorithm was used to reduce the multidimensional input features containing generator output, bus voltage, and line power atmultiple moments to two dimensions.Subsequently, the K-means algorithm with k = 3 was utilized to clust er the 34 non-generator lines.The resulting scatter plot is illustrated in Fig.4.
Table 2 Comparison of model training effects with various imbalance ratios.

Ratio of unbalanced samples (stable:unstable)ACC/%F1/%FPR/%Sample generation time/min 1:199.5298.920.9324,289 2:199.4198.241.2516,342 3:198.3797.432.1413,021 4:198.6595.693.2710,236 5:197.8294.014.2910,137
Table 3 PSO-CNN model structure and parameter settings.

LayerConvolution kernel size/step sizeOutput data sizeNumber of filters Convolutional layer 12/11 16 28816 Pooling layer 12/21 16 14416 Convolutional layer 22/11 32 14432 Pooling layer 22/21 32 7232 Flatten layer/1 2,304/Fully-connected layer23041 2/
Table 4 Comparison of different hyperparam eter optimization approaches.

Model typeACC/%RUR/%F1/%RUR/%FPR/%RUR/%PSO-CNN99.4161.4498.6437.901.2546.58 GS-CNN99.2349.6798.2419.631.3641.88 CNN98.47/97.81/2.34/
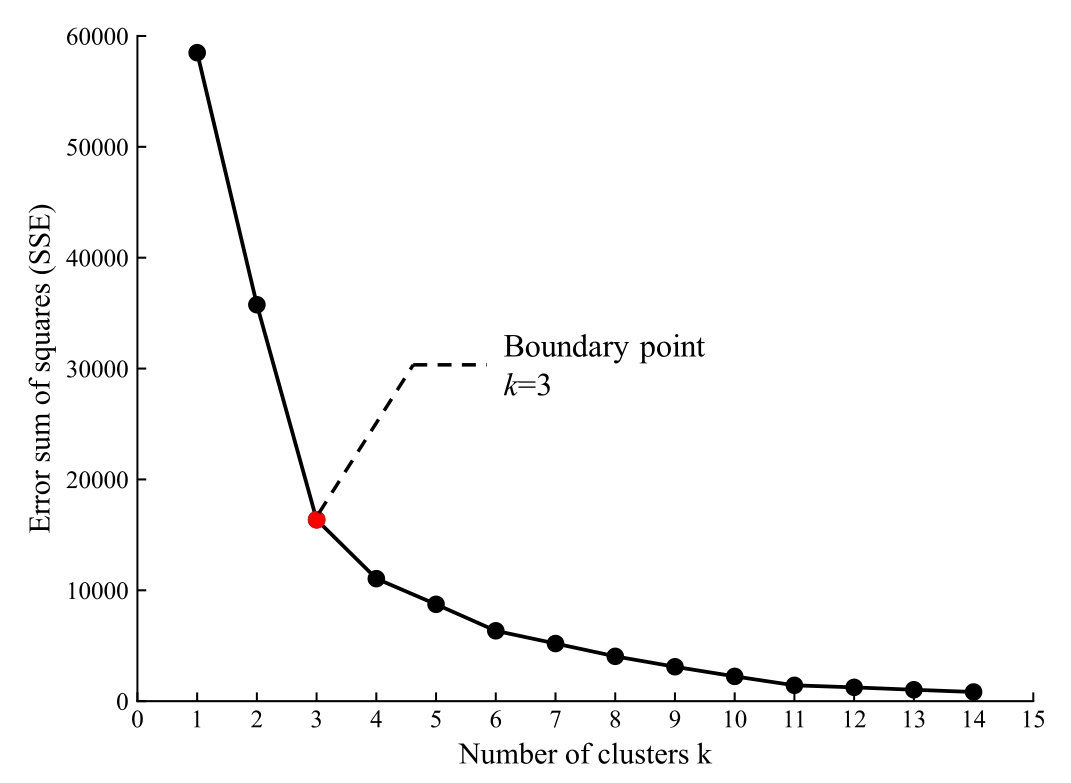
Fig.3.SSE curve diagram.
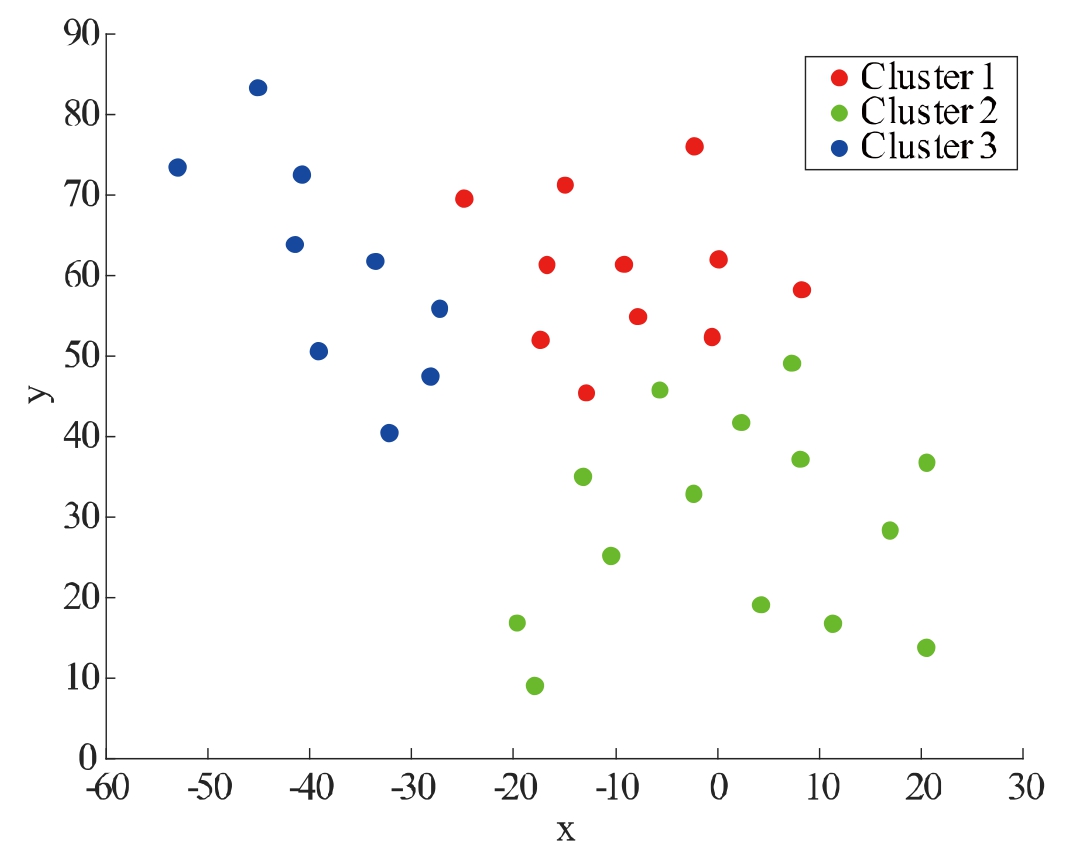
Fig.4.Scatterplot of line clustering after feature dimensionality reduction.
The 34 lines were divided into three classes, and the resulting clustering is presented in Table 5.The three clusters contained 11, 14, and 9 lines, respectively.
3.4.3 TSA model effect
Based on the line clustering results presented in Table 5,the PSO-CNN model was trained for each of the three clusters.The resul ting performance metrics for the three models are presented in Table 6.
As demonstrated by the data presented in the table, the training accuracy of all three models exceeded 99%, the F1-Score was above 98%, the FPR was below 1.5%, the discrimination time (t 1) was approximately 0.009 s, and the training time (t2) was 145 to 165 s, which indicated a favorable performance.
3.5 Comparison study
3.5.1 Comparison of effect with other model management approaches
The effects of the clustering management approach were compared with the effects of the two approaches of separate management and unified management.The average values of the metrics of each model trained are presented in Table 7.The total length of data utilized for both training and testing purposes was 8,000.
Table 5 Line clustering results.

Cluster No.Included Line Numbers Cluster 11, 2, 3, 4, 15, 17, 20, 21, 22, 30, 34 Cluster 25, 6, 9, 10, 11, 23, 24, 25, 27, 28, 29, 31, 32, 33 Cluster 37, 8, 12, 13, 14, 16, 18, 19, 26
Table 6 PSO-CNN model performance metrics.

Model No.ACC/%F1/%FPR/%t1/st2/s 1 99.2898.711.150.0095145.261 2 99.3798.491.320.0090162.647 3 99.6498.781.260.0090148.139
Table 7 Comparison of performance metrics of three model management approaches.

Model management approachACC/%F1/%FPR/%t1/st2/s Clustering management99.4198.641.250.0092456.047 Separate management99.6598.931.140.00864,623.85 Unified management97.2695.133.040.00954,038.93
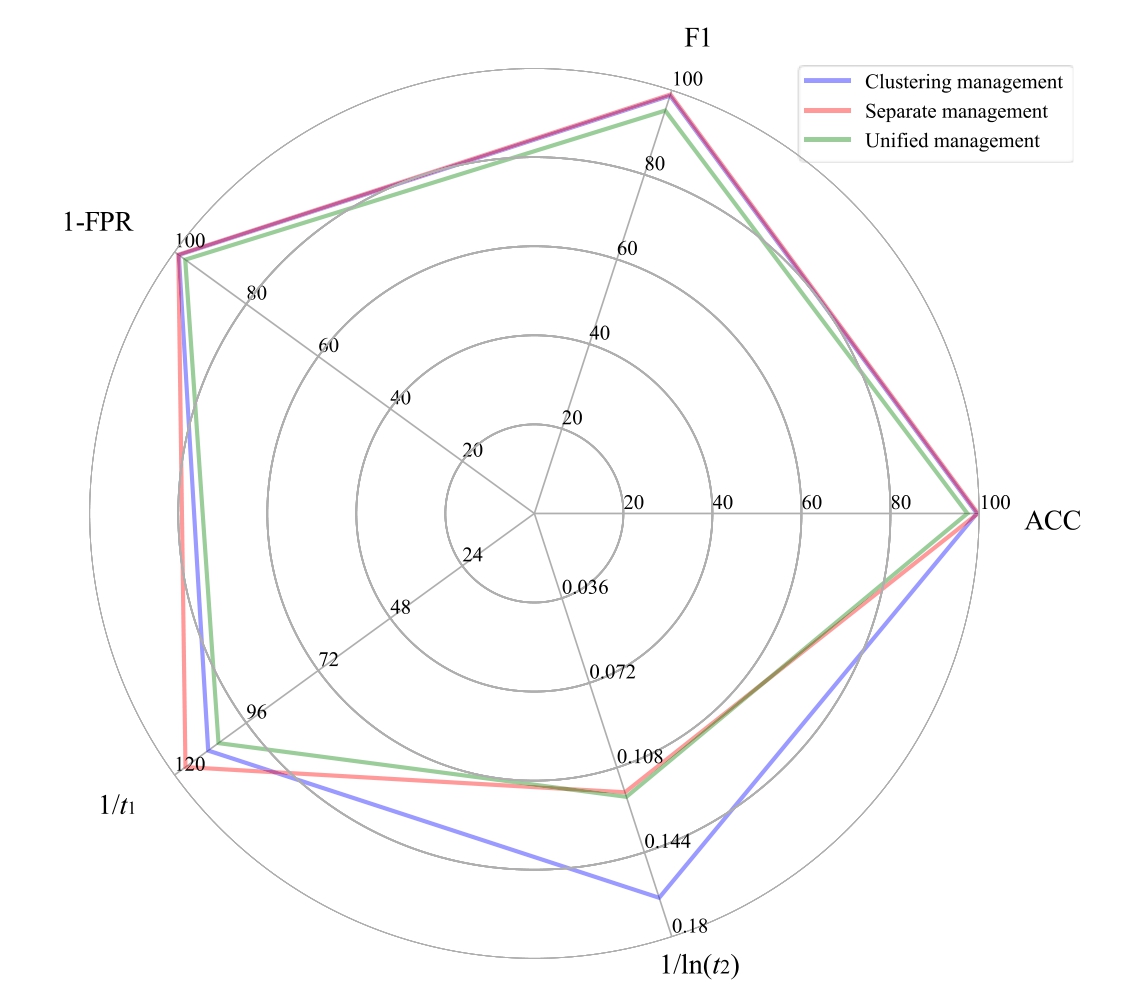
Fig.5.Comparison of performance metrics of three modeling management approaches.
Radar charts have been constructed to facilitate a visual comparison of the performance metrics a ssociated with the three model management approaches, as illustrated in Fig.5.When comparing the two approaches of separate management and unified management, one of the major advantages of clustering management is its rapid model training speed, which is particularly advantageous in TSA problems that require a swift response.Add itionally,clustering management effectively combines the two advantages of excellent evaluation performance associated with separate management and convenient model management associated with unified management.
3.5.2 Comparison of effectiveness with other AI algorithms
The following section introduces three representative algorithms from distinct categories of machine learning:Support Vector Machines (SVM) [24,25] and Deci sion Tree (DT) [26-28] as shallow learning algorithms, and Artificial Neural Network (ANN) [29,30] as a deep learning algorithm.This study presented a comparative analysis of the effects of these algorithms in comparison to the effects of a CNN.The comparison results are presented in Table 8.
As evidenced by the results presented in Table 8, the CNN algorithm demonstrates superior performance compared to the other three AI algorithms in the three evaluation metrics of ACC, F1-Score, and FPR.This makes it a more suitable choice for TSA applications that require high discrimination accuracy.
3.6 Model generalization performance study
To evaluate the generalization performance of the proposed model management approach, it can be used to change the system generator output or load size, increase or decrease the line, and employ other methods.For the change of generator power or load size, new data can be directly input into the original model to obtain the TSA results.It can be seen that the model established in this paper itself has certain generalization performance.To illustrate the unique advantages of the clustering management approach proposed in this paper, a new fault line is introduced to evaluate the modeling effect when the topology is changed.
Since modifying the topology of the power system arbitrarily can result in changes to the network-wide current distribution, which may potentially lead to destabilization of the system.To guarantee the safe and stable operation of the system in the absence of faults, this study chose toconnect bus 3 and bus 14, which have the same voltage level of 345 kV, as the new line.This is illustrated in Fig.6.A time-domain simulation was conducted to verify the system’s ability to operate stably under this scheme.Upon the occurrence of a fault on the new line, the distance between the sample features at the time of the fault and the average vector of the three line clusters can be calculated to determine that the new line should be categorized into Cluster 2.In this case, it is necessary to retrain the model corresponding to Cluster 2 to obtain the TSA effect under the cluster management method.
Table 8 Comparison of performance metrics of multiple AI algorithms.

AlgorithmACC/%F1/%FPR/%t1/st2/s CNN99.4198.641.250.0092456.047 SVM98.2096.523.020.0001103.318 DT98.3396.812.840.00008116.224 ANN98.5797.032.360.0104366.843
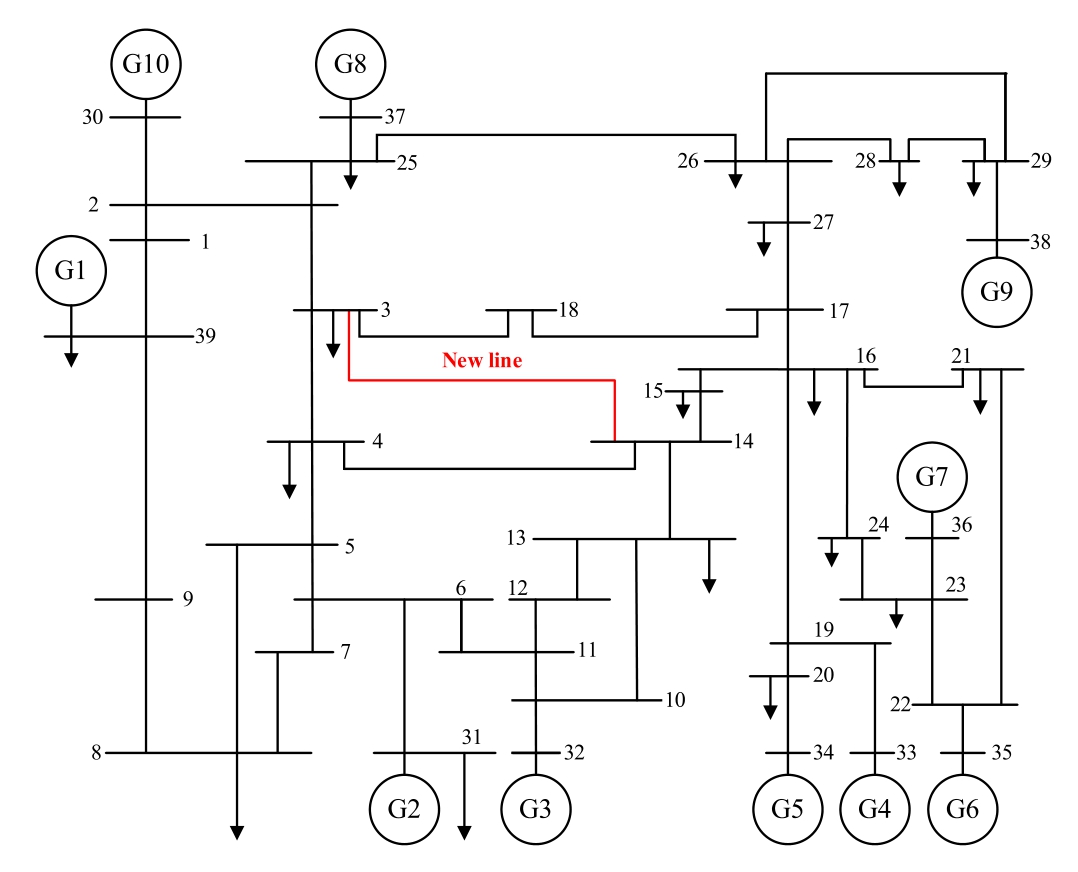
Fig.6.Topology after adding new lines.
Table 9 illustrates the individual metrics of the TSA model under both clustering management and unified management approaches.It can be observed that when the topology undergoes alteration, the line clustering approach not only ensures optimal training performance but also markedly reduces the training time.The clustering management approach enables the real-time adjustment of the model in response to the introduction of new lines,which is well-suited to real power systems that exhibit time-varying features.
4 Conclusion
This study proposed a model management approach for power system TSA based on multi-moment feature clustering.First, the steady-state and transient features present under fault conditions were obtaine d through a transient simulation of line faults.The input sample set was then constructed using the aforementioned multi-moment electrical features and the embedded faulty line numbers.Subsequently, K-means clustering was conducted on each line based on the similarity of their electrical features, employing t-SNE dimensionality reduction.The PSO-CNN model was trained separately for each cluster to generate several independent TSA models.Finally, a model effectiveness evaluation system consisting of five metrics was established, and the effect of the sample imbalance ratio on the model effectiveness was investigated.The model effectiveness was evaluated using the IEEE 39-bus system algorithm.It is imperative to acknowledge that the present study places emphasi s on the concept of clustering management, as opposed to the particular implementation of a TSA model.The clustering management mentioned in this paper are not limited to the PSO-CNN model, and the PSO-CNN model is used only to elaborate the idea of clustering management approach by taking an example of a widely used method with excellent results.The following conclusions may be drawn:
1) A comparison of the two traditional model management approaches, namely unified management and separate management, revealed that the clustering management approach of the lines according to the similarity of data features has an accuracy rate of 99.41%, an F1-Score of 98.64%, and an FPR of 1.25%.Furthermore, the model training time is a mere 456.047 s.The clustering management approach is capable of combining the two advantages of excellent evaluation performance and convenient model management, thereby better meeting the requirements of TSA in practical systems.
2) A comparison of the two shallow machines learning SVM, DT, and an artificial neural network ANN algorithms revealed that the use of CNN can improve the effect of TSA.However, in terms of discrimination time and model training time, the CNN algorithm does not demonstrate any significant advantages.
3) The clustering management approach also exhibits superior generalization performance.Upon the introduction of the new line, the clustering management approach necessitates only the local training of the clustering model about the aforementioned lines.This approach enabled the attainment of an accuracy rate of up to 96.85% within a training time of 142.634 s.The clustering management approach proposed in this study is more conducive to realtime model adjustment when a new line is added.
Table 9 Comparison of generalization performance of different model management approaches.

Model management approachACC/%F1/%FPR/%t1/st2/s Clustering management96.8596.472.780.0090142.634 Unified management92.4192.285.260.00924,156.20
This study offers a novel approach to the development and management of TSA models.Currently, it remains challenging to quickly and directly assess transient stability based on the original model when new buses are added to the system.Consequently, improving the generalizability of the model in such contexts will be a central area of future research efforts.
CRediT authorship contribution statement
Xiaoyu Han: Writing - original draft, Validation,Methodology, Formal analysis, Visualization, Software,Investigation, Data curation.Tao Liu: Methodology, Data curation, Formal analysis, Conceptualization.Defu Cai:Supervision, Project administration, Resources, Funding acquisition.Rusi Chen: Project administration, Supervision, Resources, Funding acquisition.Erxi Wang:Supervision, Project administration, Funding acquisition,Resources.Jinfu Chen: Writing - review & editing,Methodology, Supervision, Conceptualization.
Declaration of competing interest
The authors declare the following financial interests/personal relationships which may be considered as potential competing interests: Defu Cai, Rusi Chen, Erxi Wang is currently employed by Power Science Research Institute of State Grid Hubei Electric Power Co.
Acknowledgments
This work was supported by the Science and Technology Project of SGCC (5100-202199558A-0-5-ZN).
References
-
[1]
L.Zeng, Reinforcement Learning-Based Security Assessment and Stability Control of Complex Power Systems Dissertation,Huazhong University of Science and Technology, Wuhan, 2022. [百度学术]
-
[2]
X.Zhou, S.Chen, Z.Lu, Review and prospect of power grid and power grid technology development-a test of three generation power grid, Chin.J.Electric.Eng.33 (22) (2013) 1-11. [百度学术]
-
[3]
H.Chang, W.Liu, et al., Online application of power system transient stability calculation, Grid Technol.31 (13) (2007). [百度学术]
-
[4]
H.Chang, W.Liu, et al., Integrated energy simulation and analysis system based on PSASP, Grid Technol.43 (7) (2019) 2498-2505. [百度学术]
-
[5]
S.Wei, Transient stability analysis of power system based on Lyapunov exponent.Dissertation, Shandong University, 2018. [百度学术]
-
[6]
T.Oyama, A.Yokoyama, S.Sakaeda, et al., Online transient stability assessment employing decision tree and maximal Lyapunov exponent,in: Paper presented at the 2020 International Conference on Smart Grids and Energy Systems (SGES), 23-26 November 2020. [百度学术]
-
[7]
C.Wang, T.Jiang, et al., Transient voltage stability assessment of power systems based on phase-corrected Lyapunov exponent, J.Electrotechnol.36 (15) (2021). [百度学术]
-
[8]
C.Wu, J.Ren, et al., Transient stability margin refinement prediction based on artificial intelligence, Power Autom.Equip.41 (12) (2021). [百度学术]
-
[9]
B.Li, J.Wu, R.Zhang, et al.,Adaptive assessment of power system transient stability by integrating multi-type deep migration learning, Power Autom.Equip.43 (1) (2023) 184-192. [百度学术]
-
[10]
K.Wang, Z.Chen, W.Wei, et al., Power system transient stability assessment based on deep bayesian active learning, in: Paper presented at 2022 IEEE/IAS Industrial and Commercial Power System Asia (I&CPS Asia), 8-11 July 2022. [百度学术]
-
[11]
H.Zhao, Z.Shuai, Y.Shen, et al., Deep learning based online transient stability assessment method for microgrids with multiple virtual synchronous machines, Power Syst.Autom.46 (9) (2022)109-117. [百度学术]
-
[12]
T.A.N.G.Yi, C.U.I.Han, L.I.Feng, et al., A review of the application of artificial intelligence in power system transient problems, Chin.J.Electric.Eng.39 (1) (2019) 2-13. [百度学术]
-
[13]
B.Qian, Q.Chen, Z.Zhang, et al., Multi-task transient stability assessment based on feature-level fusion of heterogeneous data,Power Syst.Autom.47 (9) (2023) 118-128. [百度学术]
-
[14]
L.Zhang, J.An, Y.Zhou, Transient stability assessment of power systems based on time-convolution and graph attention networks,Power Syst.Autom.47 (7) (2023) 114-122. [百度学术]
-
[15]
L.Zhu, J.Zhang, et al., A convolutional neural network input feature construction method for transient voltage stability assessment, Power Syst.Autom.46 (1) (2022) 85-93. [百度学术]
-
[16]
Y.Zhou, Q.Guo, H.Sun, et al.,A novel data-driven approach for transient stability prediction of power systems considering the operational variability, Int.J.Electric.Power Energy Syst.107(2019) 379-394. [百度学术]
-
[17]
J.Zhou, M.Li, L.Du, et al., Power Grid transient stability prediction method based on improved CNN under big data background, in: Paper presented at the 2022 Asian Conference on Frontiers of Power and Energy(ACFPE),21-23 October 2022. [百度学术]
-
[18]
L.-P.Liu, et al., Application of K-means ++ algorithm based on t-SNE dimension reduction in transformer district clustering, in:Paper presented at the 2020 Asia Energy and Electrical Engineering Symposium (AEEES), Chengdu, China, 29-31 May 2020. [百度学术]
-
[19]
H.Guan, Y.Chen, S.Huang, et al., A deep learning based twolevel framework of power system operating condition clustering, in:Paper presented at the 2018 International Conference on Power System Technology (POWERCON), Guangzhou, China, 6-8 November 2018. [百度学术]
-
[20]
Z.Chen, B.Ren, J.Xu, et al., Generalized composite load aggregation considering different distributed PV systems based on improved K-means algorithm, in: Paper presented at 2022 Power System and Green Energy Conference(PSGEC),Shanghai,China,25-27 Aug 2022, pp.296-301. [百度学术]
-
[21]
J.Yang, J.Zhao, R.Meng, et al., Power system operation state identification based on particle swarm optimisation and convolutional neural network, Power Grid Technol.48 (1) (2024)315-324. [百度学术]
-
[22]
J.Yang, Z.Cao, Power system transient stability assessment method based on convolutional neural network, in: Paper presented at the 2019 Chinese Control and Decision Conference(CCDC), 3-5 June 2019, pp.5819-5824. [百度学术]
-
[23]
J.Ren, Research on data-driven transient stability analysis and preventive control of power system.Dissertation, Huazhong University of Science and Technology, 2022. [百度学术]
-
[24]
Y.Zhen, C.Ruan, Hierarchical adaptive transient voltage stability assessment based on cost-sensitive support vector machine and multivariate decision tree, Grid Technol.48 (2) (2024) 778-788. [百度学术]
-
[25]
L.Wang, D.Han, C.Wang, et al.,Transient stability assessment of power system based on MVEE and LSPTSVM, Power Syst.Protect.Control 48 (17) (2020) 45-54. [百度学术]
-
[26]
Y.Shi, Y.Li, J.Cao, et al., Transient voltage stability assessment method based on morphological similarity distance, J.Pow er Syst.Autom.32 (5) (2020) 105-112. [百度学术]
-
[27]
T.Oyama, A.Yokoyama, S.Sakaeda, et al., Online transient stability assessment employing decision tree and maximal Lyapunov exponent, in: Paper presented at the 2020 International Conference on Smart Grids and Energy Systems(SGES), Perth, Australia, 23-26 November 2020. [百度学术]
-
[28]
N.G.Baltas, P.Mazidi, J.Ma, et al., A comparative analysis of decision trees, support vector machines and artificial neural networks for online transient stability assessment, in: Paper presented at the 2018 International Conference on Smart Energy Systems and Technologies(SEST),Seville,Spain,10-12 September 2018. [百度学术]
-
[29]
Z.Zhou, G.Bu, S.Ma, et al., Transient stability assessment and optimisation of power systems based on feature separated neural networks, Power Grid Technol.45 (9) (2021) 3658-3666. [百度学术]
-
[30]
M.Li, et al., Artificial neural network classifier of transient stability based on time-domain simulation, in: Paper presented at 2018 2nd IEEE Advanced Information Management, Communicates,Electronic and Automation Control Conference (IMCEC), Xi’an,China, 25-27 May 2018. [百度学术]
Fund Information

