Recommended articles:
-

-
Global Energy Interconnection
Volume 8, Issue 5, Oct 2025, Pages 760-777
A photovoltaic array DC arc fault location method integrating MKDANN and SPA☆
Abstract
Abstract This paper proposes a fingerprint matching method integrating transfer learning and online learning to tackle the challenges of environmental adaptability and dynamic interference resistance in photovoltaic (PV) array DC arc fault location methods based on electromagnetic radiation (EMR)signals.Initially, a comprehensive analysis of the time-frequency characteristics of series arc EMR signals is carried out to pinpoint effective data sources that reflect fault features.Subsequently,a multi-kernel domain-adversarial neural network(MKDANN)is introduced to extract domain-invariant features,and a feature extractor designed specifically for fingerprint matching is devised.To reduce inter-domain distribution differences, a multi-kernel maximum mean discrepancy (MK-MMD) is integrated into the adaptation layer.Moreover, to deal with dynamic environmental changes in real-world situations, the support-class passive aggressive(SPA) algorithm is utilized to adjust model parameters in real time.Finally, MKDANN and SPA technologies are smoothly combined to build a fully operational fault location model.Experimental results indicate that the proposed method attains an overall fault location accuracy of at least 95%, showing strong adaptability to environmental changes and robust interference resistance while maintaining excellent online learning capabilities during model migration.
0 Introduction
Due to population growth and economic activities,energy consumption is rising rapidly [1].At present, the development and utilization of solar energy resources in China are expanding swiftly[2].Nevertheless,photovoltaic(PV) systems are confronted with a host of safety challenges, among which the concealed risk of series DC arc faults is especially prominent [3].In real-world situations,it is not enough to merely detect the existence of a fault;it is vital to explore and develop effective fault location techniques to quickly and precisely locate the fault source when it occurs.This is crucial for preventing fault escalation and ensuring the continuous and stable operation of PV systems [4].
The voltage and current [5] characteristics of PV array DC arcs,as well as their optical,acoustic,and electromagnetic radiation (EMR) properties, can be effective means for fault detection or localization [6].Generally speaking,the electrical signal detection method is ineffective in accurately locating the fault occurrence position,whereas localization based on EMR signals has demonstrated superior performance, with its effectiveness validated in the field of partial discharge detection in high-voltage equipment.Unfortunately, due to the short measurement distance of EMR signals, the measurement of full-domain signals inevitably requires the use of a large number of sensors,thereby increasing the hardware cost of the measurement system to a certain extent.Nowadays, a large number of building-integrated PV (BIPV) modules have been installed across China, which has put forward stricter requirements for preventing fires caused by arc faults.In response, some local governments have demanded the installation of signal acquisition and bypass disconnection devices on each module and explicitly encouraged the deployment of more intelligent sensing devices on rooftop PV systems.Under the support of policies and the guidance of industry trends, the large-scale and standardized production of sensors is expected to significantly reduce unit costs, thereby providing a cost-performance basis for the wide application of detection technologies based on EMR signals.
For this reason, researchers around the world have actively probed the feasibility of using EMR signals for arc fault localization.Wang et al.[7,8] designed a thirdorder Hilbert fractal antenna and analyzed the influence of measurement distance on EMR signal strength.By combining an antenna array with a generalized crosscorrelation time-delay estimation method, they achieved a localization error within 15%.Jin et al.[9]fed irradiance and EMR signals into a backpropagation neural network to fit the distance from a dual-antenna array to the fault point.By integrating a triangulation method with PV array grid-based localization, they further enhanced accuracy, attaining a mean absolute localization error of less than 0.365 m.Zhao et al.[10]compared EMR signals from known locations with those from unknown locations,using a Bayesian regularization neural network to predict the distance between a four-antenna array and the fault,thereby calculating the spatial coordinates of the arc.Li et al.[11] used a neural network combined with data augmentation techniques to estimate fault distance.Their method only needs two detection points to complete the planar localization of the arc while remaining immune to normal current fluctuations.
Among the mainstream fault localization methods,techniques based on EMR signals mainly comprise time difference of arrival (TDOA) [12], angle of arrival (AOA)[13], and received signal strength indicator (RSSI) [14]. [7-11] have concentrated on the individual or combined application of TDOA and RSSI, while AOA technology has shown unique advantages in specific scenarios, such as dealing with ultrahigh-frequency electromagnetic waves generated by partial discharges [15].However,because of the multipath propagation characteristics of EMR signals when reaching an antenna array,TDOA methods may suffer significant deviations when solving nonlinear equations in practical applications [16].Likewise, AOA methods require high-performance directional antennas to strengthen interference resistance.Although derivative techniques,such as the multiple signal classification (MUSIC) method, can achieve precise localization,the increased hardware requirements also result in higher costs [17].In comparison, the RSSI method only needs to measure signal strength,offering advantages such as low cost and strong environmental adaptability [18].Therefore, it has greater potential for widespread application in PV system arc fault localization.
The RSSI-based method currently adopts two localization strategies: the distance estimation method and the fingerprint matching method.The distance estimation method depends on accurate measurement and modeling of signal propagation characteristics in the localization environment.However,its performance is vulnerable to interference from non-line-of-sight (NLOS) conditions, multipath effects, and other factors, showing similar limitations to the TDOA method.In contrast, the fingerprint matching method establishes a mapping relationship between EMR signal characteristics and fault locations by collecting and analyzing EMR signal features,thus achieving higher localization accuracy.Therefore, this paper employs a fingerprinting method to locate arc faults by constructing a fingerprint database using EMR samples collected from various spatial locations within the experimental environment.However,real-world scenarios are highly complex and variable,and discrepancies in fingerprint databases across different stations hinder the widespread application of the fingerprinting method.Upon acquiring new samples,online learning and transfer learning can be utilized to improve model performance to some extent.High-quality online learning relies on an adequate number of training samples with a balanced distribution.Nevertheless, in new PV stations,arc fault samples are typically scarce and unevenly distributed, and such regional sample imbalance can significantly degrade model performance.To address this issue, some researchers have conducted investigations in other domains.Ren et al.[19]proposed a federated domain adaptation framework to mitigate the impact of category absence in the target domain on diagnostic accuracy.[20,21]introduced novel transfer learning methods to tackle distributional discrepancies and label scarcity between source and target domains, thereby enhancing model generalization. [22-24] focused on improving model generalization and adaptability under imbalanced data conditions by proposing corresponding optimization strategies.Considering that studies on environmental adaptability and resistance to dynamic interference are limited in the photovoltaic domain,this paper proposes a fingerprint matching algorithm that integrates online learning and transfer learning,tailored to the characteristics of photovoltaic application scenarios.
The key features of the proposed algorithm are as follows:
1) The root mean square(RMS)value of arc EMR signals is used as a fingerprint feature that resists irradiance interference.A fingerprint database is constructed through overlapping sampling and irradiance normalization, which maximizes the utilization of limited samples and eliminates the influence of irradiance.This clarifies the mapping relationship between features and positioning distance, thereby effectively improving localization accuracy.
2) A multi-kernel domain-adversarial neural network(MKDANN) is employed to extract domaininvariant features, and the multi-kernel maximum mean discrepancy (MK-MMD) is introduced into the adaptation layer to reduce the distribution discrepancy between the source and target domains.This improves the model’s adaptability to varying operating environments and enhances its generalization ability under cross-domain conditions.
3) The support-class passive aggressive (SPA) algorithm is adopted, which utilizes online learning and fast update mechanisms to achieve rapid parameter inheritance and adaptive updating during joint training.This enables immediate response to environmental changes and offers strong robustness against dynamic variations in irradiance, temperature, and electromagnetic interference.
1 Analysis of EMR characteristics of PV array arc
1.1 Experimental platform and data collection
The PV power generation system utilized in this study is illustrated in Fig.1, which is composed of a PV array, a DC combiner box,an inverter,and a grounding fault protection device [25].The detailed parameters of each component within the system are presented in Table 1.Specifically, in the table, Pmppt signifies the output power of the PV module under maximum power point tracking(MPPT) conditions, Vmppt denotes the voltage at MPPT,and Imppt represents the current at MPPT.Moreover,Voc and Isc indicate the open-circuit voltage and shortcircuit current of the module, respectively.
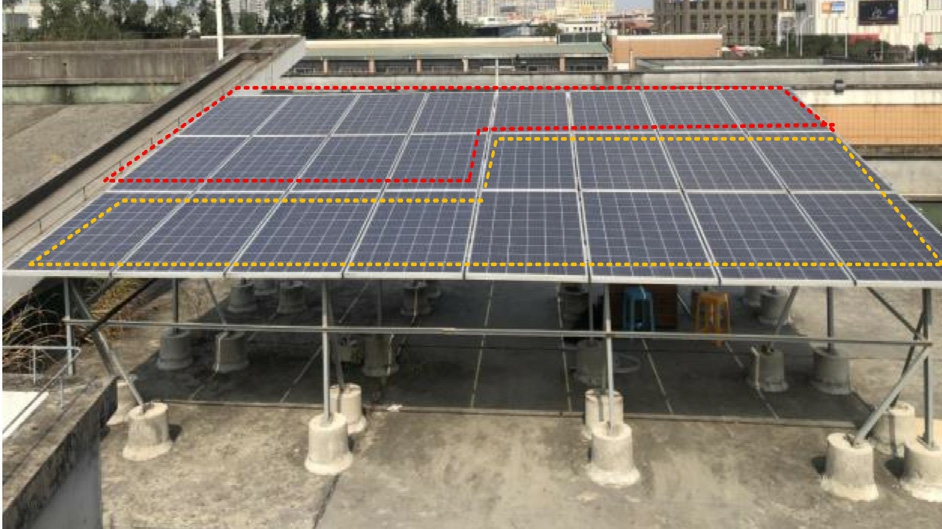
Fig.1.Experimental platform of PV system.
Table 1 Parameters of PV module.
ItemPmpptVmpptImpptVocIsc Parameter270 W31.3 V8.63 A38.5 V9.09 A
All of these five values were measured under standard test conditions.The entire PV array is made up of 24 PV modules, which are arranged in a 212 configuration.That is to say, in each string, there are 12 modules connected in series, and then two such strings are connected in parallel.
In this study, a DC arc fault generator (AFG) is employed to systematically investigate arc fault generation mechanisms.To comprehensively evaluate the impact of fault location variations on localization accuracy, the AFG is strategically positioned at three critical points along the PV array: the string head, midpoint, and terminal end.Both the AFG design specifications and fault injection protocols strictly adhere to the updated UL 1699B standard [26], ensuring methodological compliance with industry safety requirements.

Fig.2.EMR signal reception and processing process.
Table 2 Parameters of EMR signal acquisition equipment.
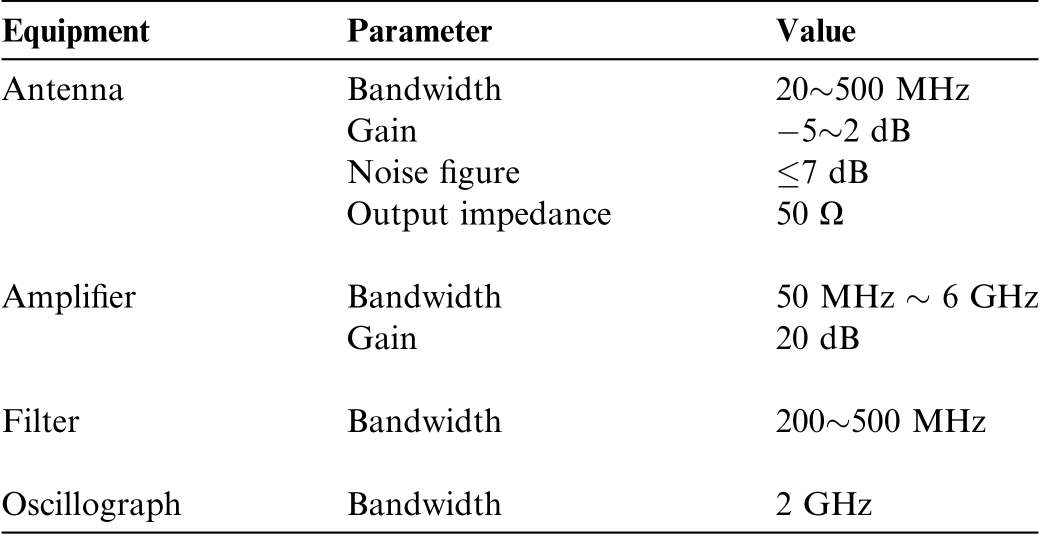
EquipmentParameterValue AntennaBandwidth20 500 MHz Gain5 2 dB Noise figure7 dB Output impedance50 Ω AmplifierBandwidth50 MHz 6 GHz Gain20 dB FilterBandwidth200 500 MHz OscillographBandwidth2 GHz
The EMR signal acquisition process is illustrated in Fig.2.When an arc fault occurs, the fault point continuously emits EMR signals,which are first received by a dedicated frequency-band antenna array.The signals are then amplified by a power amplifier, filtered by a band-pass filter to remove noise, and finally captured and analyzed using an oscilloscope.The parameters of the measurement equipment are listed in Table 2.It is important to note that the antennas used in this study are omnidirectional,ensuring that the received signals remain unaffected by orientation changes.This orientation-independent feature ensures consistent signal reception regardless of probe positioning relative to the fault source.The EMR signal is closely related to the antenna array.The antenna layout and environmental interference will affect the effect of signal acquisition and positioning to a certain extent.This paper uses a four-antenna layout with relatively high recognition.Through the optimization of hardware filters and signal processing algorithms,the accuracy and quality of the signal can be effectively improved.
1.2 EMR characteristics of PV arc
A high-bandwidth oscilloscope is used to analyze the frequency-domain characteristics of the EMR signal, as shown in Fig.3.The results indicate that due to interference from electronic devices in the PV power plant, the arc fault characteristics are not prominent in the lowfrequency range of 0-170 MHz.However, distinct characteristics are observed in the frequency range of 170-400 MHz, which aligns with the frequency bands of the antenna, amplifier, and filter listed in Table 2.
When using the received signal strength indicator(RSSI)method for fault localization, it relies on statistical characteristics over a longer time scale rather than instantaneous values.This method requires lower signal integrity and is effective as most arc fault characteristics lie within the 1-100 kHz frequency band [27].According to the Nyquist sampling theorem, the sampling rate must be at least twice the highest frequency of the signal.Based on this principle, a 200 kHz sampling rate is selected for data acquisition in this study.Through time-domain analysis of the EMR signals,the variation in the signal can be further explored, as shown in Fig.4.
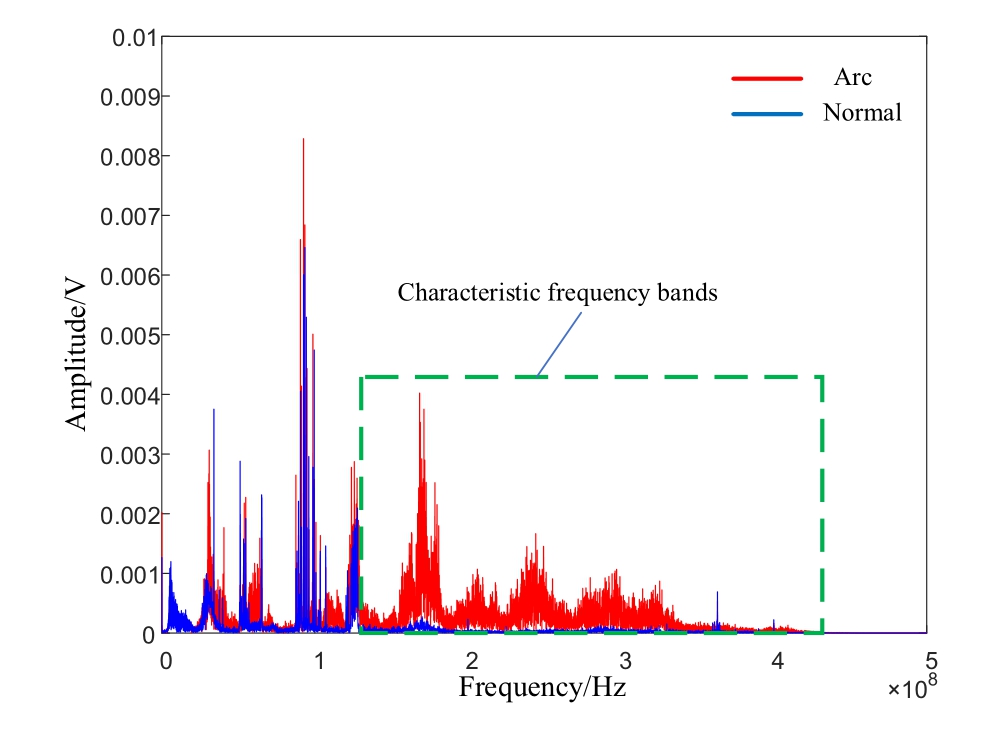
Fig.3.Frequency-band distribution of DC arc EMR signal.
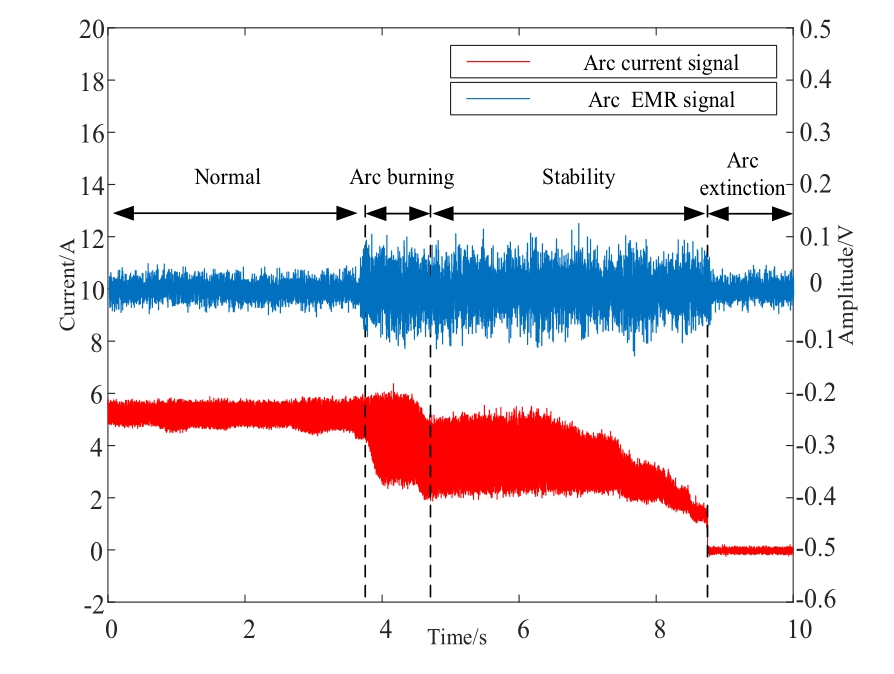
Fig.4.Waveform of arc current and EMR signal.
As illustrated in Fig.4, a distinct contrast emerges between the two waveform patterns.Specifically, during both the arc ignition phase and stable combustion phase,the EMR signal maintains relatively consistent amplitude levels.In stark contrast, however, the normal operational phase and arc extinguishing phase exhibit rapid signal dissipation without observable transitional states.
Given that the stable combustion phase demonstrates particularly steady waveform characteristics that facilitate effective feature extraction for localization purposes, this study therefore selects the 170-400 MHz frequency range combined with stable arc combustion waveform data as the optimal signal source for localization analysis.
2 Positioning algorithms
2.1 Pairing of RSSI fingerprint
RSSI, serving as a critical metric for wireless signal measurement, exhibits an inverse correlation with transmission distance: signal strength diminishes progressively as the distance between receivers and signal sources increases, and conversely intensifies with proximity.This fundamental principle underpins distance-based localization through RSSI analysis.
The fingerprint matching methodology capitalizes on the spatial uniqueness of RSSI distributions.Each geographic location generates a characteristic RSSI profile,termed a‘‘fingerprint”,which demonstrates environmental specificity.Crucially, these fingerprints dynamically adapt to positional variations of signal sources.By comparing the real-time measured RSSI values from various receiving devices with the fingerprints in the fingerprint database,the position of the signal source can be determined.This method reduces the impact of spatial environment on localization errors.In practical deployment, it consists of two stages: fingerprint database construction and online matching.
During the fingerprint database construction phase,the AFG is initially deployed to generate controlled arcs at predefined reference positions.These positions are referred to as reference points,denoted as RPj,where j ranges from 1 to N.The layout of the reference points follows a specific pattern, such as arranging them according to the distribution of PV panels to form a regular rectangular area.Antennas are placed within this area, and the positions of the antennas are referred to as receiving points,denoted as APi,where i ranges from 1 to M.When an arc occurs at the RPi point,the RSSI value measured by antenna APi is represented as φi,j(τ),where τ=1, ,p,with p >1,and p indicating the number of measurements.This allows the creation of a fingerprint characteristic map for the measured area:
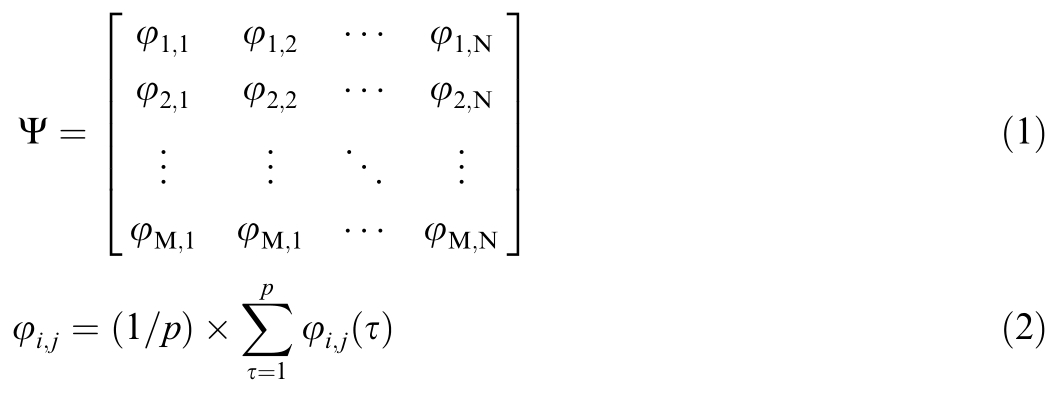
where φi,j represents the average value of the p measurements.The column vector ψj in ψ represents the RSSI fingerprint of the observation point RPj,i.e.,the RSSI values measured by various antennas when the arc fault occurs at RPj.The online localization phase is based on this fingerprint for accurate arc fault localization.
During an arc fault occurrence, the RSSI values from each antenna are collected in real-time to form a realtime fingerprint vector ψj, which is then matched with the fingerprints in the fingerprint database for localization.In this process, the most critical element is the matching algorithm,as its performance directly impacts localization accuracy.Traditional matching algorithms calculate the similarity between the real-time fingerprint and the fingerprints of various positions in the database, thereby identifying the position or device most similar to the real-time fingerprint.However, these methods struggle to capture complex nonlinear relationships and have poor adaptability to the changing conditions in a complex PV environment.Therefore, this study employs neural networks for fingerprint matching and integrates transfer learning and online learning to enhance the algorithm’s adaptability to complex environmental changes.
2.2 Building of fingerprint library
This study employs the EMR signal generated during arc fault events as the RSSI value to construct the fingerprint database, which consequently necessitates preprocessing of the acquired EMR signals.Since the captured EMR signal is a one-dimensional time-series data,overlapping sampling[28]is applied to maximize the use of limited data samples in generating training samples.A low sampling rate of 200 kHz is employed in this study.Due to aliasing and insufficient resolution, spectral features such as peaks and other time-domain information are easily contaminated by random noise, resulting in poor antiinterference ability and significant drawbacks as fingerprint features.Reference[9]mentions that changes in irradiance can provide a better mapping through variations in RSSI values.As a statistical signal indicator, the RMS serves as a comprehensive metric that reflects the overall signal energy while capturing amplitude characteristics of non-stationary DC arc fault variations, thereby effectively compensating for potential signal distortion induced by low sampling rates.Collectively, these technical advantages establish a robust foundation for accurate arc fault detection.The specific procedure is as follows: a fixedstep moving sampling window is applied to ensure that adjacent samples overlap, with the overlap length set to 200.
The waveform time window is set to 5 ms, and after completing the overlapping sampling, the EMR signal undergoes DC removal and median filtering.Finally, the RMS value is computed:
where Xv represents the processed EMR signal, with a length of ϖ.To eliminate the influence of irradiance variations on the experimental results, the EMR signal values at the minimum and maximum irradiance levels, denoted as minErms and maxErms, are measured at each reference point.Based on these values, the EMR signal values obtained during the experiment are normalized as follows:
where φi,j(τ) represents the normalized Erms.
2.3 Network of MKDANN
Domain-adversarial transfer learning is an effective approach to reducing marginal distribution discrepancies between the source and target domains, thereby minimizing domain shift issues [29].The domain-adversarial neural network (DANN) consists of three main components:a feature extractor, a domain discriminator, and a label predictor.The feature extractor maps and mixes data from both the source and target domains to extract domaininvariant features.The domain discriminator distinguishes whether the extracted features originate from the source or target domain, forming an adversarial relationship with the feature extractor.Meanwhile, the label predictor is responsible for classifying the source domain data.
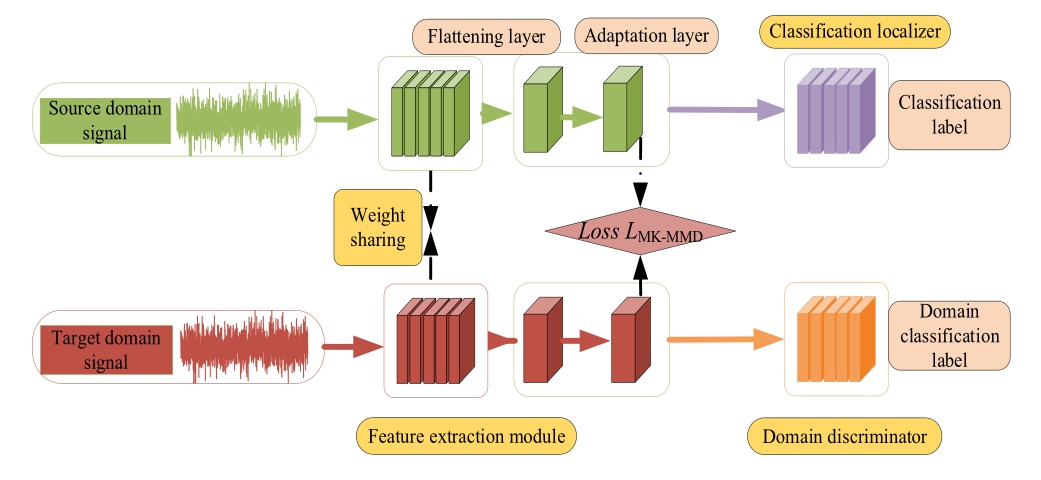
Fig.5.Structure of MKDANN.
To accommodate the fingerprint matching method and the complex environment of PV systems, this study proposes a MKDANN, whose structure is illustrated in Fig.5.Although DANN are capable of automatically extracting the most discriminative features from raw data for downstream tasks,the extracted features are implicitly represented.This inherent ‘‘black-box” nature limits the interpretability of the model and hinders its performance in cross-domain scenarios.Compared to the conventional feature extraction networks employed in DANN, the proposed model integrates a specialized feature extractor tailored for fingerprint-based localization.Moreover, the MK-MMD algorithm is introduced in the adaptation layer to enhance the ability to capture distribution discrepancies between the source and target domains through multi-kernel mapping.This approach improves the model’s transferability across diverse application scenarios and enhances the adaptability of feature extraction.Traditional DANN utilize maximum mean discrepancy(MMD)as a distribution distance metric, whereby the mathematical foundation of MMD essentially operates by mapping respective source and target domain features into a reproducing kernel Hilbert space(RKHS),thus enabling precise computation of inter-domain distribution divergence through mean distance measurement in this transformed feature space.Assuming that the source domain is denoted as s with a data distribution of P,and the target domain is denoted as t with a distribution of Q, the MMD is calculated as follows:
where  denotes the mathematical expectation, and Hk represents the RKHS with the characteristic kernel k.The condition MMDk P Q0 if and only if P Q[30].Different kernels can embed probability distributions into different RKHS spaces, thereby emphasizing different orders of sufficient statistics.To comprehensively capture domain discrepancies, this study incorporates the MKMMD algorithm,which employs multiple kernel functions to enhance domain adaptation.The mixture of Nk Gaussian kernels is expressed as:
where kσi represents a Gaussian kernel with a bandwidth parameter of σi.In the context of arc fault localization in PV systems, this approach effectively addresses variations in environmental conditions and discrepancies among different devices, thereby enhancing the robustness and accuracy of fault localization.
2.4 Algorithm of SPA
The passive aggressive(PA)algorithm processes incoming information sequentially, enabling it to track changes in data distribution in real time and adapt flexibly to various dynamic environments [31].During the arc burning process, where surrounding environmental conditions remain relatively stable (i.e., data distribution remains unchanged), the PA mechanism continuously optimizes its internal weights through iterative parameter updates,while performing minor adjustments to counteract noise interference and maintain operational stability.Conversely, when environmental conditions undergo abrupt changes, PA exhibits adaptive plasticity to discard obsolete weight configurations and progressively adapt to the emerging data distribution patterns.
Upon receiving a new data instance, PA updates the parameters of the estimation function based on the instance’s features and labels.For classification tasks, the estimation function maps input data to the corresponding class labels:
where the discriminant function  predicts the label for input x during the i-th learning iteration, where
  denotes the weight parameter for calculating the probability of the u-th class among K total classes.
The loss function for classification tasks is represented using the hinge loss function:

The SPA algorithm differs from the PA algorithm in how it handles the slack variable, enabling it to support multi-class tasks [32].To enhance system adaptability, a hyperparameter C is strategically embedded within the constraint conditions, where increased C magnitudes proportionally enhance the algorithm’s sensitivity to environmental variations, thereby triggering accelerated weight updating.The corresponding optimization function is formulated as:

The weight update step size of the SPA algorithm is given by:
where j represents the class label,and ψ j yi is an indicator function,where τv denotes the step size for each class.S denotes the support vector,which is determined by the following equation:

where σ k is the k-th class sorted in descending order of lj(j = 1, ,K).
2.5 Arc fault location algorithm integrating MKDANN and SPA
2.5.1 Joint training strategies
Both MKDANN and SPA involve feature extraction processes while mutually serving as training foundations.The joint training procedure operates as follows: During MKDANN training phases, the label predictor inherits weight parameters from SPA and undergoes training with limited unlabeled target-domain fingerprints,whereas during SPA training cycles,the model conversely acquires initialization weights from MKDANN’s label predictor while being optimized using abundant labeled source-domain fingerprints.This alternating process iterates until model convergence is achieved.
Let the feature extractor, domain discriminator, and label predictor in MKDANN are represented as Gf, Gd,and Gy respectively, the loss function is calcculated as follows:
where  and
and  denote the loss functions of the label predictor and domain discriminator,respectively,xi represents the one-dimensional input data.The corresponding fingerprint labels and domain labels are encoded as yi and di, respectively.
The parameter update rule for MKDANN during each training batch is expressed as:

In each training batch,the parameter update for SPA is given by:

where μ, λ, and α represent learning rates,  denotes the parameterupdatedaccordingto(16),and
![]() signifies assigning the weight θy of the label predictor in MKDANN to the weight w of SPA.During joint training, Eqs.(15) and (16) are alternately executed until convergence.
signifies assigning the weight θy of the label predictor in MKDANN to the weight w of SPA.During joint training, Eqs.(15) and (16) are alternately executed until convergence.
As shown in Fig.6,the loss function exhibits significant fluctuations in the initial training phase due to the random initialization of model weights and the substantial distribution difference between the two domains.However, as training progresses, the fluctuations gradually diminish,and the loss function stabilizes until convergence.Following the joint training phase, the model transitions into the online training stage, where the parameters of the feature extractor are frozen, thereby achieving environmental tracking capability solely through adjustments to the parameters of SPA.
2.5.2 Process of targeting
This paper proposes a PV DC arc fault fingerprint pairing localization method, as illustrated in Fig.7, with the following procedural steps:
1) Select a rectangular area within the PV array and determine the positions and quantities of reference points and receiving points.
2) Use an AFG to generate arc faults at the reference points, capture the arc EMR signals at the receiving points through the antenna array, and process them into φ.
3) Modify the environmental conditions at the experimental site and define the source domain and target domain.Collect both labeled and unlabeled fingerprint data in these domains and store them in the electromagnetic fingerprint database.
4) Perform joint training on the collected data using the integrated MKDANN and SPA model.
5) Once the model reaches the predefined accuracy,transition to the online training phase.Upon detecting an arc occurrence,the model sequentially receives EMR data and utilizes the trained parameters and structure for localization.
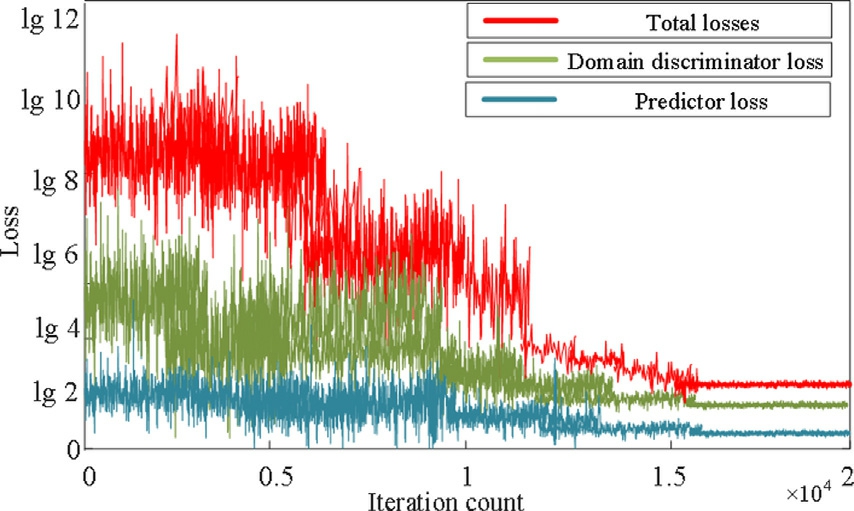
Fig.6.Changes in loss of algorithm training.
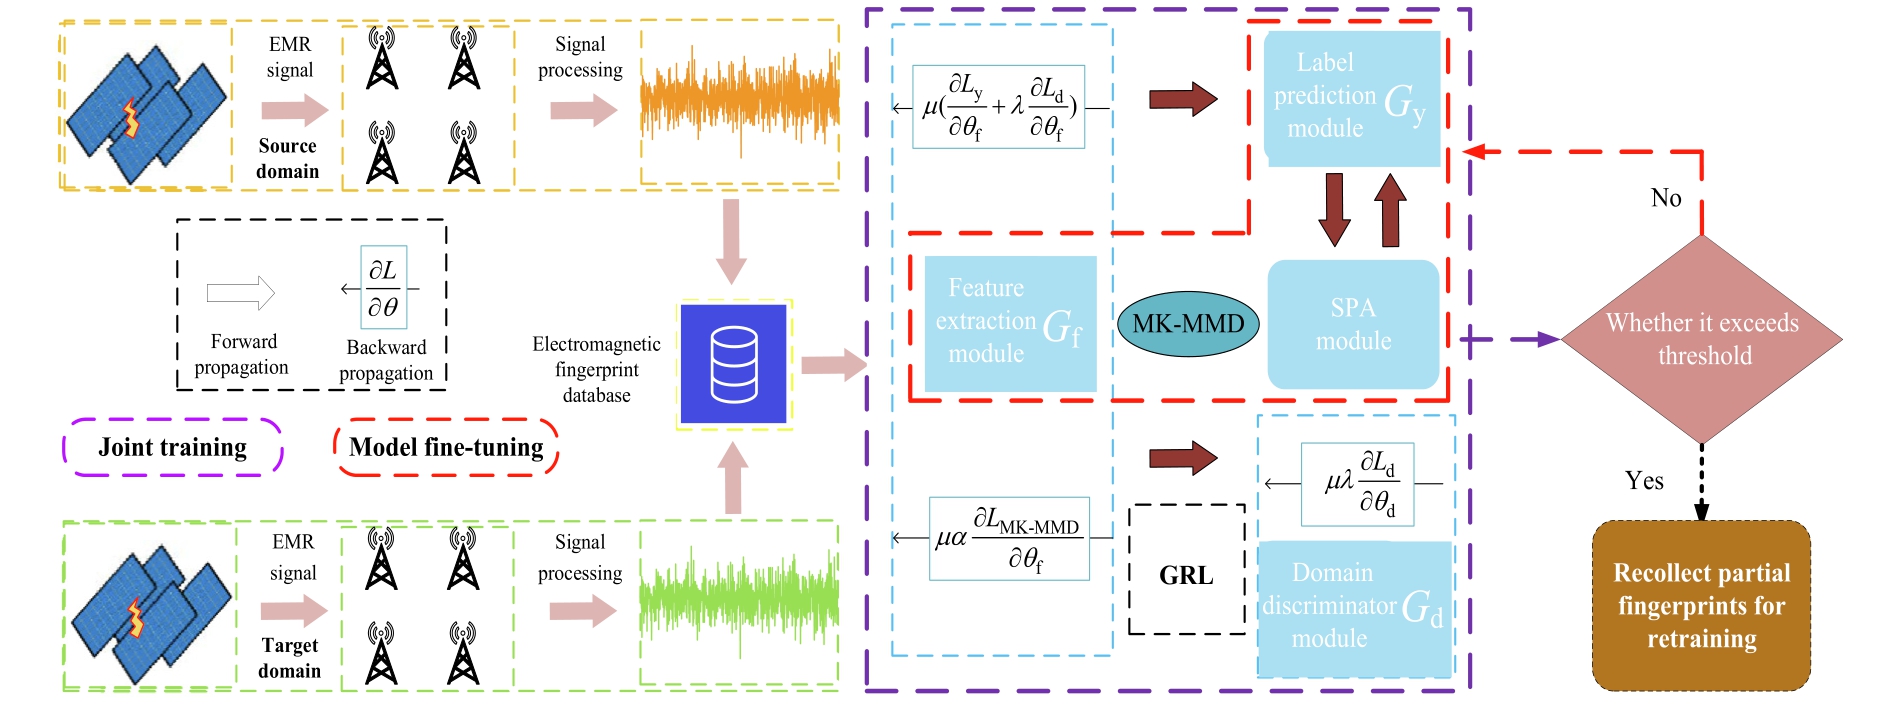
Fig.7.Fault location process of PV array series arc.
6) If significant environmental changes lead to localization errors exceeding a predefined threshold, return to Step 2 and retrain the model using newly collected unlabeled fingerprint data.
3 Experimental verification and analysis
3.1 Data acquisition and environment settings
3.1.1 Acquisition of data
The test site layout is illustrated in Fig.8, where a square area of 4 m4 m was designated within the PV array.Specifically, the reference points were arranged in a uniform grid pattern with 1 m spacing between adjacent points, resulting in a total of 25 reference points.Subsequently, a Cartesian coordinate system was established in the plane, and four antennas were placed at the four corners of the area, labeled in a clockwise manner as S1, S2,S3, and S4.
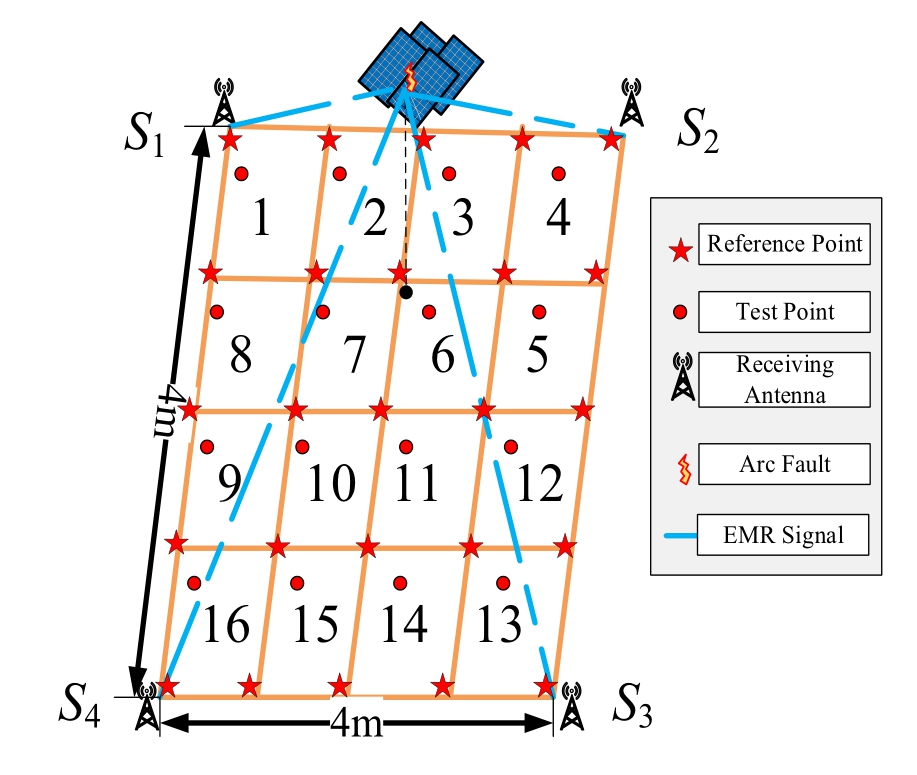
Fig.8.Schematic diagram of test site.
In the source domain,an AFG was used to generate 20 arc events at each reference point, thereby ensuring a sufficient amount of labeled data.In contrast, within the target domain, where practical challenges in data labeling exist, fewer arc events (e.g., five per reference point) were generated, resulting in only unlabeled fingerprint data being collected.This disparity in experimental scale directly leads to a significantly larger data volume in the source domain compared to the target domain.For fingerprint classification,a nearest-neighbor principle was implemented,by which each fingerprint data point was assigned to its closest reference point based on spatial proximity.
3.1.2 Settings of migration environment
To train the transfer learning component of the model,five different environmental settings were established under the PV array, as shown in Table 3.
Env1 represents the original environment,serving as the source domain, while Env2-Env6 are modified environments, acting as target domains.Env2 simulates a propagation path with obstructions.Since metal obstacles attenuate electromagnetic waves [33], a large iron tower was introduced to mimic real-world obstructions in PV fields.This setup evaluates the model’s adaptability to signal degradation.Env3 involves replacing all signal reception devices.The antenna frequency band was adjusted to 300-600 MHz, and the amplifier band was updated to 100 MHz-7 GHz.These modifications alter the receptionand amplification characteristics of EMR signals,allowing the model’s robustness against device diversity to be tested[34].Env4 modifies both the antenna and reference point layout.The antenna configuration was changed to a diamond pattern, and the number of reference points was reduced to 16.This setting examines whether the model can extract effective domain-invariant features and maintain localization performance under different layouts.Env5 introduces electromagnetic interference (EMI).A rotating motor was used to generate EMI signals within the 250 MHz-2 GHz band, which overlaps with the PV DC EMR spectrum.This scenario evaluates the model’s anti-interference capability.Env6 simulates real-world temperature fluctuations and weather transitions (e.g.,overcast to sunny).The irradiance varies between 420-839 W/m2, and the temperature fluctuates between 17 and  , closely resembling actual PV system operating conditions.Among these environments,Env2 to Env4 primarily assess the transfer learning performance of MKDANN, while Env5 and Env6 focus on evaluating the online learning capability of SPA.The different target domain scenarios are illustrated in Fig.9.
Table 3 Description of different transfer learning environments.

EnvironmentDescription of change Env1Original environment without any modifications Env2Simulating signal propagation paths with obstructions Env3Modifying EMR signal reception devices Env4Simulating different antenna and reference point layouts Env5Simulating electromagnetic interference Env6Simulating highly variable meteorological conditions
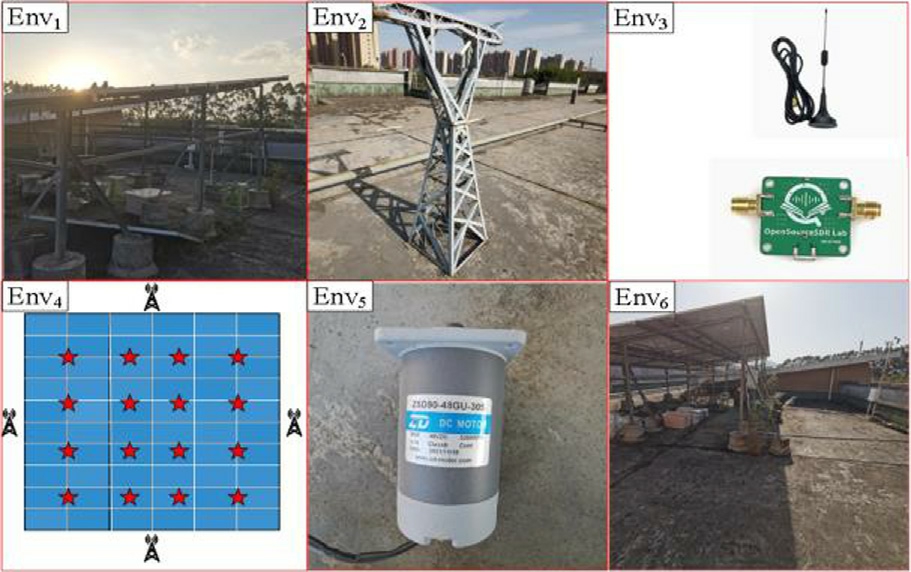
Fig.9.Source and target domain environments.
3.2 Construction and analysis of fingerprint
3.2.1 Propagation range of EMR signals
This study employs Erms as an indicator to evaluate the attenuation level of EMR signals.The baseline Erms was measured to be approximately 0.01634 under varying irradiance conditions without the presence of arc faults,which remains relatively stable and is primarily attributed to background noise.When an arc fault occurs, the Erms signal strength significantly exceeds this baseline value.Considering that Erms is sensitive to changes in irradiance,experiments were conducted to quantify the relationship between the distance from the antenna to the arc fault location and Erms under high (HI), medium (ME), and low(LO)irradiance levels.Once the measured Erms returns to the baseline level, it is regarded as incapable of representing arc fault characteristics.As illustrated in Fig.10,under high, medium, and low irradiance conditions, the distances at which the signal attenuates to the baseline are 6.8 m, 6.4 m, and 6.0 m, respectively.To ensure effective signal detection,the corresponding maximum effective propagation distances are set slightly lower at 6.6 m,6.2 m,and 5.8 m.Therefore, under normal conditions, the effective propagation distance of the EMR signal can be considered within a 5.8 m radius from the arc fault location to the antenna.
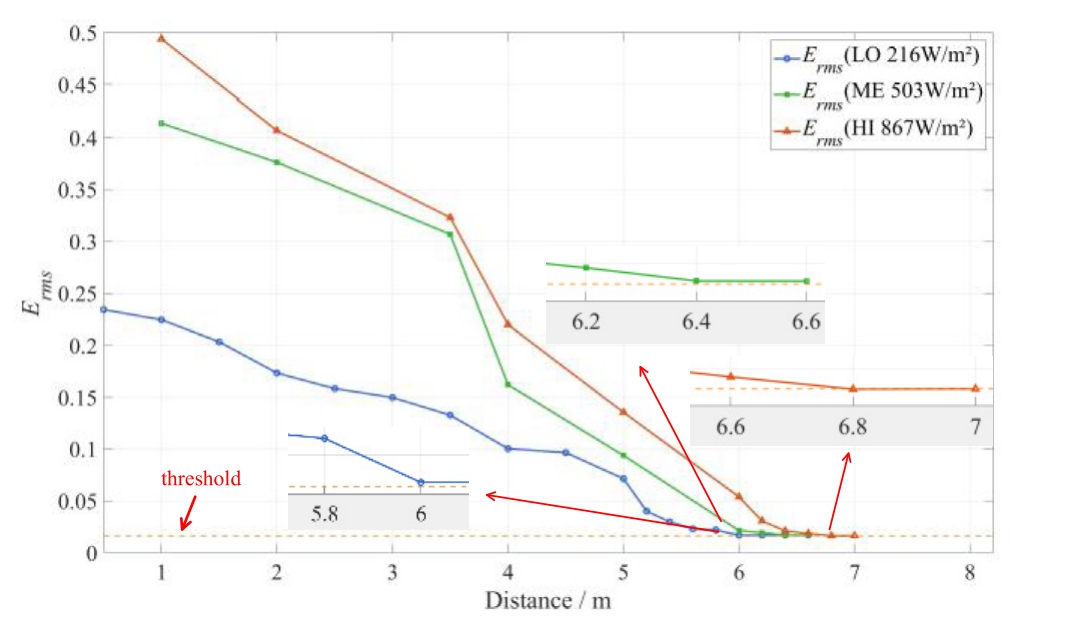
Fig.10.Variation of Erms with distance.
Reference [11] reports that when the distance between the antenna and the arc fault exceeds 3.31 m,the resulting localization error surpasses 0.5 m, which is beyond the acceptable error range for DC arc fault localization.Accordingly,this study designs a four-antenna rectangular array layout,where each antenna has an effective localization radius of 3.31 m.Full and effective coverage of the entire area can be achieved when the coverage zones of these antennas overlap.As shown in Fig.11, the four antennas are positioned at the vertices of a square whose maximum side length is 2 times the antenna’s effective radius, i.e., 4.6 m.This configuration ensures that the 4 m 4 m testing area used in this study meets the effective localization conditions for EMR, thus enabling precise full-area localization coverage.
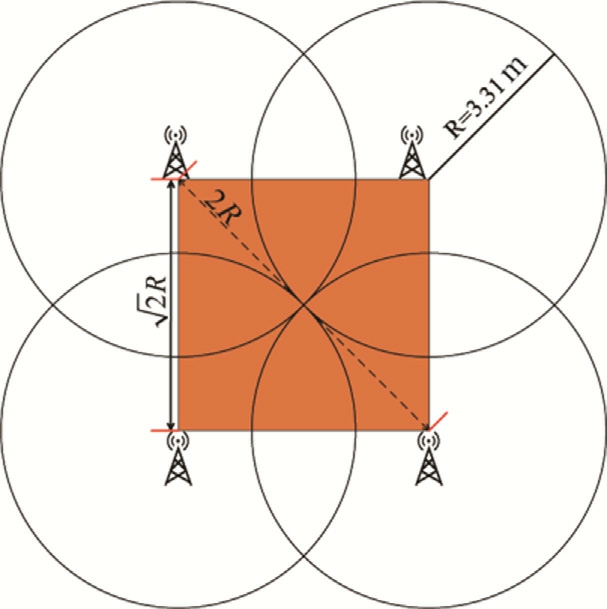
Fig.11.Maximum signal coverage range under four-antenna layout.
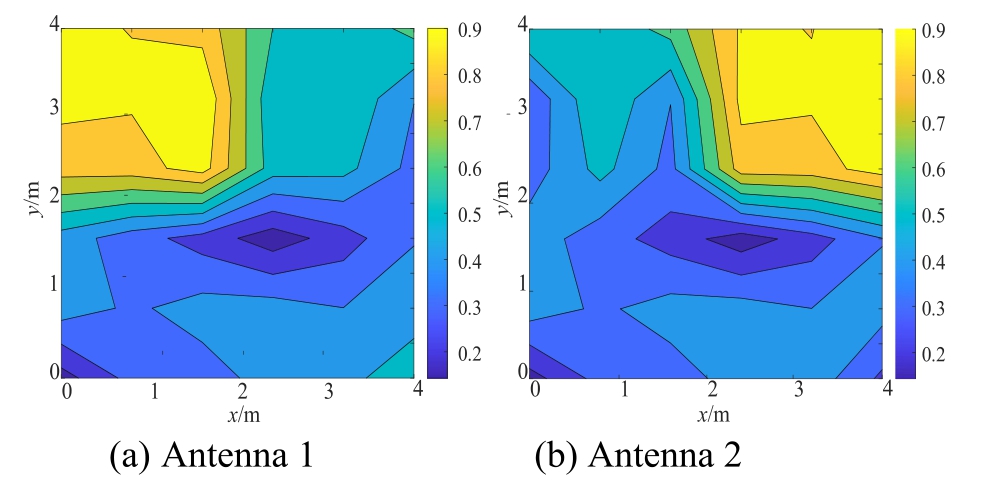
Fig.12.Electromagnetic signals received by different antennas.
3.2.2 Results of fingerprint establishment
Experiments were conducted in the Env1 environment,with the antenna deployment and arc fault locations illustrated in Fig.8.The EMR fingerprint maps for antennas positioned symmetrically relative to the arc fault were generated, as shown in Fig.12.The horizontal and vertical axes represent the distance between the arc fault and the antenna, while the color scale indicates the received Erms signal strength at the corresponding antenna.The signal intensity values are normalized within the range 0-1.As demonstrated by the fingerprint maps of different antennas, the Erms strength exhibits an increasing trend as the distance between the arc fault and the antenna decreases.This phenomenon,however,is subject to minor discrepancies in EMR signal distribution caused by the slight inclination of actual PV panels, resulting in non-perfectly symmetrical fingerprint maps.Nevertheless, the overall patterns remain consistent with the fundamental propagation characteristics of EMR signals.
These results demonstrate that the fingerprint maps can effectively capture the spatial characteristics of the test site[35].Nevertheless, metallic obstacles, ground reflections,and other environmental factors may introduce interference,leading to signal fluctuations and irregular variations in the received EMR signals.
3.3 Visual analysis of model features
The proposed MKDANN model demonstrates improved adaptability to distribution discrepancies between source and target domains.However, it still faces limitations in interpretability and feature-level effectiveness due to its inherent ‘‘black-box” nature.To visualize and evaluate the extracted features, this study employs two methods: local interpretable model-agnostic explanations (LIME) [36] and t-distributed stochastic neighbor embedding (t-SNE) [37].These techniques enable a feature-level interpretability and effectiveness analysis of the model.LIME is a model-agnostic interpretability method that explains individual predictions by constructing local surrogate models, thereby providing insight into the model’s local behavior.In this study, we selected 30 arc fault samples under varying environmental conditions and locations from each of the 16 arc fingerprint regions(i.e., PV module regions), totaling 480 samples, for LIME-based interpretability analysis.Specifically,for each region Ri, let the sample set be Si={x1,x2, ,xn}, and let each sample have a top-Z high-contribution feature set T(xj).Then, the ECS of region Ri is defined as the minimal feature set satisfying the condition,it ensures that for every sample in the region, at least one of its top-Z features is included in the ECS.
Given the richness of the extracted feature space (128 dimensions per sample), we select the top-10 most contributive features from each sample as candidates for constructing a minimal explanation coverage set (MECS)—a minimal, yet representative and complete subset of features for each region.The MECS results are presented in Table 4,where‘‘F”denotes a feature and the number represents the specific feature index.As shown in Table 4,most fingerprint regions have fewer than five features in their MECS, with only Region 10 exceeding this count.This indicates that the model exhibits concentrated feature perception in most regions, reflecting good stability and regularity.Notably, neighboring fingerprint regions (e.g.,Regions 3 and 4,Regions 15 and 16)show a certain degree of similarity in their MECS,suggesting the model captures spatially continuous feature patterns across adjacent fault regions.
Regions 2, 5, and 6 from Fig.8 were selected for visualization analysis, with Regions 5 and 6 being adjacent.Fig.13 presents the quantified feature attribution results obtained using the LIME algorithm under different irradiance conditions,where red indicates positive contributions and green indicates negative contributions.Fig.13(a) and Fig.13(b) correspond to the interpretability results when an arc fault occurs in Region 5 under high and low irradiance conditions,respectively.Both cases exhibit consistenthigh-contribution features, demonstrating the model’s strong feature stability within the same region.Fig.13(c)shows the result for a location at the edge of Region 6,adjacent to Region 5.There is partial overlap in highcontribution features between the two regions, which may be attributed to a spatial‘‘edge effect”caused by their physical proximity.Despite the partial feature similarity,the model is still able to accurately identify the fault location, validating its localization accuracy and robustness.Fig.13(d) presents the feature contributions for Region 2.Due to its spatial distance from Regions 5 and 6, the key features differ significantly, further confirming the model’s strong spatial feature discrimination ability.This capability effectively supports accurate identification of arc fault locations.
Table 4 MECS for fault regions.
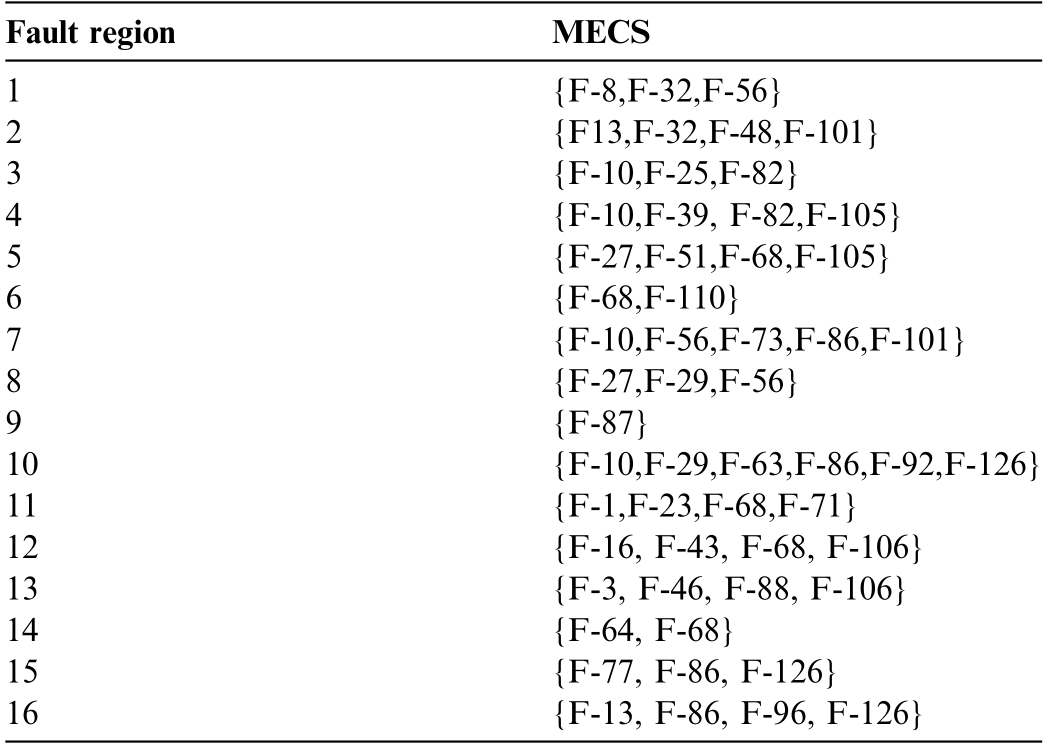
Fault regionMECS 1{F-8,F-32,F-56}2{F13,F-32,F-48,F-101}3{F-10,F-25,F-82}4{F-10,F-39, F-82,F-105}5{F-27,F-51,F-68,F-105}6{F-68,F-110}7{F-10,F-56,F-73,F-86,F-101}8{F-27,F-29,F-56}9{F-87}10{F-10,F-29,F-63,F-86,F-92,F-126}11{F-1,F-23,F-68,F-71}12{F-16, F-43, F-68, F-106}13{F-3, F-46, F-88, F-106}14{F-64, F-68}15{F-77, F-86, F-126}16{F-13, F-86, F-96, F-126}
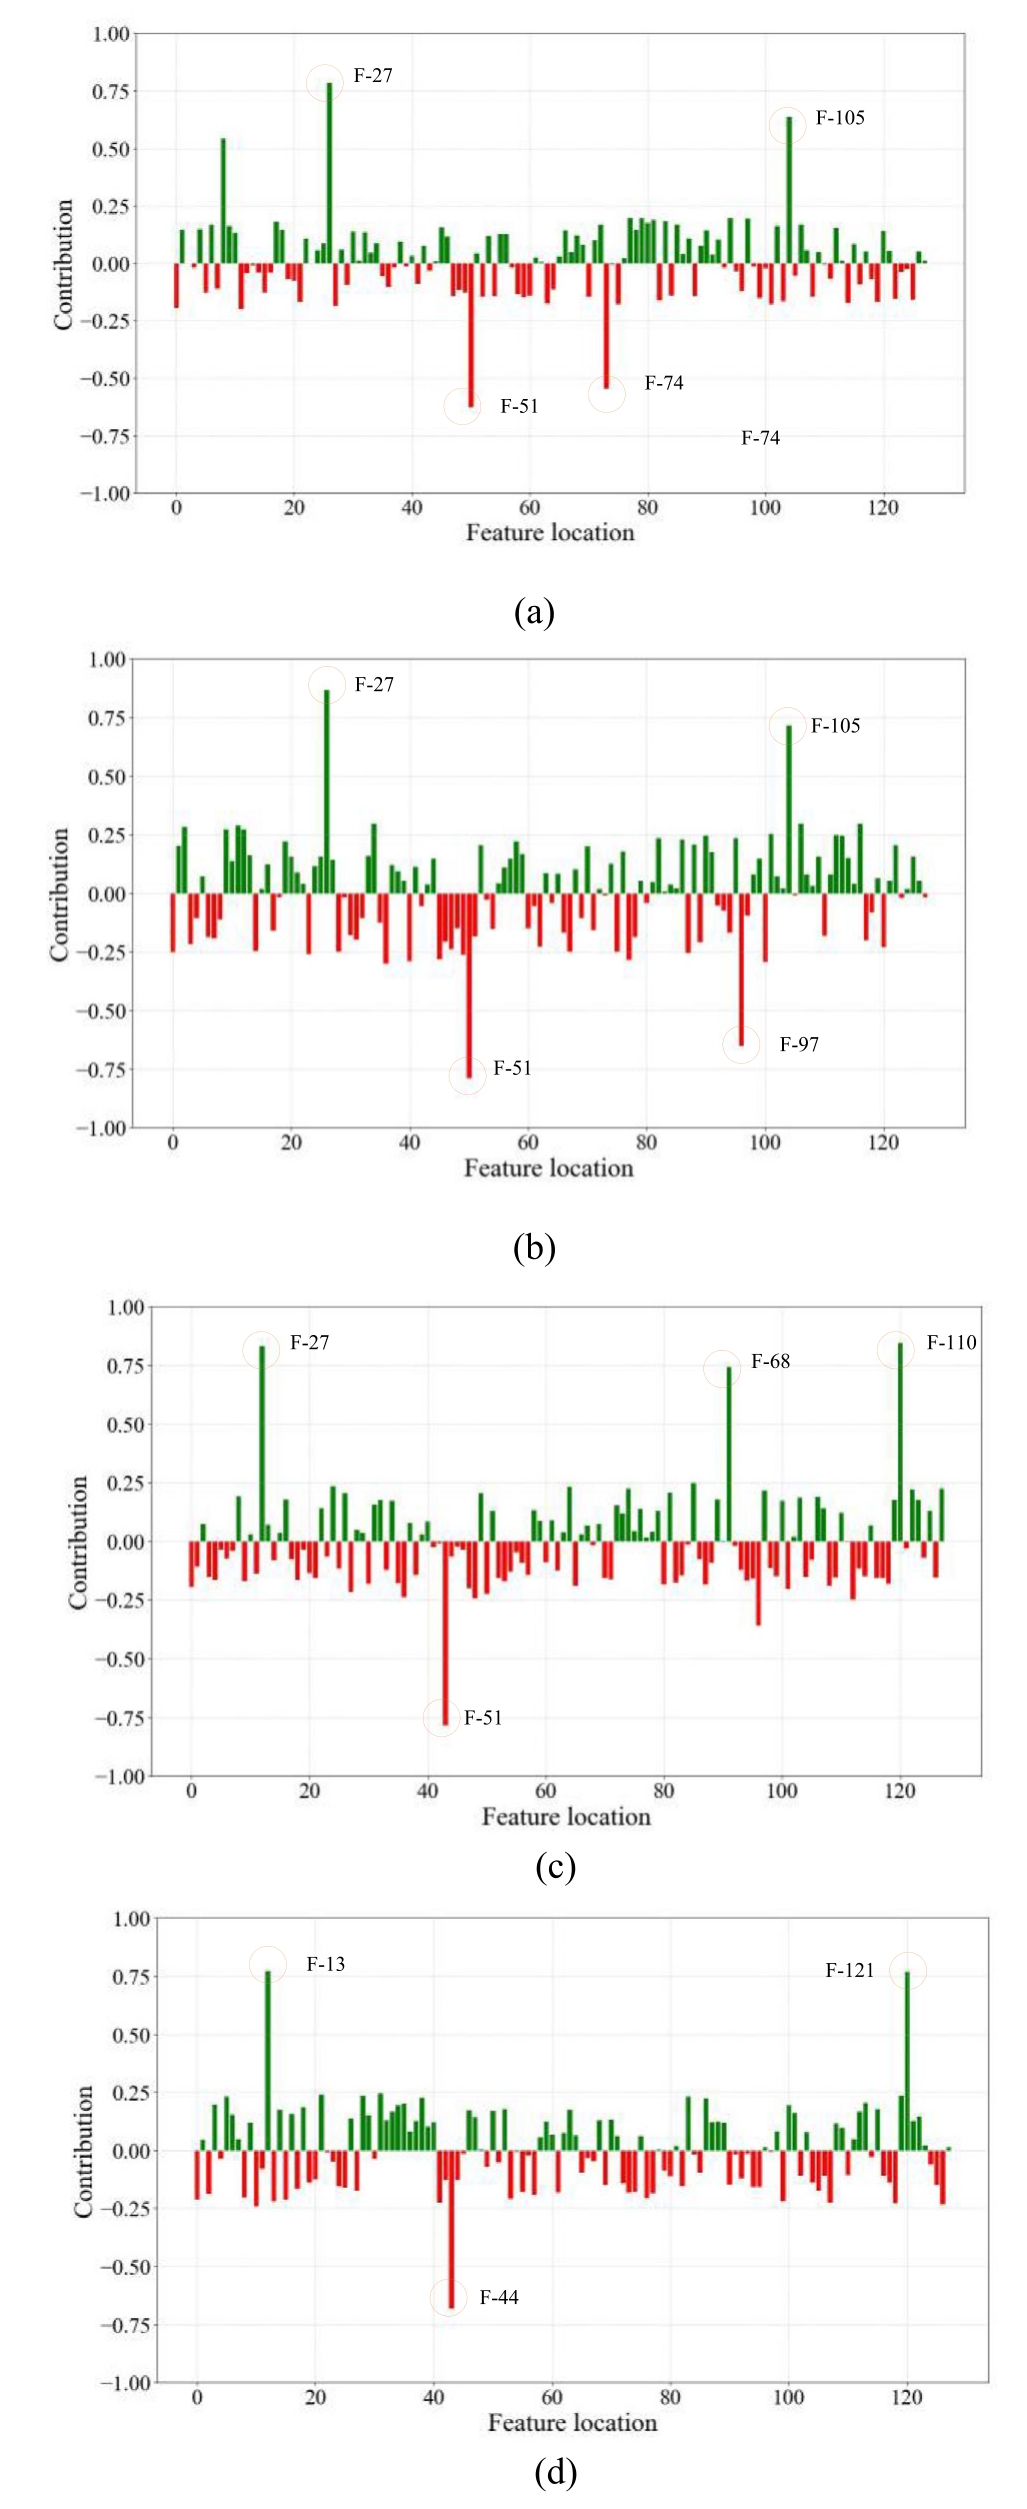
Fig.13.Contribution of shared features extracted by MKDANN.(a)High irradiance in Region 5;(b) Low irradiance in Region 5; (c) High irradiance in Region 6; (d) High irradiance in Region 2.
The t-SNE is a nonlinear statistical technique that maps high-dimensional data into a low-dimensional space,where the distances between objects reflect their similarity in the original space[38].Fig.14 presents the dimensionality reduction and visualization results obtained using the t-SNE algorithm for features extracted from Regions 2, 5,and 6 under different domains.In the plots,different colors represent arc fault samples from different regions, while different shapes indicate the domain to which each sample belongs.As shown in Fig.14(a), the features extracted by the original DANN model exhibit a certain degree of clustering across domains, but noticeable distribution shifts remain, and some samples show limited feature overlap across domains.In contrast, Fig.14(b) demonstrates that,after introducing the MK-MMD mechanism, the feature distributions across domains become more compact and consistent, indicating that this mechanism effectively enhances the model’s ability to adapt to cross-domain distribution discrepancies.Additionally, due to the physical proximity between Regions 5 and 6,a degree of boundary overlap exists, which leads to partial convergence of their features in the spatial embedding.Nevertheless,the model is still able to accurately distinguish samples from these two regions, further validating its localization accuracy and discriminative capability in complex spatial scenarios.In summary, by combining LIME and t-SNE for feature interpretation and effectiveness analysis of the MKDANN model, the discriminative mechanism and cross-domain adaptability of the model in fault localization tasks can be thoroughly revealed.Together, the two methods demonstrate that the model exhibits strong stability in local discrimination and is capable of extracting domaininvariant yet discriminative features even under interdomain distribution shifts.
3.4 Analysis of positioning results and influencing factors
3.4.1 Result of positioning
Experiments were conducted under the six different environments described in Section 3.1.2,and the proposed algorithm was executed to obtain the localization accuracy, as shown in Table 5 and Fig.15.
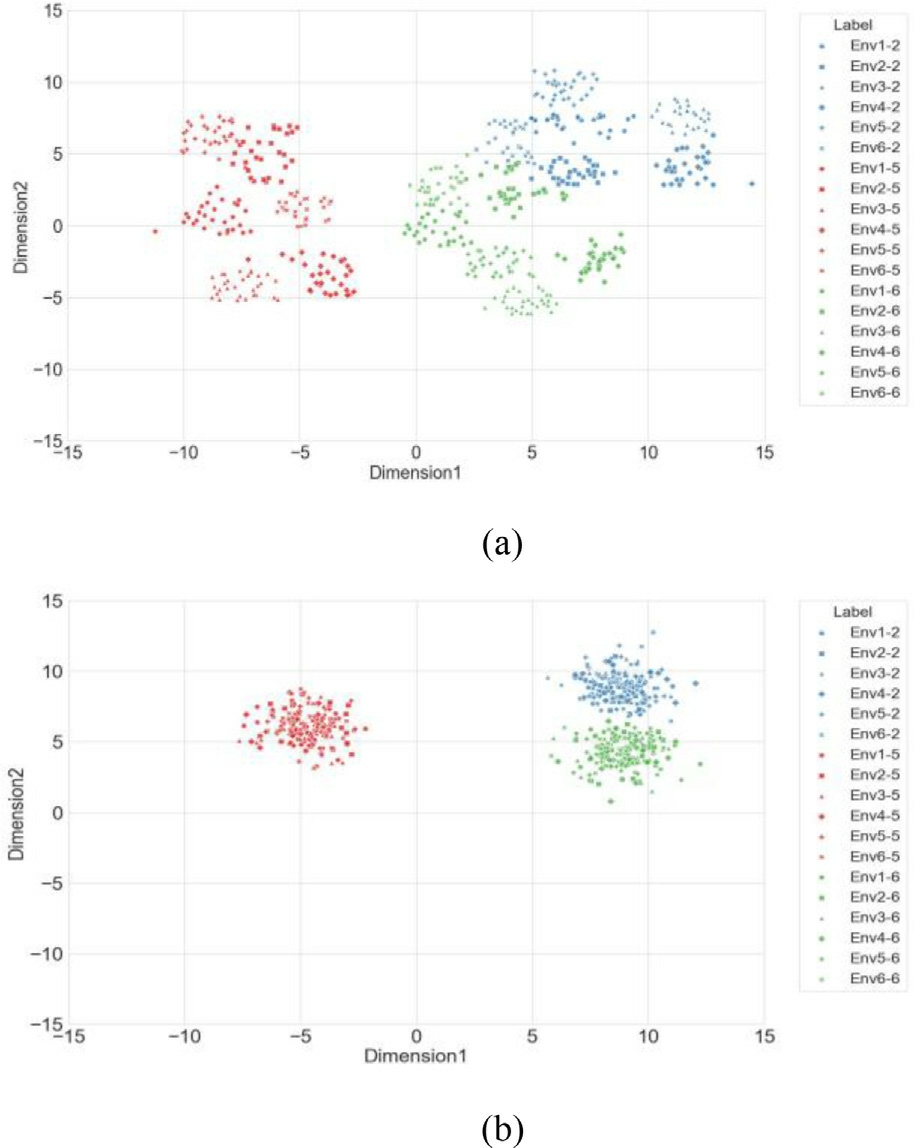
Fig.14.Visualization of features extracted by the model.(a) using DANN only;(b) using MKDANN.
In contrast to all other environments containing 25 fingerprint categories, Env3 comprises 16 fingerprint categories.The mean localization error was calculated for each environment, with a localization accuracy of 0.263 m, and the standard deviation remained at a relatively low value, demonstrating good stability across different environments.Notably, during domain adaptation from Env1 to Env2, the model achieved peak fingerprint localization accuracy at 99.3%, demonstrating strong adaptability despite metallic obstacles altering the electromagnetic environment under PV arrays.For the transition from Env1 to Env3, although the accuracy slightly dropped to 98.5%, the model demonstrated strong device-invariance,indicating that fingerprint map information reflecting signal intensity remains unaffected by changes in the antenna gain-distance relationship.As a result,the model achieved robust localization performance across different hardware settings.When adapting to Env4 simulating a different PV station,significant environmentalshifts necessitated continuous learning for new data distribution adaptation, leading to an expected accuracy reduction.Notably, the MKDANN algorithm maintained 95%accuracy, while still exhibiting exceptional crossenvironment transfer capability.The key challenge in Env5 was the presence of a rotating motor as an interference source, emitting electromagnetic waves that overlapped with the arc fault EMR spectrum.Despite this external interference, the model successfully captured the core data features, achieving a 96.7% localization accuracy.In Env6, fluctuating weather conditions slightly attenuated the EMR signals.However,this impact was relatively minor.Thanks to the online adaptation capability of the SPA algorithm, the model effectively mitigated this effect, maintaining a 98% localization accuracy.
Table 5 Positioning error and standard deviation in different environments.

Env1Env2Env3Env4Env5Env6 Average error/m0.1170.1380.1890.5180.3490.268 SD/m0.3900.4270.6510.9570.7160.703
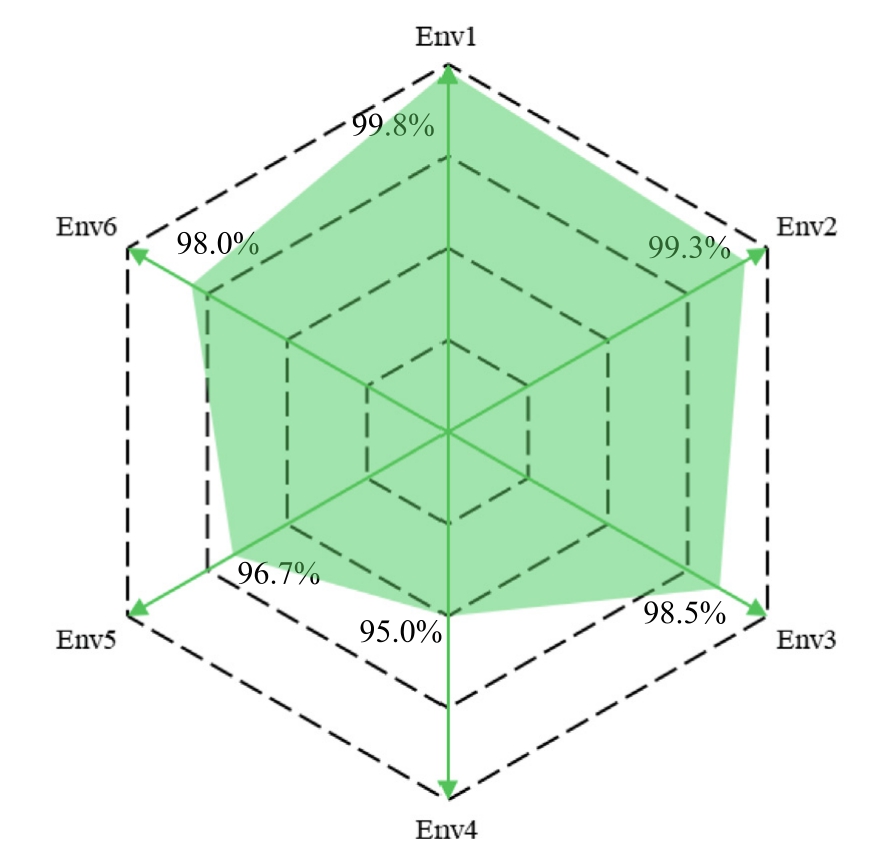
Fig.15.Positioning accuracy in different environments.
3.4.2 Impact of domain fingerprint ratios
In the transfer learning framework, the quantitative ratio of the source domain to the target domain directly affects the cost structure of the model.The source domain usually has an adequate number of samples,while the target domain has a long cycle to obtain labeled data and a relatively scarce number of samples.The domain fingerprint ratio represents the ratio of fingerprint quantities between different domains.In the target domain environment Env3, the model was tested using different numbers of fingerprints, while keeping the fingerprint quantity in the source domain Env1 unchanged.The relationship between the domain fingerprint ratio and localization accuracy is summarized in Table 6.
Table 6 Positioning accuracy under different domain fingerprint ratio.

Ratio/%2050100150200 Accuracy/%83.687.593.995.692.8 SD/m0.9390.8550.7320.6130.709
As shown in Table 6,the model maintains good performance in terms of localization accuracy and stability across different domain fingerprint ratios.As demonstrated in the table, where the target-to-source fingerprint ratio is set at 1:5, the localization accuracy attains 83.6%,thereby indicating that the model preserves high precision even with constrained target domain samples.Notably,when increasing the fingerprint ratio to 150%, peak accuracy of 95.6% is achieved, which demonstrates that algorithm performance can be substantially enhanced through moderate expansion of target domain fingerprint quantity.However, when the ratio is further increased to 200%, the accuracy drops to 92.8%.This decline is likely due to the fact that as the number of fingerprints increases,the interference from noise also grows, and an excessive number of unlabeled fingerprints introduces training disturbances, ultimately reducing the localization accuracy.Additionally, an excessive amount of data also increases the computational cost for training and signal processing,thereby reducing the overall efficiency of the model.Therefore, a larger number of samples does not necessarily lead to better performance; instead, maintaining an appropriate domain fingerprint ratio is crucial.A domain fingerprint ratio of 150% represents a suitable balance for the model, as it ensures satisfactory performance while controlling data acquisition costs, thereby providing a practical basis for decision-making in real-world engineering deployments.
3.4.3 Influence of antenna array configuration
In arc fault localization methods based on EMR signal acquisition via antenna arrays, the positioning accuracy is closely related to the configuration of the antenna array.To validate the effectiveness of the proposed fourantenna array in this study,comparative experiments were conducted across various antenna quantities and structural arrangements.The naming convention used designates the number of antennas as the initial digit,followed by the letters T, R, or D to represent triangular,rectangular, and diamond-shaped layouts, respectively.For example,‘‘4D”refers to a diamond-shaped configuration with four antennas.These configurations are illustrated in Fig.16.
The localization errors corresponding to different antenna layouts are summarized in Table 7.Among them,the 4R and 5R layouts exhibited comparable performance,both outperforming the 3 T and 4D configurations.From a structural perspective, a four-antenna configuration enables a more balanced spatial geometry, such as rectangular or diamond-shaped arrangements.This structure facilitates the generation of stable and distinctive EMR signal fingerprints, thereby improving the robustness of pattern matching.Compared to a three-antenna system,four antennas provide a notable advantage in terms of feature dimensionality and spatial resolution.While a fiveantenna configuration may offer marginal improvements in accuracy, the additional gain does not justify the increased cost, rendering it less cost-effective.Consequently, in practical deployment scenarios, considerations such as installation space, wiring complexity, and maintenance requirements make the four-antenna configuration a more feasible and flexible choice.It strikes an optimal balance between maintaining high localization accuracy and minimizing sensor deployment costs.
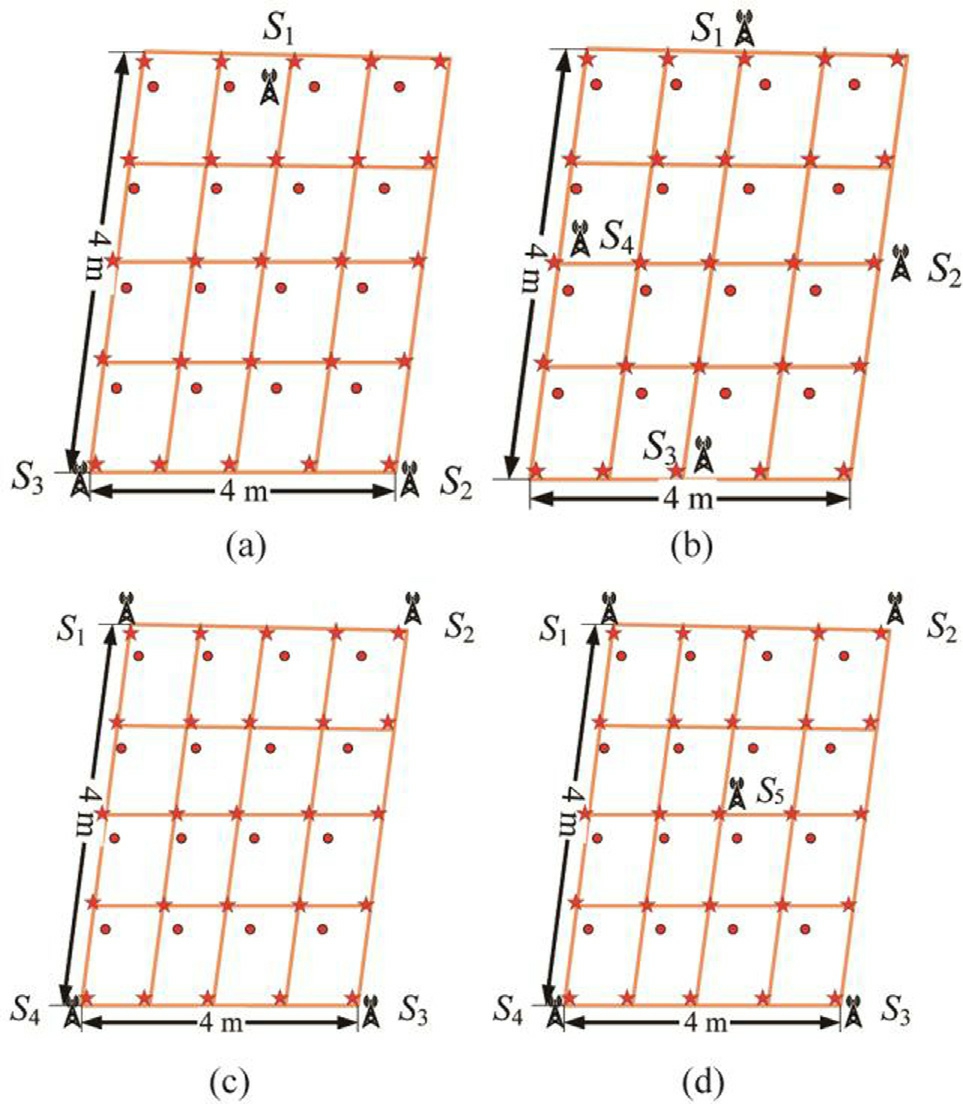
Fig.16.Antenna layout.(a) 4R; (b) 4D; (c) 5R; (d) 5D; (e) 6H.
Table 7 Positioning error under different antenna arrays.
Antenna array3T4D4R5R Average error/m1.1310.3180.1170.109
3.4.4 Effect of the size of the fingerprint reference point interval
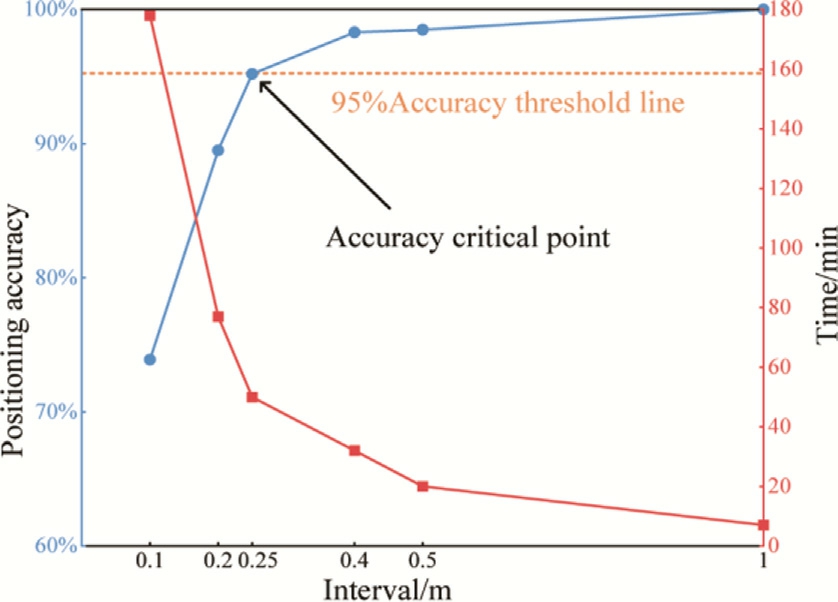
Fig.17.Relationship between fingerprint reference point interval and accuracy and training time.
The spacing between fingerprint reference points directly impacts the number of fingerprints, localization accuracy, and training duration.Therefore, in the target domain environment Env3, a series of different reference point intervals were set, including 0.1 m, 0.2 m, 0.25 m,0.4 m, 0.5 m, and 1 m, with the results shown in Fig.17.As illustrated in Fig.17,localization accuracy decreases as the fingerprint reference point spacing reduces, and the training duration increases accordingly.This phenomenon can be explained as follows:when the reference point interval is large, the distance between different fingerprints is greater,enabling the model to clearly differentiate features.However, when the reference point spacing is smaller, the fingerprint differences between adjacent points may be masked by noise, leading to deteriorated localization performance.Moreover, as the number of fingerprints increases, the corresponding training time is also prolonged.If considering only localization accuracy and training time, an interval of 1 m appears to be an ideal choice.However, considering the actual scale of PV panels,intervals of 0.4 m or 0.5 m might be more appropriate[10].At these intervals, the accuracy can be ensured while the training time remains manageable.When the interval is 0.25 m, the accuracy approaches the 95% threshold, so intervals smaller than 0.25 m should be avoided to prevent performance instability.Considering these factors, selecting an appropriate sampling point interval is crucial for enhancing model performance.
3.5 Comparative analysis
3.5.1 Validation of ablation experiment
To validate the effectiveness of the proposed algorithm,this study conducts comparative analysis on four algorithm configurations: (I) MKDANN-SPA fusion; (II)DANN-SPA fusion; (III) MKDANN standalone; (IV)SPA standalone;(V)DANN standalone.Notably,DANN shares identical feature extractor architecture with MKDANN for controlled comparison.All experimental environments listed in the table specifically represent target domain scenarios.As demonstrated in Table 8, comprehensive performance metrics including positioning accuracy, average error (in meters) and standard deviation(in meters) are quantitatively compared across these algorithm variants.
As shown in Table 8, Algorithm I performs the best across the five transfer environments,achieving the highest localization accuracy, a smaller standard deviation, and maintaining the average error within a relatively low range.In contrast, Algorithm II, which did not include substantial improvements to DANN, shows limited performance enhancement.Its localization accuracy is lower than that of Algorithm I, and the standard deviation is also higher.The localization accuracy of the remaining three algorithms shows a noticeable decline,and the model stability is weaker.This further underscores the necessity of integrating transfer learning with online learning, as their combined use maximizes the algorithm’s effectiveness.When comparing Algorithm III and Algorithm IV,a gradual decline in accuracy is observed as the target domain environment transitions from Env2 to Env4,along with an increasing relative error for both algorithms.This strongly supports the effectiveness of incorporating the MK-MMD loss function, which significantly reduces the distributional discrepancy between domains, particularly in environments with substantial variations.
In the first three environments, where the demand for transfer learning is more critical, Algorithms III and IV outperform Algorithm V.Conversely,in the last two environments, which pose a more stringent test for online learning, Algorithms III and IV demonstrate lower accuracy than Algorithm V.Crucially, Algorithm III consistentlyoutperformsAlgorithmIVacrossall environments.Additionally, Algorithm V exhibits lowerpositioning accuracy in Env5 compared to Env6, suggesting that electromagnetic interference in PV power stations has a greater impact on positioning performance than weather variations.Given this inevitability of meteorological fluctuations in outdoor PV systems,proactive identification and suppression of ambient electromagnetic disturbances becomes imperative when employing EMRbased positioning.
Table 8 Comparison of ablation experiment results.

ProjectEnviron-mentIIIIIIIVV Accuracy /%Env299.387.592.942.744.2 Env398.585.191.161.233.7 Env495.081.288.225.727.6 Env596.782.389.230.124.1 Env698.084.890.847.247.2 Average error/mEnv20.1830.5690.4471.4381.566 Env30.2640.5920.4731.2131.946 Env40.4120.6730.5622.0461.976 Env50.3650.6450.5381.9352.066 Env60.2910.6370.5011.3271.561 SD/m0.3050.5160.6441.7131.954
3.5.2 Comparison with other literature algorithms
Existing studies, such as [8,9], have primarily focused on using EMR signals for locating PV DC arc faults.The core methodology in these studies is based on estimating the distance between the arc fault point and the antenna array,whereas the method proposed in this paper determines fault locations using a fingerprint-matching approach.A comparison of the results is presented in Table 9.
Reference [8] conducted experiments in an enclosed space, neglecting the influence of environmental factors on positioning accuracy.Due to the high propagation speed of electromagnetic waves, precise signal acquisition equipment is required,and the computed positioning coordinates are highly sensitive to minor deviations in time delay estimation.Despite these challenges, the study successfully achieved spatial localization of arc faults, with a minimum positioning error of 0.352 m.Reference [9]accounted for the effect of irradiance on EMR signals and utilized a dual-antenna setup in a grid-structured PV array, achieving a positioning accuracy of 0.306 m.However, this study did not extensively analyze the performance of the positioning algorithm under different environmental conditions,nor did it explore potential electromagnetic interference.While the method proposed in this paper also operates at a relatively low sampling rate but improves positioning accuracy to 0.263 m by employing a four-antenna array.Through synergistic integration of transfer learning with online adaptation mechanisms,the framework demonstrates systematic evaluation across multi-domain environments and interference scenarios,thus validating its superior localization capability.
3.6 Online testing and evaluation of the algorithm
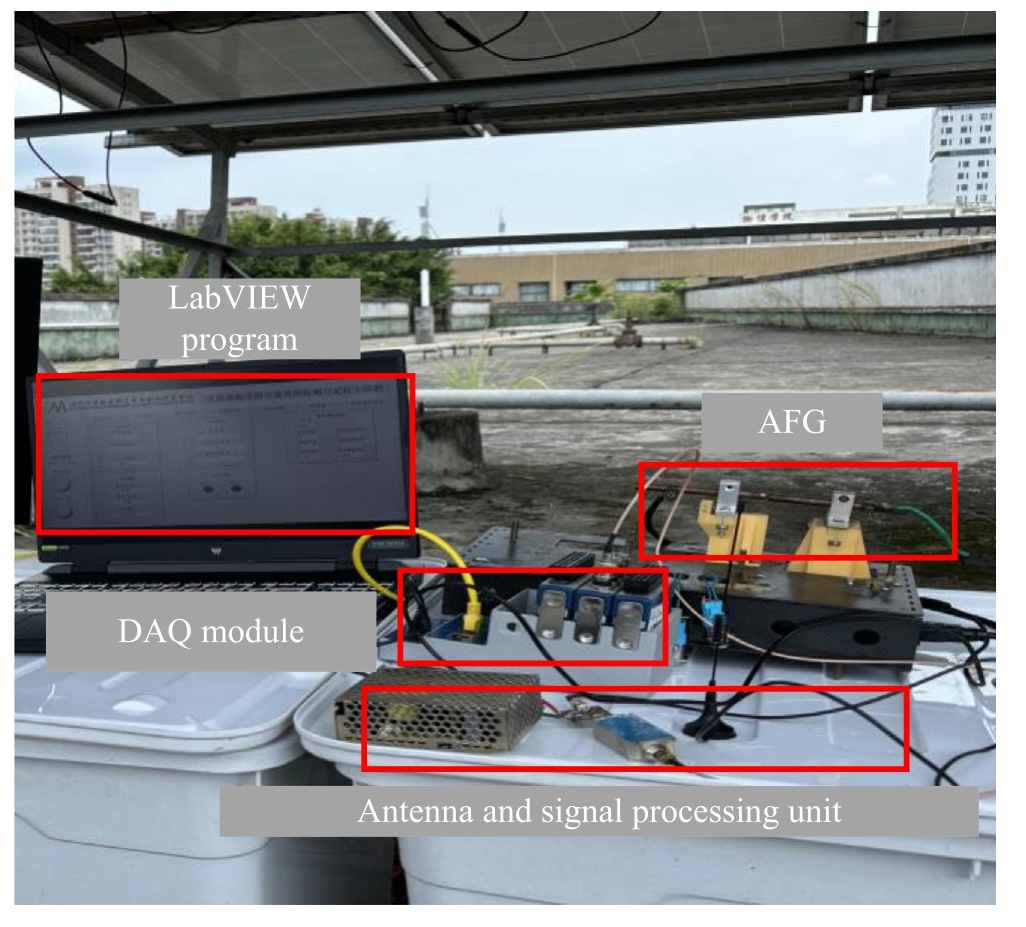
Fig.18.Online testing platform.
To validate the online diagnostic performance of the proposed arc fault localization algorithm, a physical testing platform was constructed,as illustrated in Fig.18.This platform utilizes a data acquisition module from national instruments(NI),integrated with an upper-computer software developed in LabVIEW, to enable real-time data acquisition and arc localization functionality.The data acquisition module consists of a cDAQ-9185 chassis and a NI-9220 data acquisition card.When an arc fault occurs,the antenna array captures the emitted EMR signals,which are then processed by a signal conditioning unit composed of a power amplifier and a BPF.The conditioned signals are input into the data acquisition module and transmitted via Ethernet to the upper-computer.The localization algorithm is implemented in Python and called by the LabVIEW program through scripting integration.Arc faults at various locations were simulated under six different test scenarios, as described in Table 3.The proposed algorithm achieved an average localization accuracy of 94.7%,with a mean localization error of 0.328 m and an average response time of 3.594 s, demonstrating strong performance.These results further confirm that the proposed method can achieve accurate and rapid online localization even when deployed on an engineering prototype,fulfilling the dual requirements of high precision and strong generalizability.
Table 9 Comparison of different positioning algorithms.

Compare contentRef.[8]Ref.[9]Proposed method MethodTDOADistance EstimationFingerprint Matching Environmental factorsIrradianceIrradiance + Temperature Equipment requirementsHighLowLow Anti-interference capabilityStrong Positioning accuracy0.352 m0.306 m0.263 m
3.7 Analysis of fingerprint database update patterns
Over time, the environment in which the fingerprint database is constructed undergoes significant changes,thereby creating discrepancies between the test data and the original dataset, which in turn leads to increased positioning errors [39].When the error exceeds a predefined threshold, neither transfer learning nor online learning alone can effectively adjust the model.Therefore, timely updates to the electromagnetic fingerprint database become crucial.This section explores the issue of fingerprint database updates.
Experiments were conducted at different time points(June 7, August 4, October 23, and November 10 of 2023, as well as January 5 and March 21 of 2024).By employing Env1 as the source domain and Env6 as the target domain,the algorithm was executed under five distinct update strategies, with the experimental configurations illustrated in Fig.19.
The yellow curve represents the scenario where the fingerprint database is updated immediately after each experiment, thereby ensuring continuous alignment with the current environment.Furthermore, the green curve represents updates at specific time points (November 10, 2023,and March 21,2024)to capture cumulative environmental changes.The red curve follows the same update schedule but retains the fingerprint database from November 10,2023, during the experiment on March 21, 2024, to examine the impact of an outdated fingerprint database.The purple curve represents the case where the fingerprint database is not updated throughout the entire period, demonstrating the potential performance degradation due to long-term neglect.Finally, the blue curve represents the worst-case scenario,where neither the fingerprint database is updated nor the SPA algorithm is used,highlighting the impact of the absence of both updates and adaptive optimization.Each curve represents the results obtained after re-running the algorithm under the respective conditions.
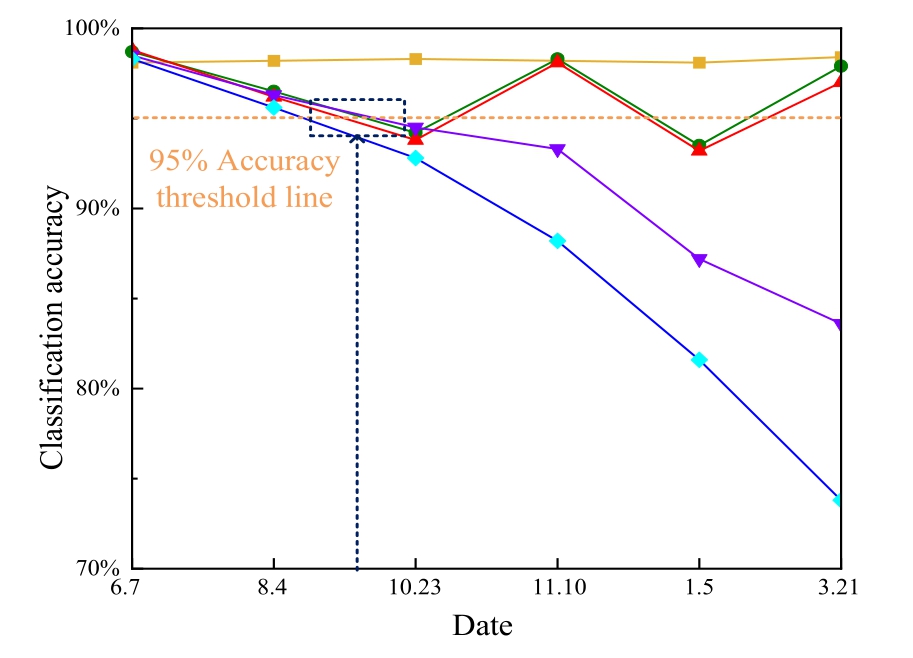
Fig.19.Changes in positioning accuracy after updating fingerprint database in different modes.
As shown in Fig.19,the yellow curve maintains a stable accuracy of approximately 98% due to the timely updates of the fingerprint database.While the green curve exhibits accuracy degradation when using outdated fingerprints, it nevertheless demonstrates rapid recovery post-update.Notably, the red curve, which relies on the fingerprint database from November 10, 2023, during the March 21,2024, experiment, shows slightly lower accuracy than the green curve.Theoretically, a more significant accuracy drop would be expected after four months, but this was not observed in practice.A detailed analysis revealed that these two time points correspond to autumn and spring,respectively.Although separated by several months, the environmental conditions (irradiance and temperature)remain relatively similar.On November 10,2023,the temperature ranged from 14 to  , and irradiance ranged from 364 to 729 W/m2, whereas on March 21, 2024, the temperature ranged from 9 to
 and irradiance ranged from 300 to 949 W/m2.Despite significant fluctuations in irradiance and temperature within a single day,the overall variation patterns were similar,resulting in only minor differences in positioning accuracy.The significant declines observed in the blue and purple curves highlight the necessity of timely fingerprint database updates.Furthermore,this comparison demonstrates the effectiveness of the SPA algorithm in dynamically adjusting to temporal changes in the fingerprint database.
4 Conclusions
This study proposes a DC arc fault localization method for PV arrays by integrating MKDANN and SPA.The performance of the proposed method is experimentally validated under varying environmental conditions, and the following conclusions are drawn:
1) By analyzing the time-frequency characteristics of arc EMR signals,representative features are selected as positioning signal sources.A fingerprint matching method is employed to achieve localization,enabling more accurate positioning even under low sampling rates.The proposed method achieves an average localization error of 0.263 m, demonstrating overall performance superior to comparable localization approaches.
2) The proposed localization model, which integrates MKDANN with SPA and incorporates both online learning and transfer learning strategies, achieves a positioning accuracy consistently above 95% with a standard deviation of 0.305 m.The model exhibits excellent localization performance and stability across different equipment scenarios and under various environmental disturbances.
Although the implementation of global signal sensing approaches may introduce additional hardware costs associated with sensor deployment, sensor-based precise localization techniques offer significant engineering value and practical relevance in scenarios with stringent safety requirements or highly concealed arc faults.For instance,in BIPV systems, many PV modules are installed on rooftops or building facades, with cable routing often hidden beneath the panels.In the event of an arc fault, pinpointing the fault location becomes exceptionally challenging.By integrating sensors with existing module-level power optimizers,rapid localization of arc faults can be achieved,thereby addressing the dual challenges of difficult fault detection and high safety demands in real-world applications.Considering the attenuation of EMR signals, this study only validates the localization performance within a 4 m4 m area.For applications in medium to large scale PV stations, the deployment of additional sensors would be required, necessitating further investigation into sensor coordination and integration strategies.In realworld complex environments, factors such as multipath effects, electromagnetic interference, and terrain obstructions not only limit the strength of EMR signals but also pose greater challenges to the model’s transferability and adaptability.Future work will focus on extending the robustness evaluation of the proposed algorithm under more complex conditions and enhancing the model’s interpretability in identifying critical features.Additionally,integrating multi-physics detection methods—such as combining ultrasonic, voltage, and current signals—could facilitate the evolution and refinement of the model to better meet practical deployment requirements.
CRediT authorship contribution statement
Chenye Huang:Writing-original draft.Wei Gao:Writing - review & editing, Project administration, Conceptualization.Chenhao Huang: Software, Data curation.Liangshi Lin: Methodology.
Declaration of competing interest
The authors declare the following financial interests/personal relationships which may be considered as potential competing interests: Liangshi Lin is currently employed by Xiamen Power Supply Company of State Grid Fujian Electric Power Co., Ltd.The other authors declare that they have no known competing financial interests or personal relationships that could have appeared to influence the work reported in this paper.
Acknowledgement
This work was financially supported in part by the Natural Science Foundation of Fujian, China, under Grant 2021J01633.
References
-
[1]
A.S.Jinan, M.Baraa, S.A.Muwafaq, et al., Hybrid MPPT approach using cuckoo search and grey wolf optimizer for PV systems under variant operating conditions, Global Energy Interconnect.5 (6) (2022) 627-644. [百度学术]
-
[2]
Y.Shen, J.Zhang, P.Guo, et al., Impact of solar radiation variation on the optimal tilted angle for fixed grid-connected PV array-case study in Beijing, Global Energy Interconnect.1 (4)(2018) 460-466. [百度学术]
-
[3]
S.Tang,Y.Wang,N.Qiao,et al.,Study on detection method of dc fault arc based on photovoltaic power generation system, Acta Energiae Solaris Sinica 44 (11) (2023) 31-39. [百度学术]
-
[4]
Q.Xiong, X.Liu, Z.Guo, et al., Arc fault detection and localization for photovoltaic system based on spectrum integration difference of currents, High Voltage Eng.47 (05)(2021) 1625-1633. [百度学术]
-
[5]
Y.Meng, H.Yang, et al., Arc fault localization based on timefrequency characteristics of currents in photovoltaic systems,Solar Energy 287 (2025) 113221. [百度学术]
-
[6]
Q.Xiong, W.Chen, S.Ji, et al., Review of research progress on characteristics,detection and localization approaches of fault arc in low voltage DC system, Proc.CSEE 40 (18) (2020) 6015-6027. [百度学术]
-
[7]
Y.Wang, Y.Zhang, F.Niu, et al., Characterization and measurement method of DC arc electromagnetic radiation for photovoltaic systems, Transac.China Electrotech.Soc.34 (14)(2019) 2913-2921. [百度学术]
-
[8]
Y.Wang, T.Ma, Y.Zhao, et al., Series dc arc-fault location method based on electromagnetic radiation delay estimation for photovoltaic systems, Transact.China Electrotech.Soc.38 (08)(2023) 2233-2243. [百度学术]
-
[9]
H.Jin,W.Gao,L.Lin,et al.,Photovoltaic array arc faults location method based on grid fingerprint matching, High Voltage Eng.50(02) (2024) 805-815. [百度学术]
-
[10]
S.Zhao,G.You,X.Hou,et al.,A spatial location method for DC series arc faults based on RSSI and Bayesian regularization neural network, IEEE Sens.J.21 (24) (2021) 27868-27877. [百度学术]
-
[11]
K.Li, S.Zhao,Y.Wang,et al., A planar location method for DC arc faults based on RSSI and Bayesian regularization neural network, IEEE Trans.Instrum.Meas.69 (8) (2020) 5478-5487. [百度学术]
-
[12]
Z.Du, Z.Hao, P.Zhao, et al., Photovoltaic array arc faults location method based on grid fingerprint matching, Trans.China Electrotech.Soc.39 (03) (2024) 852-862. [百度学术]
-
[13]
J.Yang, C.Liu, J.Huang, et al., Convex solution for target localization in passive mimo radar using delay, doppler and angle measurements, Acta Electron.Sin.52 (06) (2024) 2091-2102. [百度学术]
-
[14]
Z.Li, L.Luo, J.Chen, et al., UHF partial discharge localization methodology based on RSSI fingerprinting, High Voltage Eng.44(06) (2018) 2033-2039. [百度学术]
-
[15]
S.Dhara, C.Koley, S.Chakravorti, et al., UHF sensors based localization of partial discharge sources in air-insulated electrical substation using TDOA and relative RSS information, IEEE Trans.Instrum.Meas.72 (2023) 1-9. [百度学术]
-
[16]
Y.Tian, M.Fu, Applicability of TDOA estimation methods for locating radiated EMI source in multipath environment, Trans.China Electrotech.Soc.30 (S2) (2015) 189-194+200. [百度学术]
-
[17]
H.Wu,Z.Wan,W.Xu,et al.,MUSIC Algorithm for partial discharge location in substation based on utral high frequency directional antenna array,High Voltage Eng.48(08)(2022)3240-3249. [百度学术]
-
[18]
F.Wu, L.Luo, H.Wang, et al., Rssi-power-based direction of arrival estimation using maximum likelihood estimator and antenna array,Transac.China Electrotech.Soc.35(12)(2022)2689-2697. [百度学术]
-
[19]
X.Ren, S.Wang, W.Zhao, et al., Universal federated domain adaptation for gearbox fault diagnosis: A robust framework for credible pseudo-label generation,Adv.Eng.Inform.65(2025)103233. [百度学术]
-
[20]
X.Wang, H.Jiang, M.Mu, et al., A dynamic collaborative adversarial domain adaptation network for unsupervised rotating machinery fault diagnosis, Reliab.Eng.Syst.Safety 255 (2025)110662. [百度学术]
-
[21]
J.Yan, Y.Cheng, F.Zhang, et al., Multimodal imitation learning for arc detection in complex railway environments, IEEE Trans.Instrum.Meas.74 (2025) 1-13. [百度学术]
-
[22]
Y.Dong, H.Jiang, Y.Liu, et al., Global wavelet-integrated residual frequency attention regularized network for hypersonic flight vehicle fault diagnosis with imbalanced data, Eng.Appl.Artif.Intel.132 (2024) 107968. [百度学术]
-
[23]
M.Mu,H.Jiang,X.Wang,et al.,A task-oriented theil index-based meta-learning network with gradient calibration strategy for rotating machinery fault diagnosis with limited samples, Adv.Eng.Inf.62 (PC) (2024) 102870. [百度学术]
-
[24]
Y.Dong, H.Jiang, Z.Wu, et al., Digital twin-assisted multiscale residual-self-attention feature fusion network for hypersonic flight vehicle fault diagnosis, Reliab.Eng.Syst.Saf.235 (2023)106253. [百度学术]
-
[25]
X.Chen,W.Gao,C.Hong,et al.,A novel series arc fault detection method for photovoltaic system based on multi-input neural network, Int.J.Electr.Pow.Energy Syst.140 (2022) 108018. [百度学术]
-
[26]
G.Qian, Standard analysis of UL 1699b ‘‘photovoltaic DC arcfault detection devices”, Electr.Energy Manag.Technol.09 (2019)71-75. [百度学术]
-
[27]
S.Lu, B.T.Phung, D.Zhang, A comprehensive review on DC arc faults and their diagnosis methods in photovoltaic systems,Renew.Sustain.Energy Rev.89 (2018) 88-98. [百度学术]
-
[28]
B.Chen, X.Chen, W.Xiao, et al., Multi-source domain transfer diagnosis method for rolling bearing faults under small samples,J.Electron.Measur.Instrument.36 (02) (2022) 219-228. [百度学术]
-
[29]
J.Chen, W.Du, H.Wang, et al., Location method of subsynchronous oscillation source in wind power system with VSC-HVDC based on adversarial transfer learning, Transac.China Electrotech.Soc.36 (22) (2021) 4703-4715. [百度学术]
-
[30]
E.Tzeng, J.Hoffman, N.Zhang, et al.Deep domain confusion:Maximizing for domain invariance, arXiv, arXiv: 1412.(2014)3474. [百度学术]
-
[31]
K.Long, C.Zheng, K.Zhang, et al., The adaptive fingerprint localization in dynamic environment, IEEE Sens.J.22 (13) (2022)13562-13580. [百度学术]
-
[32]
S.Matsyshima, N.Shimizu, K.Yoshida, et al., Exact online passive-aggressive algorithm for multiclass classification using support class, in: Proceedings of the 2010 SIAM International Conference on Data Mining, Society for Industrial and Applied Mathmetics, Columbus, USA, 2010, pp.303-314. [百度学术]
-
[33]
L.Xu, W.Yang, H.Tian, Channel interleaver design and performanceanalysisforultrasonicthrough-metal communication, J.Commun.43 (10) (2022) 1-11. [百度学术]
-
[34]
Z.Zhao,Y.Tong,J.Cui,Device-independent WIFI fingerprinting indoor localization model based on domain adaptation, J.Commun.43 (04) (2022) 143-153 (Zhao S, You G, Hou X, et al.(2021)). [百度学术]
-
[35]
Z.Li, L.Luo, G.Sheng, et al., Ultrahigh frequency partial discharge localization methodology based on compressed sensing,Transac.China Electrotech.Soc.33 (01) (2018) 202-208. [百度学术]
-
[36]
T.Marco,S.Sameer,et al.,‘‘Why should I trust you?”:explaining the predictions of any classifier, Proceedings of the 22nd ACM SIGKDD International Conference on Knowledge Discovery and Data Mining 10 (2016) 1135-1144. [百度学术]
-
[37]
L.Maaten, G.Hinton, Visualizing data using t-SNE, J.Mach.Learn.Res.9 (2008) 2579-2605. [百度学术]
-
[38]
G.Bai, T.Xing, W.Sun, et al., Unsupervised multiple-target domain adaptation for bearing fault diagnosis, Eng.Appl.Artif.Intell.154 (2025) 111063. [百度学术]
-
[39]
Y.Li, X.Sun, A highly robust indoor location algorithm using WIFI channel state information based on transfer learning reinforcement, J.Electron.Inform.Technol.45 (10) (2023) 3657-3666. [百度学术]
Fund Information

