Recommended articles:
-

-
Global Energy Interconnection
Volume 8, Issue 5, Oct 2025, Pages 778-789
Identifying time zones of power fluctuations method for photovoltaic power ramp rate optimization
Keywords
Abstract
Abstract Photovoltaic(PV)systems are being increasingly implemented in the grid,and their intermittent output fluctuations threaten the stability of the grid,thereby requiring effective power ramp control(PRRC)strategies.In this study,we proposed a power fluctuation identification method to optimize the PRRC strategy.The K-means++ cluster based on DTW used in this method, which clusters the historical PV power generation data into power curves corresponding to a specific weather type(sunny,cloudy,and rainy)in a time zone.Subsequently, wavelet decomposition is applied to discretize the power curves with extreme RR overrun to accurately identify the extreme fluctuation time zones.We conducted an analysis using minute-level data from a 100 kW PV plant in Arizona, which demonstrates that the proposed method can effectively identify high-risk periods.Weather patterns within the time zones were quantitatively identified using a weather probability model.A hardware-in-the-loop experimental platform was employed to validate two days of actual power data in Arizona, demonstrating the weather zoning accuracy of the method and the reasonableness of the control.The proposed methodology contributes significantly to PRRC strategy selection and parameter optimization(e.g.,ESS capacity storage allocation and APC power reserve ΔP) in different time zones and weather conditions.
0 Introduction
Solar energy is a clean and renewable resource,which is expected to replace the conventional fossil fuel-based energy production in the foreseeable future[1].The global photovoltaic(PV)generation is expected to increase significantly by 2023.The new PV installations in China will reach 95-120 GW, accounting for more than 30% of the global new PV installations, which are expected to reach 280-330 GW [2].As the number of large-scale PV plants increases, the share of PV in the overall energy grid increases.
Typically, the increasing penetration of PV systems causes grid instability owing to their intermittent nature[3].Large PV systems must maintain a smooth output without any abrupt changes.However, the intensity of solar irradiation is vulnerable to changes in the external environment.Consequently, it may fluctuate drastically over short periods with variations in the weather.The output power of the PV system varies significantly under different weather types, as shown in Fig.1.This inherent characteristic presents considerable risks to the safe and stable operation of the power system.Therefore, the analysis of the PV power fluctuation characteristics must consider different weather types.
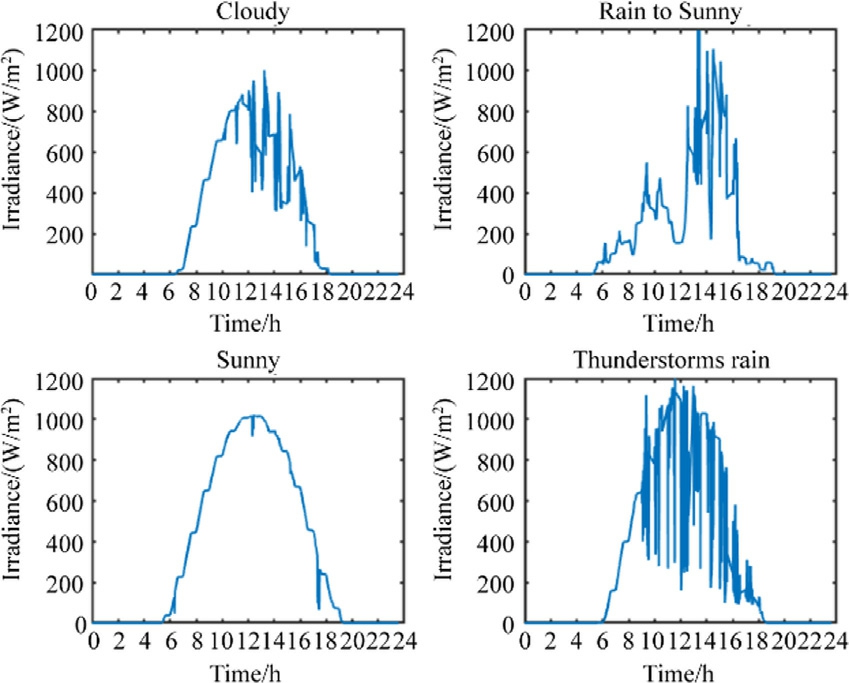
Fig.1.Solar irradiance in different typical weather types.
The high rate of change in solar irradiance can cause fluctuations in the PV systems, which significantly affect the stable operation of the power grid.Therefore, power ramp-rate (RR) limitations were introduced to the new grid codes in several countries [4].For example, the maximum allowable RR limitations can be defined as 10% of the PV capacity per minute in Germany and Puerto Rico[5].To reduce the high variation rate of the injected power to satisfy the RR limitation, several electricity regulators require power ramp control (PRRC) for large PV systems to minimize the negative impacts[6].Typically,PRRC can be realized using two methods: energy storage systems(ESS)or active power control(APC).The former typically employs batteries to smooth the power fluctuations [7,8].However, the first approach is limited by the high cost and limited lifetime.Additionally,integrating the ESS into the PV system increases the complexity of the entire system[9,10].Thus,the APC is an alternative solution to mitigate this problem.A power reserve control method was proposed for real-time Maximum power point estimation using curve fitting [11,12].Furthermore, a previous study proposed a convenient MPP estimation method using Lambertian functions for fast response [13].An FPPTbased PRRC strategy was also proposed, which reduces the cost and effectively controls the ramp rate rise and fall[14].However, because the intermittent fluctuations in the solar irradiance cause large power fluctuations, the RR control strategy must consider the PV power fluctuation time zones and fluctuation characteristics [15].
The most common method involves analyzing the stochastic characteristics of PV output using conventional mathematical statistics such as the mean, variance, and probability distribution [16-18].Research has also been conducted to evaluate the solar ramp rate correlations through simple radiation and wind measurements [19].However, these methods are cumbersome and timeconsuming, and their accuracy is largely unknown.Furthermore, the reference value for subsequent ramp rate control strategies is limited.
A more accurate and reliable characterization of the degree of power fluctuations can be realized by using artificial intelligence algorithms.For example, a time series generation method for PV power generation considering spatiotemporal correlation features was proposed in a previous study[20-22].Power fluctuation pattern recognition was achieved by using cloud feature extraction based on artificial intelligence algorithms [23,24].However, these methods increase the complexity of the algorithm implementation while improving the accuracy.Additionally,the high accuracy results obtained by such AI algorithms are more favorable for ultra-short-term power forecasting and power market strategy development, rather than the PRRC control strategy.
In recent years,clustering has been implemented to process data.This method reduces the amount of analysis and increases the accuracy by identifying hidden structures in the data, performing data compression, dimensionality reduction, and classification to extract useful information[25].However, in PV power analysis applications, highprecision power prediction models were established by using the clustering results of the long-term historical time series [26-29].Previous studies have not considered clustering to provide valuable reference information for the control strategy of PRRC.
In this study, we proposed a temporal clustering method by using wavelet decomposition.The proposed method categorizes the time zones where the power ramp rate is exceeded, along with the corresponding approximate weather types.
Utilizing the proposed method presents the following advantages:
The historical data can be processed without complex and accurate artificial intelligence algorithms, and seasonal disturbances were eliminated by using the proposed temporal clustering method.
The time periods when extreme weather occurs could be directly and accurately determined by approximating the power curves using wavelet decomposition and by incorporating probabilistic model calculations.
Calculating the results using the proposed method contributes significantly to PRRC strategy selection and parameter optimization(e.g.,ESS capacity storage allocation and APC power reserve ΔP)under different time zones and weather conditions.
1 Photovoltaic power fluctuations and ramp rates
PV is an intermittent energy source, which may cause voltage fluctuations, voltage increase, reverse power flow,voltage flicker,grid-side power fluctuations,and frequency fluctuations when connected to the grid.This negative effect is caused by variations in the solar radiation.The solar radiation represents time series data that fluctuates based on the days, hours, minutes, and sometimes even seconds.Additionally,rainfall,cloud movement,and variations in the weather conditions cause frequent changes in the solar radiation.
The adverse effects of PV output power fluctuations on the utility grid caused the network operators to implement ramp rate limits to control the fluctuations.For example,the Puerto Rico Electric Power Authority (PREPA) has implemented ramp rate limits on the PV generators to mitigate the negative impact on the utility grid[29].Equation(1) expresses the RR of the PV output power at a specific time instant,which can be defined as the change in the PV output power between two consecutive instances of time(‘i’ and ‘i 1).
RR can be positive (rising) or negative (falling), based on the PV output power [30].The RR of the PV output power must be maintained within the RR limit (in MW/min).This can be achieved by using the p.u value (actual value divided by the base value),and is the amount of output that can be increased or decreased per unit of time,reflecting the regulation capability and sensitivity of the unit [31,32].
For example, the most recommended RR limit for PV plant operators internationally is 10% of the rated PV capacity per minute to overcome the limitations of PV fluctuations on the utility grid.The commonly used RR limit for instantaneous ‘i’ PV output power is expressed as follows:
The time periods that do not satisfy this limit are defined as risky time zones that present the potential to exceed the power ramp rate limit.
Fig.2 depicts the continuous output power curve of PV for one week.It presents the following findings:
The maximum PV power varies significantly under different weather conditions.
The PV power fluctuation characteristics correspond only to the current weather state, which is typically independent of the previous weather state.
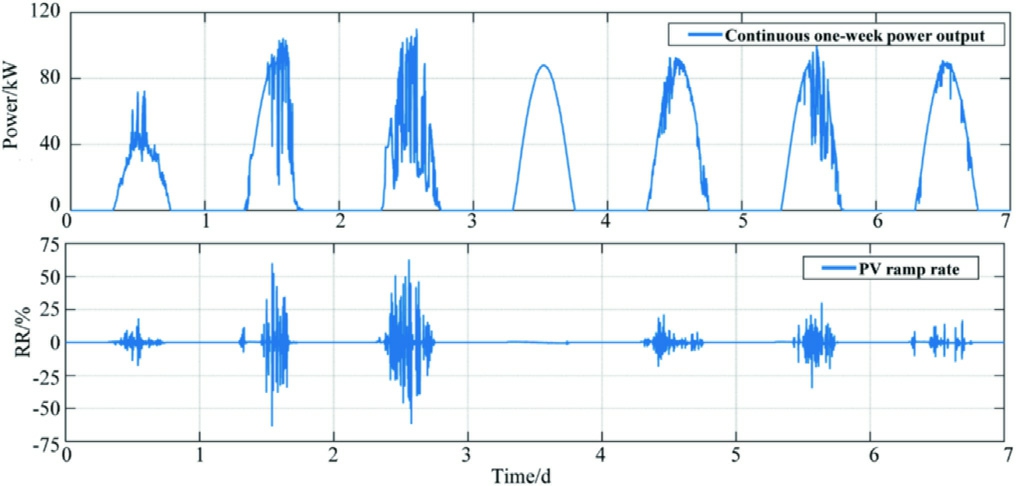
Fig.2.Sample daily power curve and daily instantaneous ramp rate under different weather at a location.
The time period during which the PV RR exceeds the limit varies based on the weather.
2 Photovoltaic power temporal clustering method
These findings demonstrate that different weather conditions can cause frequent changes in the solar radiation and large fluctuations in the PV output power, which can also cause RR overrun at different time zones.Therefore,a more comprehensive analysis and assessment of the more probable time periods of ramp rate overrun is required.To this end,we consider the use of long-term historical time series data with the corresponding temporal resolution for analysis.Furthermore,we employed temporal clustering methods to reduce the amount of analysis,while considering the accuracy of the time region.
Fig.3 depicts the specific research framework employed in this study.Firstly, the data are preprocessed (classification of the time zones),and the one-year time series lengthminute data are divided into 1-12 groups based on the month, and the daily data in each group are then divided into 24 time intervals.
Subsequently, the daily power time series in the group were clustered by K-means++ based on dynamic time warping (DTW) in time intervals of 24 h to form three clusters.Consequently, weather label assignment is performed based on the high and low ordering of the average power in the center of mass in each time interval.To approximate the power values under the three typical weather conditions,we defined high power as sunny,medium power as cloudy, and low power as rainy.
The hourly center-of-mass curves were then spliced into all-day curves to obtain the power curves that represent the three typical weather fluctuations in each month.We performed RR calculations and statistics on the clustered data for each month to identify the dates and time zones of extreme power fluctuations.Additionally,we performed wavelet decomposition on their daily power curve samples.

Fig.3.The research framework for time zones identification of power fluctuations.
Lastly,the daily power curves obtained from its wavelet decomposition are compared with the typical weather power curves formed by clustering for that month.Furthermore, we established a probability model to analyze the approximate weather types for each time period,thereby providing an Optimization method for the control strategy of PRRC.
2.1 K-means++ clustering based on DTW
The features of the zones to be clustered must be identified to implement the clustering algorithm.Because the zones with similar patterns must be clustered together,the data points of each PV generation zone must be considered as features of that zone.Thus,PV generation zones with close power values at each time period are combined within the same cluster.
K-means is a feasible clustering algorithm that can be used to group PV power time periods.However, each power curve sample is a time series,and the center of gravity must capture the dynamic pattern of the series,instead of the static position.Therefore, we considered the dynamic time-regularized DTW method to obtain the center of mass curve reflecting the power fluctuation in each time zone.DTW can be used to overcome the problem of phase shift of the PV power curves due to sudden weather changes (e.g., delayed power dips due to cloud movement).DTW can eliminate the time axis offset through nonlinear alignment, and can be applied to the time series similarity metrics of different lengths and shapes.Given two time series X and Y, the optimal path can be solved using DTW,which is defined as follows[33]:
where W denotes the set of aligned paths that satisfy the boundedness, continuity, and monotonicity constraints.
Because the classification results of the K-means algorithm are not sufficiently robust for the selection of the initial points, we proposed the K-means++ algorithm.Firstly, a sample is randomly selected from the dataset as the first center of mass, c1.For each sample, xi, we calculated its DTW distance from the nearest center of mass in the set of selected centers of mass,cj,which is denoted as D(xi).It is expressed as follows [34]:
The next center of mass is then selected based on the probability of the square of the distance.That is,the sample furthest away from the current set of centers of mass is more likely to be selected as the new center of mass.The probability is calculated as follows:

Subsequently, for each sample, xi, we calculated its DTW distance,DTW(xi,cj),from all the k centers of mass,and assigned it to the cluster represented by the center of mass with the smallest DTW distance [35].For each cluster,its center of mass is updated to be the median of all the samples within the cluster to reduce the influence of outliers and preserve the temporal morphological features.
To make the improved DTW-K-means algorithm converge within a finite number of steps, the objective function is defined to minimize the total DTW distance within each cluster:
where Cj denotes the set of the j cluster.
Because J has a lower bound of 0 and continuously decreases at each iteration, the algorithm must converge within a finite number of steps based on the monotonic convergence theorem.
2.2 Typical power weather curve
In this study,a yearly sample of the minute-level power data for PV in Arizona is divided into 12 groups based on the month to preserve the seasonal characteristics.All the sample groups are then divided into 24 subsets with hourly intervals.Separate independent DTW-K-means clustering was performed on the data within each set of time intervals to obtain the center-of-mass curves.Furthermore, we performed weather label assignment, defining high power as sunny, medium power as cloudy, and low power as rainy based on the average power ranking of the center of mass.
This can be expressed as follows:

where θhigh and θlow denote the upper and lower power thresholds.
Based on the previous analysis,the K-means++cluster based on DTW analysis of three clusters was considered for 24 small time periods of output power data for each month in a region based on Eqs.(4)-(6).
Fig.4 depicts the plot results of K-means++ based on the DTW meteorological clustering of the output power for different time periods in February 2020 for a PV plant in Arizona with a rated capacity of 100 kW.For ease of viewing, only a portion of the sample is depicted.
Based on the previous analysis, the high, medium, and low clustering centers generated for each hourly time period of each month were considered as the typical weather power center of mass curves corresponding to the sunny,cloudy, and rainy weather conditions for that month,respectively,and a typical daily power curve was obtained to reflect the corresponding weather.Fig.5 depicts the typical weather power curves for the month obtained by linking the cluster centers that are determined by clustering each of the above time periods.
3 Fluctuation analysis by using wavelet decomposition
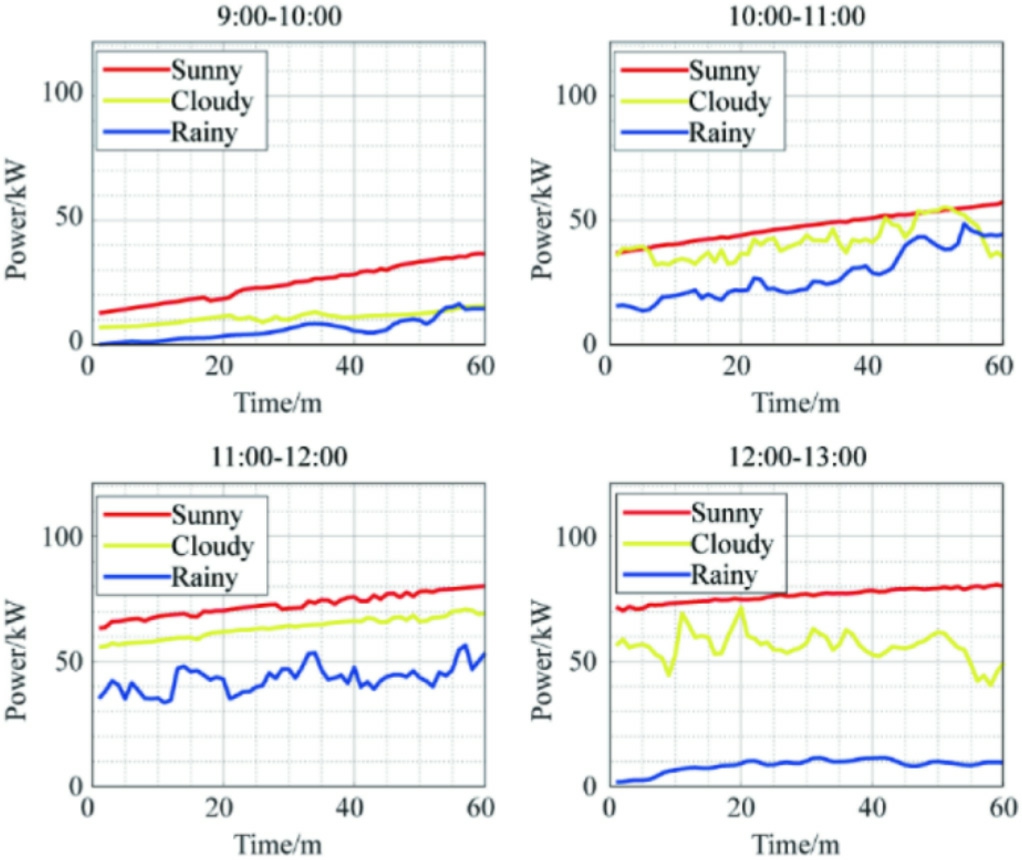
Fig.4.Arizona February partial time zone clustering result.
PV systems present a considerable risk to the long-term stability of the grid operation as a representative of the new energy that gains access to the power system through the intermittent fluctuations in the output power [36].These systems are typically used in the energy storage system, PPRC, and other RR control strategies to reduce the limitations presented by the fluctuations [37].Furthermore,changes in the external environment caused by fluctuations in the PV output power hinder the comprehensive analysis of the power RR control strategy.Obtaining a better understanding of the time period and the weather conditions can help in developing more effective countermeasures.
3.1 Ramp rate exceeds the time zones statistics
To determine the time zones of concern for the RR overruns, the PV output power data for each day of the month for a particular region is divided into 24 groups on an hourly basis.The instantaneous RR is then calculated using Eq.(1) combined with Eq.(2) to discriminate and record the overruns with an RR limit of 10%, and the number of times the RR overruns were generated in each hourly interval on the same day is counted.
The data for one year in Tucson,Arizona,was grouped based on month to minimize the impact of the seasonal weather conditions.To visually depict the RR time zones of concern in Tucson,they were partitioned into segments of 24 h.Fig.6 depicts the number of RR overruns in the area by month for each time of year.
The RR overrun conditions are most likely to occur in the period between 9:00 and 17:00.The RR overrun interval segments are more frequent in spring and summer,and relatively rare in winter and fall.
To further analyze the weather conditions during these time periods,the RRs for the entire year were analyzed on a daily basis, grouped by month, to identify the extreme weather dates for each month, and Fig.7 depicts the results.
Figs.6 and 7 present a reasonable accounting of the power fluctuations in Tucson, with the most frequent and severe RR overruns occurring during the spring and summer months when the climate is variable,and the most moderate conditions occurring in the autumn, with only a few isolated dates when more severe conditions are observed.
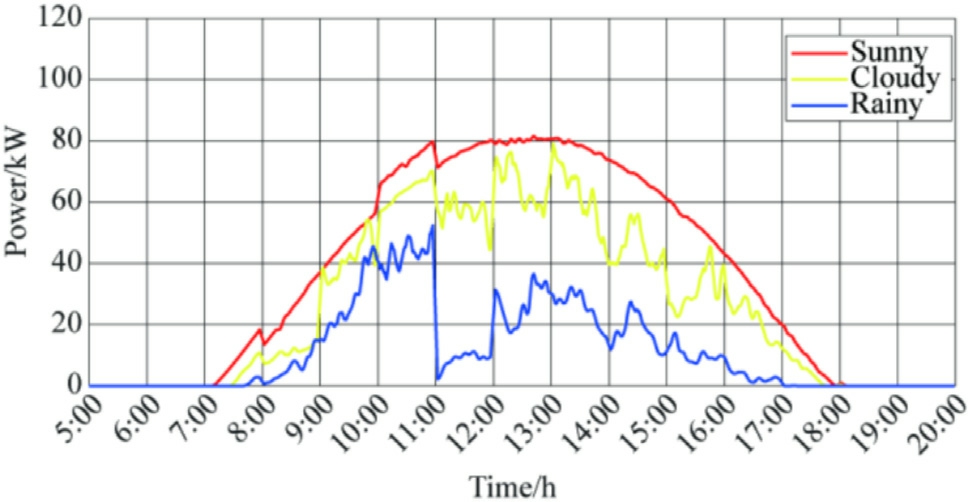
Fig.5.Typical Arizona weather daily power curves for February.
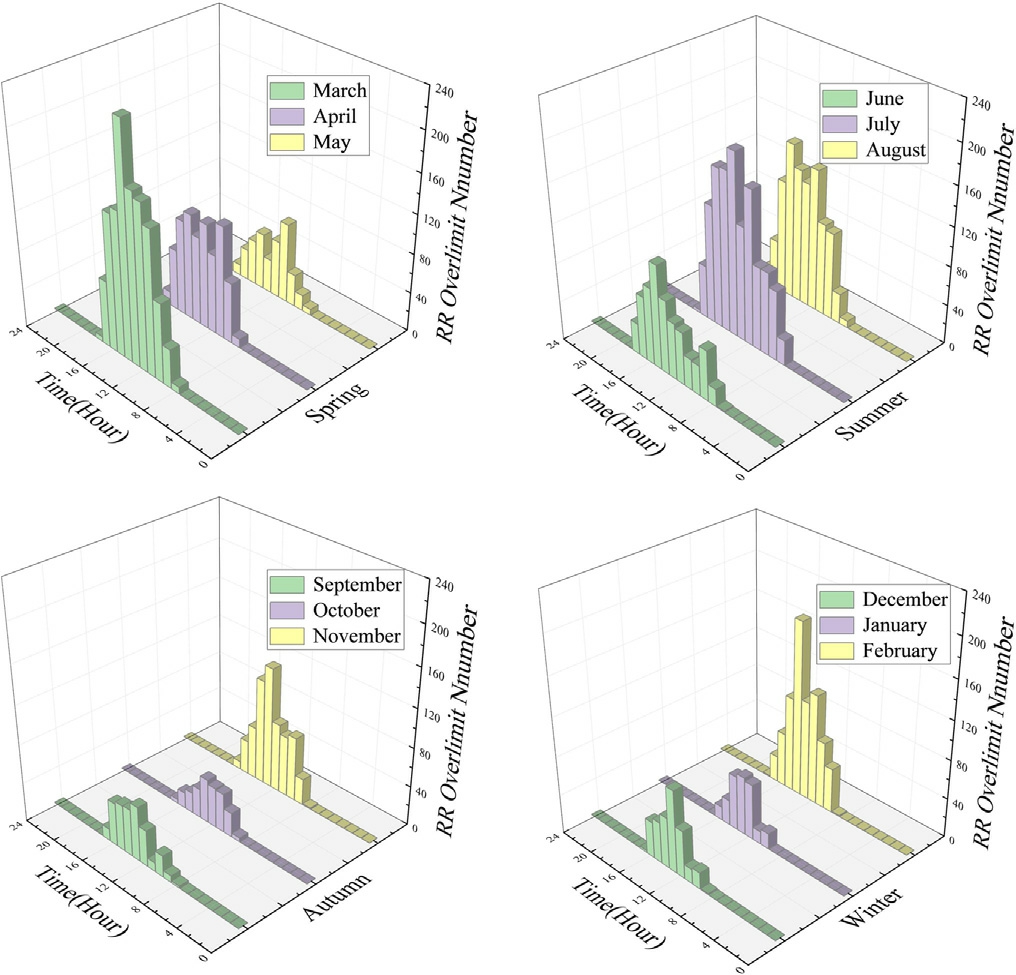
Fig.6.Overrun of the number of RR in a year (by hour).
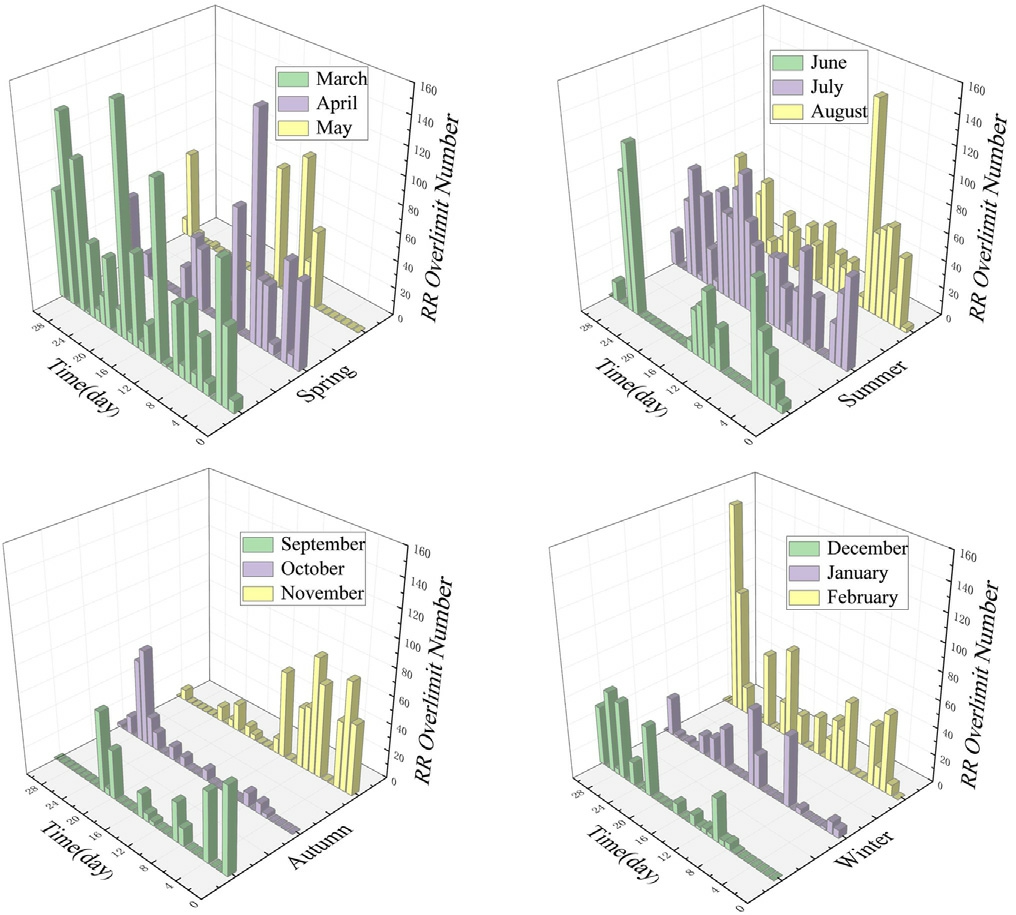
Fig.7.Overrun of the number of RR in a year (by day).
3.2 Wavelet decomposition fitted to daily power
To further analyze the climatic conditions of the month in which these periods are prone to power fluctuations and creep rate conditions,we considered the actual daily power curves for the dates of interest.To minimize the difficulty of the analysis,sampling wavelet transforms were fitted to their approximate trends.These trends were then compared with the typical daily power curves for the current month clustered to include the three conditions obtained in the previous steps to determine the prevalent climatic conditions in each time zone.The wavelet decomposition method involves the multi-scale analysis of signals using the scale functions and wavelet functions,and is expressed as follows [38]:
where x(t) denotes the original signal, ψ(t) denotes the wavelet function,a denotes the scale factor,and b denotes the translation factor.
The values of the scale factor and translation factor determine the accuracy and speed of the wavelet transform.Typically, the scale factor and translation factor are considered as multiples of 2j (j is an integer greater than 0) to realize the fast wavelet transform.
The result of the discrete wavelet decomposition can be decomposed into approximate coefficients and detail coefficients, where the approximate coefficients represent the low-frequency part of the signal and the detail coefficients represent the high-frequency part of the signal [39].The wavelet series expansion is defined as:
where j0 denotes an arbitrary starting point, ϕj,k(x)denotes the scale function, ψj,k(x) denotes the wavelet function, cj,k denotes the approximation coefficient, and dj,k denotes the detail coefficient.
The j layer approximation factor is given as:
The j layer detail factor is given as:
The wavelet reconstruction signal composition is expressed as follows:
The wavelet approximation coefficients after four levels of decomposition retain the general trend of the power,and the detail coefficients of the third and fourth levels reflect the fluctuations within a specific time period.The approximation curve of the wavelet obtained after the three reconstructions comprises the approximation of the signal trend and some details of the fluctuations, which can be used as an approximation curve of the daily output power[40].Fig.8 depicts a schematic of the wavelet reconstruction after decomposition.

Fig.8.Schematic diagram of wavelet decomposition reconstruction.
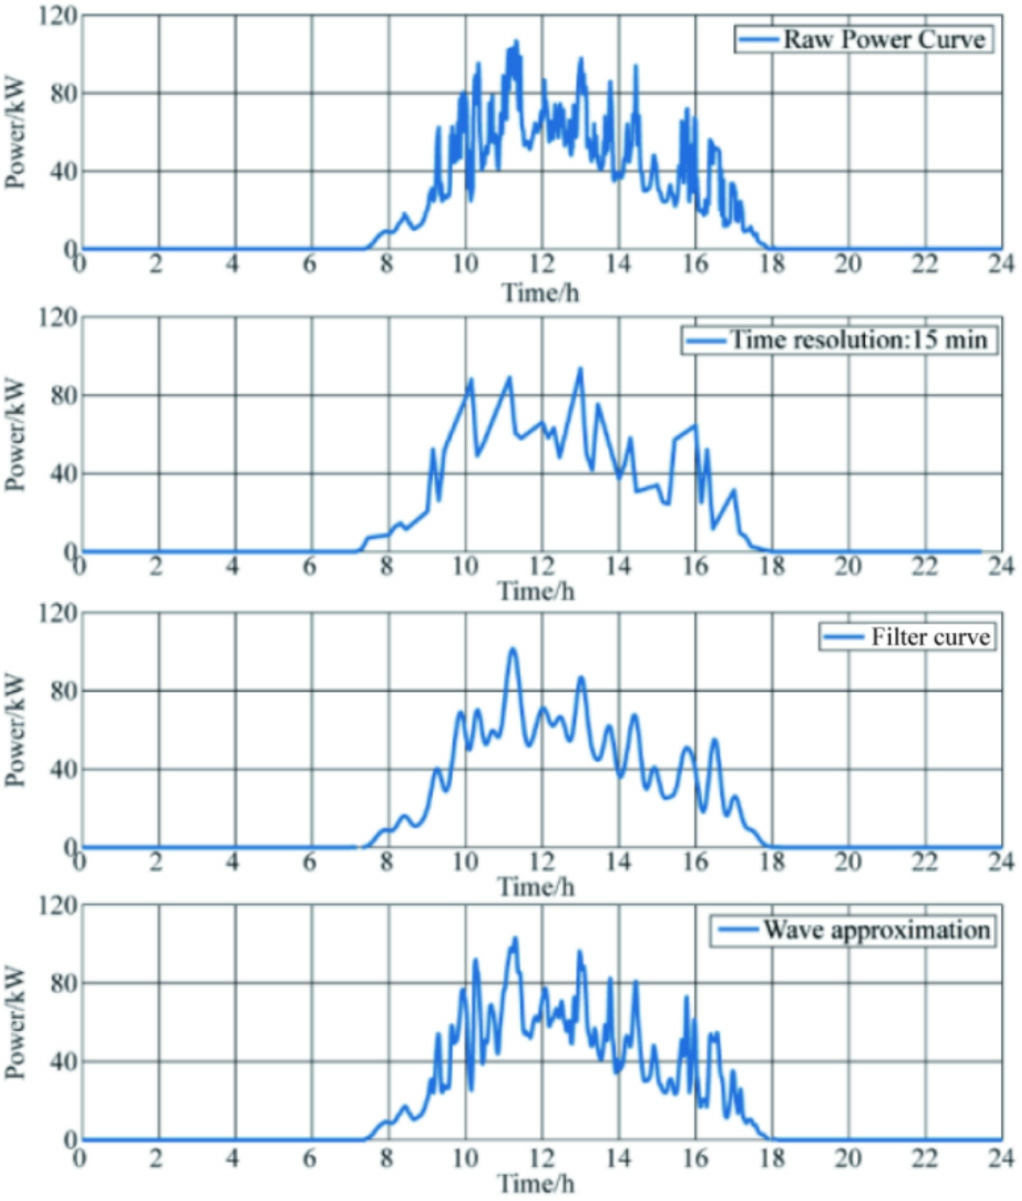
Fig.9.Comparison of different sampling frequencies with wavelet decomposition.
Fig.9 depicts the raw power data at the minute level,the daily measured power of the PV plant with a sampling step of 15 min and the power curve after the low-pass filter,along with the approximate curve reconstructed via wavelet decomposition, as shown in Eq.(12).The comparison results demonstrated that the 15 min and filtered power curves can effectively reflect the overall trend of the PV power curve; however, they cannot represent the shortterm fluctuations of the PV power curve.Conversely, the approximate horizontal curve obtained through wavelet transformation of the daily power high-frequency data makes it easier to analyze the fluctuation of the PV power generation.Therefore,the wavelet decomposition is used to fit the curve to reduce the workload while considering the accuracy of analyzing the approximate output power of each time period of a certain day.
4 PV power fluctuation identification
4.1 Weather probability framework analysis
Fig.7 depicts the days with the highest RR overrun levels that are obtained from the previous monthly RR overrun histograms.The typical RR ramp time zones were analyzed for two days, i.e., on the 23rd and 28th of February.
The red circles in Figs.10 and 11 represent the RR overruns, and the blue circles indicate the points within the 10% RR standard limit.The power fluctuations in the region were observed to be more intense on February 23rd from 9:00 to 12:00.Additionally,for most of the time on February 28th, i.e., from 9:00 to 17:00, it is in the period of RR overruns; however, the least RR overruns were observed in the period from 12:00 to 13:00.
The daily power curves were fitted using the wavelet decomposition method and compared with the daily power curves of typical weather during the month to analyze the type of weather that produces the time zones where RR overruns are frequent.
To reflect the degree of dispersion of the data,the standard deviation, σ(t), was calculated, and the confidence intervals were plotted for each moment, as shown in Figs.12 and 13.Typically, μ(t) denotes the mean value of power at time t,and the±1 standard deviation interval can be defined as follows:
To quantify the treatment,we considered using a probabilistic framework to determine the weather type.For the typical weather profile, μi(t) denotes the mean power at time t, σi(t) denotes the standard deviation, and the confidence interval for the weather is given as:
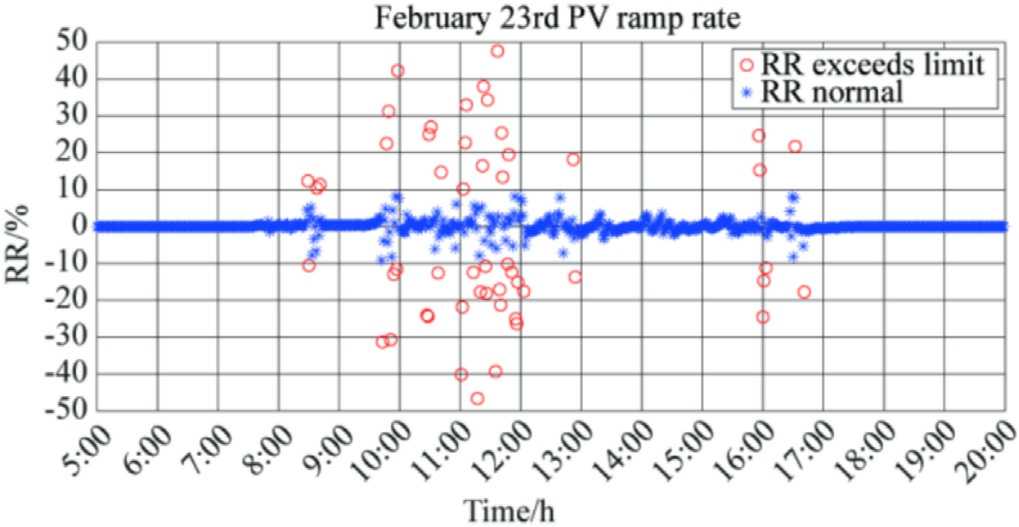
Fig.10.Arizona RR overrun time zones for February 23rd.
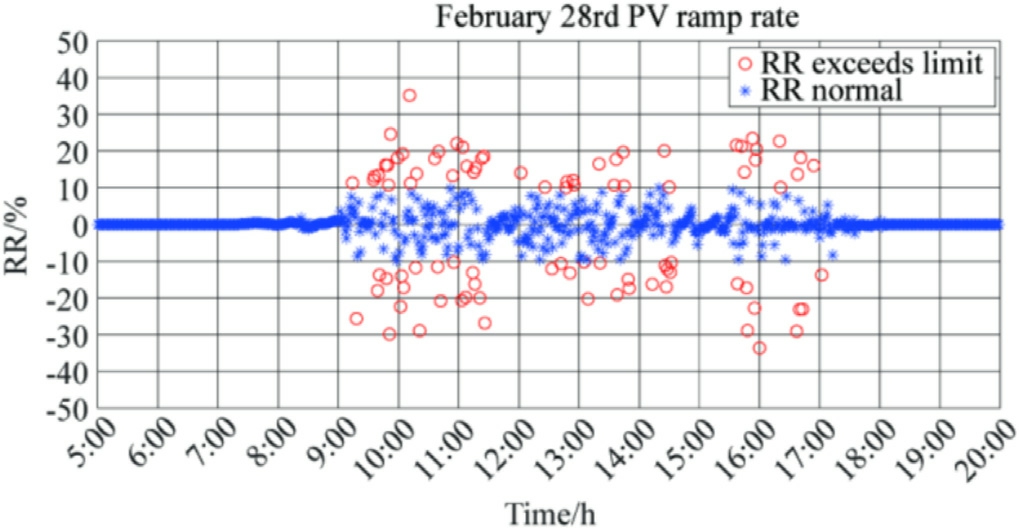
Fig.11.Arizona RR overrun time zones for February 28th.
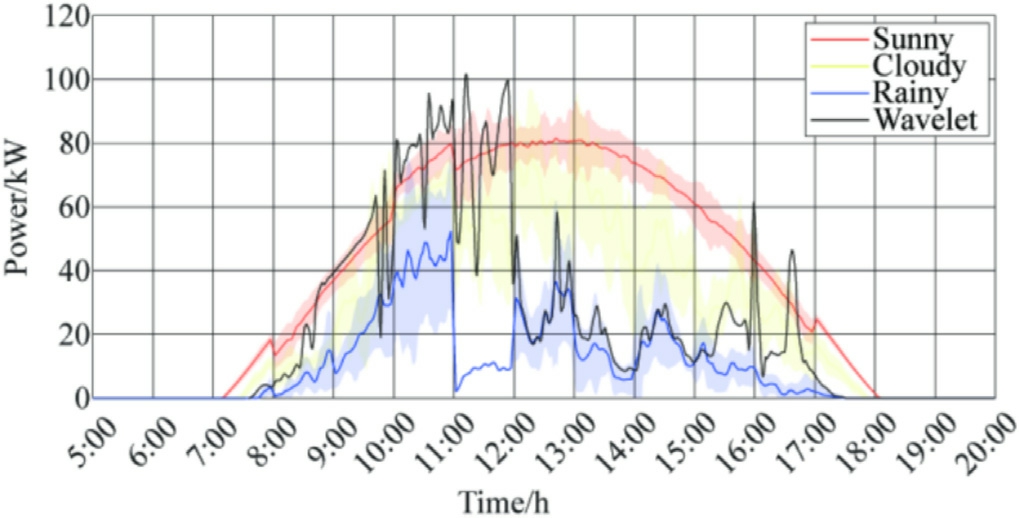
Fig.12.February 23 Wavelet Decomposition Approximate Power Curve Comparison.
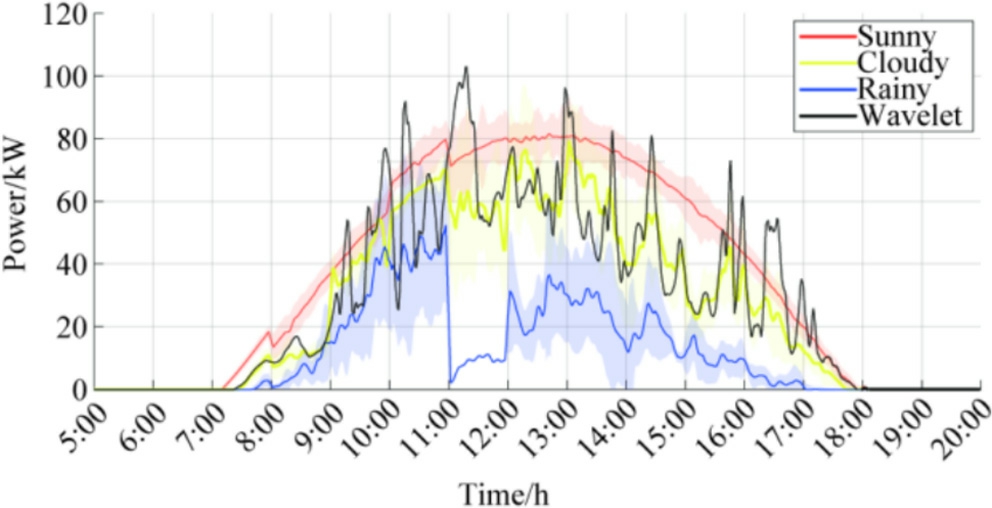
Fig.13.February 28 Wavelet Decomposition Approximate Power Curve Comparison.
If the observation, yobs(t) (wavelet transformed daily power curves), falls within the confidence interval, CIi(t),for a given weather, the moment is considered to belong to that weather 100% of the time.If yobs(t) falls within the overlapping confidence intervals of two weather at the same time, the probability of each is taken as 50 percent.
If the direct determination condition is not satisfied,the distance to each weather is calculated, and the distance to a particular weather condition for an observation is defined as follows:
This represents the shortest distance from the observation to the boundary of each weather confidence interval.Additionally, for observations that do not fall within any confidence interval, weights are assigned for each weather inverse distance weighting as follows:
The normalization process yields the probabilities, i.e.,the weight of each weather divided by the weight of the three types of weather added together, where i = 1, 2, 3 corresponds to sunny, cloudy, and rainy weather,respectively:
To improve the accuracy and prevent misclassification,minute sampling points with N=60 were set for each time interval (the probability that the sampling power of a special point is 0 is also 0),and the probability that an observation lies within a particular weather type during that hour is defined as follows:
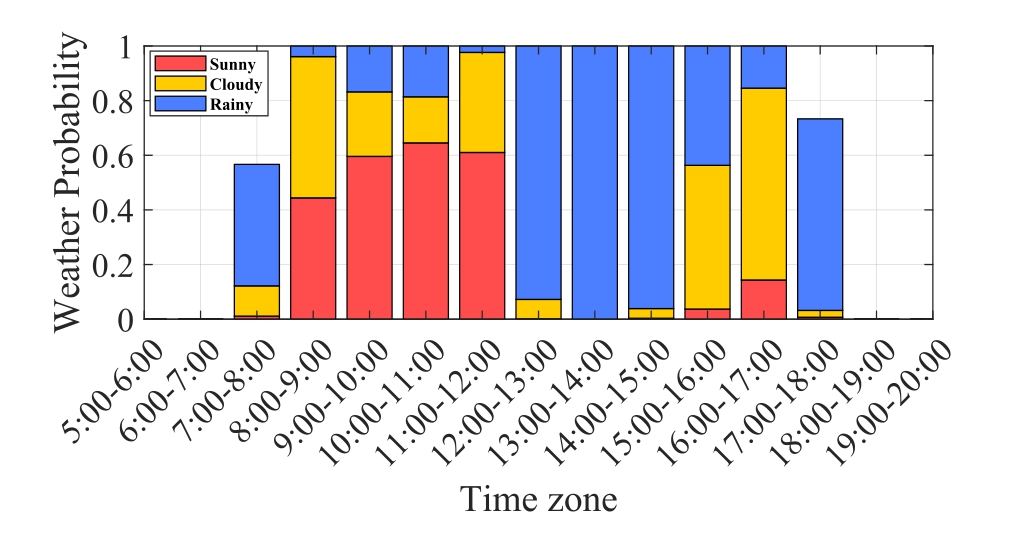
Fig.14.Calculation of weather probability for February 23rd.
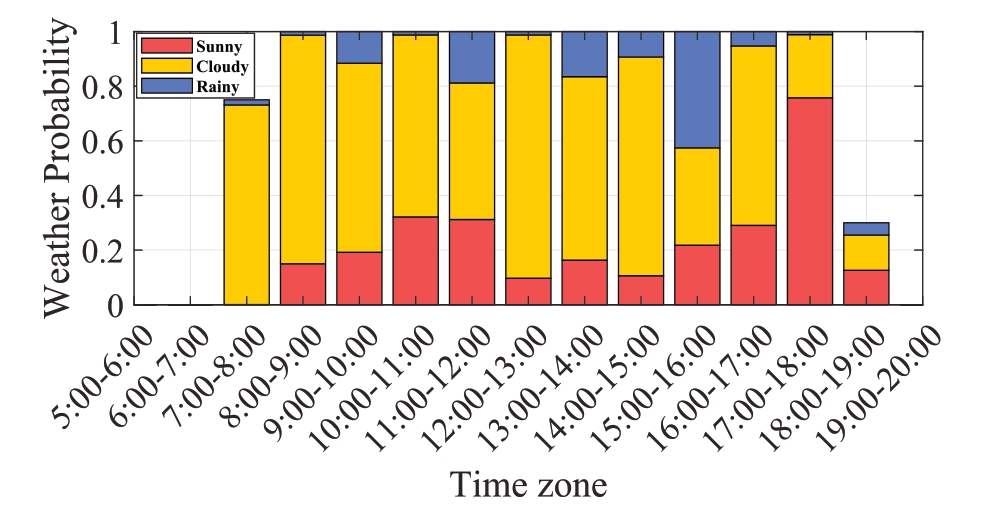
Fig.15.Calculation of weather probability for February 28th.
Figs.14 and 15 depict the results of the meteorological probability calculations for two typical days in February(dates of frequent PV power overrun events).We compared the specific time periods for RR overruns in Figs.10 and 11.The data analysis demonstrates that the RR overruns are not severe in the period between 12:00 and 15:00 on February 23rd,where rainy weather is persistent,and in the period between 12:00 and 13:00 on February 28th,when the weather is cloudy.Conversely, during the other periods, the weather type switched frequently between sunny, rainy, and cloudy weather, presenting drastic fluctuations in the PV output.Therefore, the region is prone to RR overruns due to high-impact weather types in the period between 9:00 and 17:00 throughout the day in February.However, the magnitude of PV power fluctuation is relatively small, for the cloudy weather observed in the period between 12:00 and 13:00 and the continuous rainy weather observed in the period between 12:00 and 15:00; this prevents large-scale RR overruns.The specifics of the other months and time periods can also be analyzed using this method.
4.2 Application scenario analysis
Based on the results of the above analysis, we consider the month of February in Tucson as an example of the various weather types that must be considered when designing a PRRC control strategy for that month.The blue line in Fig.16 represents the actual output power,and the red line represents the power corrected using different PRRC control strategies.
The MPPT control strategy can be used on sunny days when no RR overruns were observed.The APC-based PRRC control strategy can be used on cloudy days when minimal power fluctuation is observed.The more stringent ESS-based PRRC control strategy was used during the sunny and rainy weather.Effective control strategies were realized for different weather types in different time periods, which ensure the efficiency of PV power generation while satisfying the international RR limitation standards.
Fig.17 depicts the specific practical applications,where the proposed method does not rely on real-time weather forecasts or irradiance forecasts generated one day in advance.It only utilizes the historical correlation between the power fluctuations and weather type within a specific region analyzed from the historical power data using the proposed a power fluctuation identification method.Subsequently, different PRRC control strategies and parameters (e.g., APC reserve power ΔP or ESS capacity allocation) are pre-determined to optimize the power regulation efficiency of the PV plant under different weather conditions.
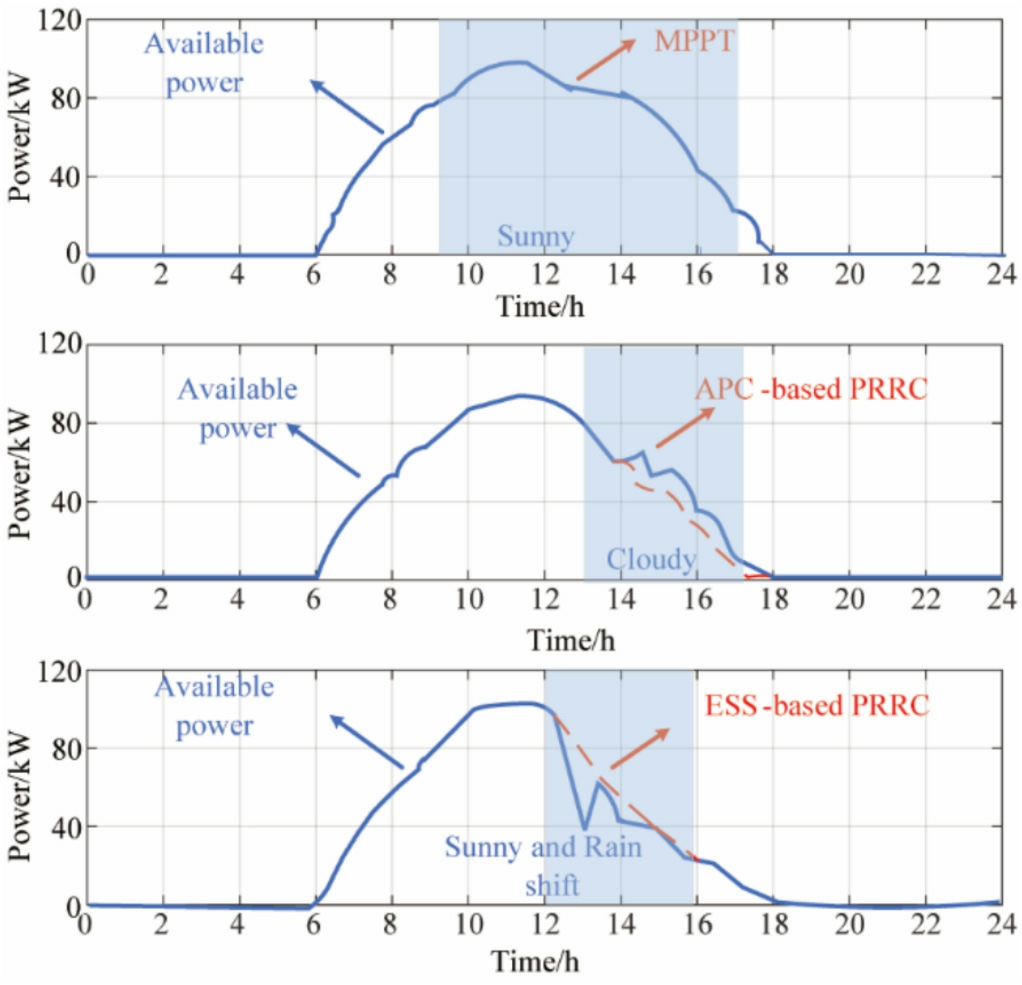
Fig.16.Examples of PRRC Control Strategies Implemented.
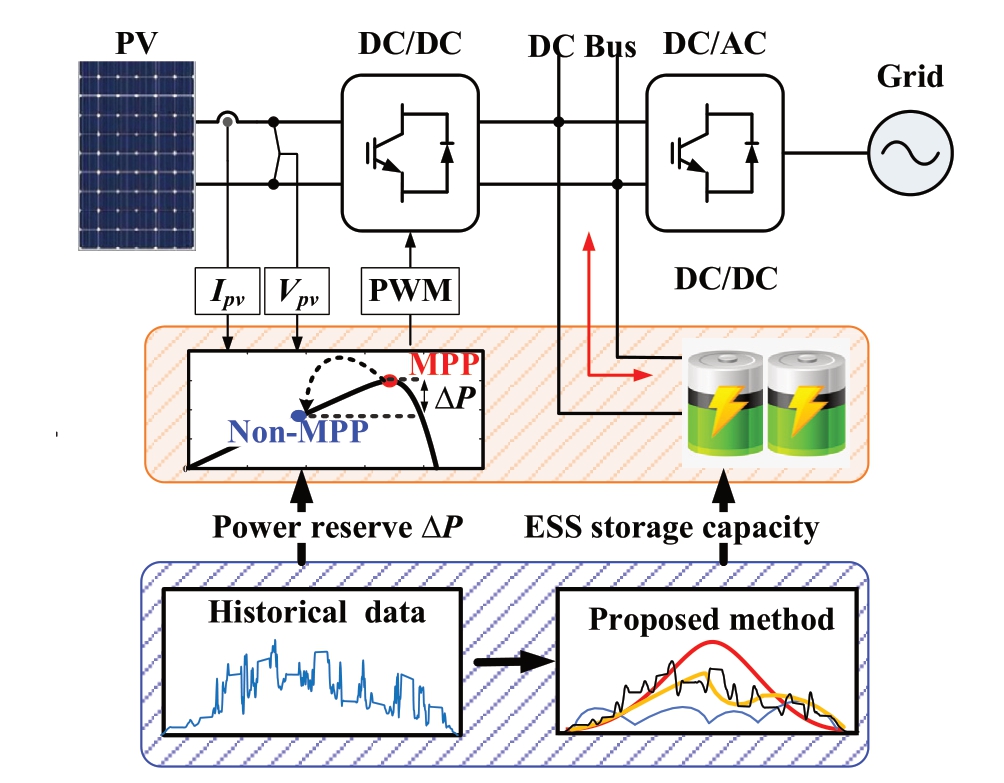
Fig.17.Examples of Application Scenario.
5 Experiment validation
The experiment is implemented on the MT 6016 hardware-in-loop platform to evaluate the performance of the conventional APC control scheme under extreme weather conditions, as shown in Fig.18.Table 1 lists the crucial parameters for the test system.The PV system and its cascaded circuits are constructed by the field programmable gate array (FPGA)through the software Star-Sim provided by National Instrument.The test results are monitored using an oscilloscope through an interface board.We applied two days of meteorological data on the testbed to determine the effectiveness and the efficiency of the APC scheme under different weather types.
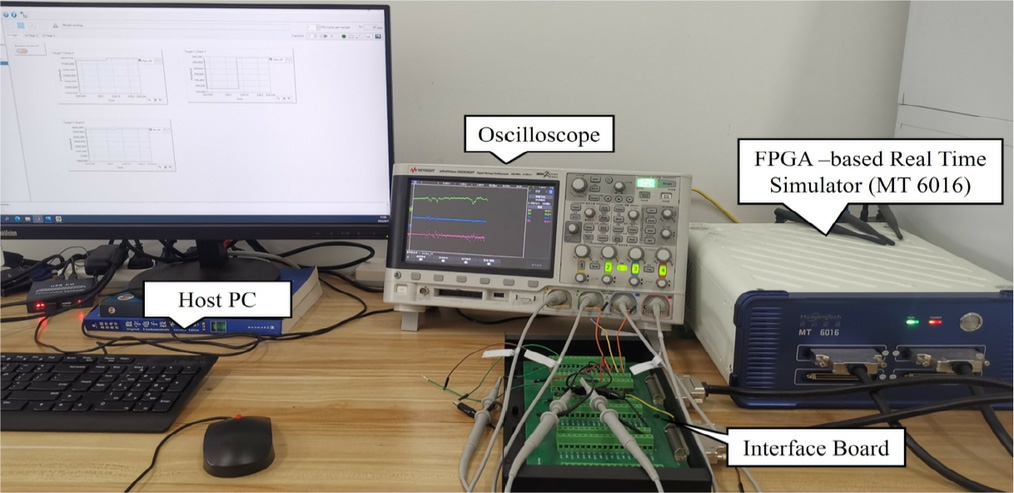
Fig.18.The experiment platform.
Table 1 Critical parameters of the test system.
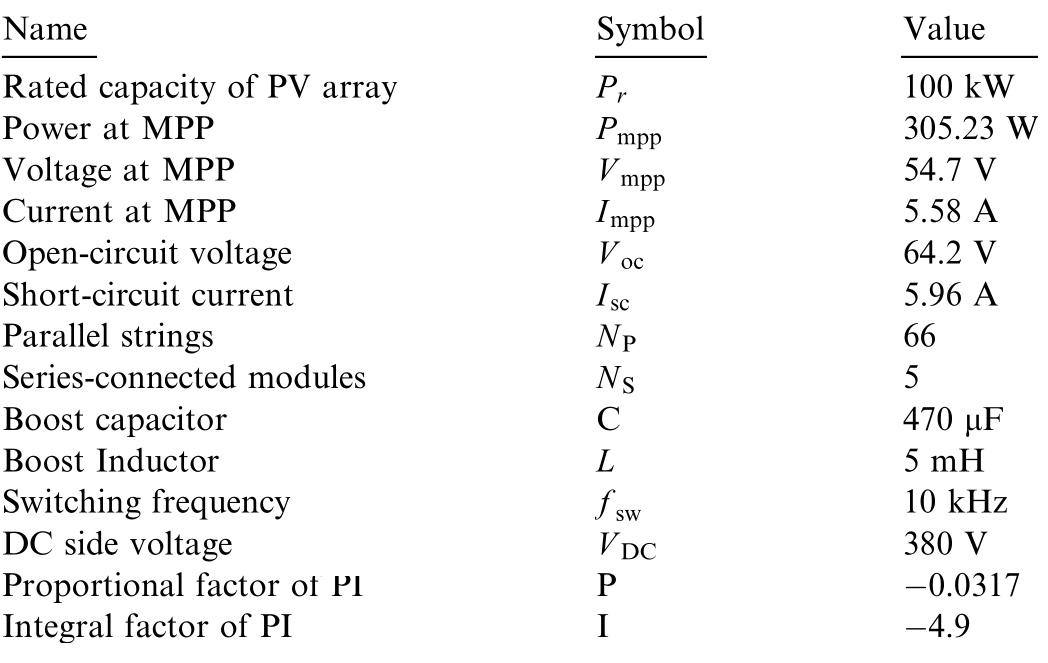
NameSymbolValue Rated capacity of PV arrayPr100 kW Power at MPPPmpp305.23 W Voltage at MPPV mpp54.7 V Current at MPPImpp5.58 A Open-circuit voltageV oc64.2 V Short-circuit currentIsc5.96 A Parallel stringsNP66 Series-connected modulesNS5 Boost capacitorC470 μF Boost InductorL5 mH Switching frequencyfsw10 kHz DC side voltageV DC380 V Proportional factor of PIP0.0317 Integral factor of PII4.9
Thus, the experimental results are cross-validated with the above analysis, thereby demonstrating the importance of the proposed methodology for optimizing the PRRC control strategy, as explained in the introduction.Additionally, the experiment employed the international RR limiting criterion of 10% to evaluate the APC performance.The experimental test period lies between 9:00 and 15:00 (February 23th and 28th, 2020, Tucson, Arizona),when the ramp events were concentrated and accelerated 30 times to reduce the waiting time.
Fig.19 presents the results of the experimental platform that are depicted using an oscilloscope.Fig.19(a) depicts the benchmark condition where the PV system is controlled by MPPT without the RR regulation ability.Fig.19(c) depicts the power and voltage change regulated by the APC-based PRRC scheme.Additionally,Fig.19(b)(d) depicts the real-time RR values for the MPPT and APC states.The red dashed line indicates the range that satisfies the standard RRlimit.Consequently, during weather with high intermittent solar irradiance,the system operates with a significant power RR that violates the grid limits.The conventional control strategy of the APC is more appropriate in terms of the efficiency of its regulation capability for cloudy weather with low power fluctuations.However,for frequent high power fluctuations in the rainy and sunny transition weather, its regulation efficiency is relatively low and is not suitable for the RR criterion for safe operation of the grid.The results of the experiment also validate the effectiveness of the proposed method for the time periods and weather types noted by the PRRC for that month.
6 Conclusion

Fig.19.Experimental results of the(a1)Voltage and power in MPPT mode on February 23rd(b1)RR in MPPT mode on February 23rd(c1)Voltage and power in APC mode on February 23rd(d1)RR in APC mode on February 23rd.Experimental results of the(a2)Voltage and power in MPPT mode on February 28th (b2) RR in MPPT mode on February 28th (c2) Voltage and power in APC mode on February 28th (d2) RR in APC mode on February 28th.
In this study, we proposed a novel power fluctuation identification method based on temporal clustering and wavelet decomposition.An analysis of the data obtained from Tucson, Arizona, demonstrates that the most noteworthy PV power fluctuations are concentrated in the 9:00-17:00 time period.However, during the cloudy weather between 12:00 and 13:00 and the continuously cloudy weather between 12:00 and 15:00 in February, the PV power fluctuations are relatively small and do not cause widespread RR overruns.The experimental results on the hardware-in-the-loop platform demonstrate that the conventional APC strategy can control the small cloudy or rainy fluctuations between 9:00 and 15:00 in February.However, it is unsuitable for high-impact weather processes.Therefore, the proposed method for identifying PV power fluctuation regions is accurate and beneficial for PRRC strategy selection and parameter optimization under different time zones and weather conditions.
CRediT authorship contribution statement
You Chen: Investigation.Xingshuo Li: Validation.Xiaoyang Chen: Data curation.Shuye Ding: Supervision.Yizhi Chen: Investigation.Wei Wang: Investigation.
Declaration of competing interest
The authors declare the following financial interests/personal relationships which may be considered as potential competing interests: Yizhi Chen and Wei Wang are currently employed by NARI Technology Development Co.Ltd.The other authors declare that they have no known competing financial interests or personal relationships that could have appeared to influence the work reported in this paper.
Acknowledgements
This work was supported by the Natural Science Research Project of Jiangsu Higher Education Institutions(23KJB470019) and the Natural Science Foundation of Jiangsu Province under Grant BK20240594.
References
-
[1]
Ammar Atif Abdalla, Muhammad Khalid, Smoothing methodologies for photovoltaic power fluctuations, in: 2019 8th International Conference on Renewable Energy Research and Applications (ICRERA), 2019, pp.342-346. [百度学术]
-
[2]
A.Ja¨ger-Waldau, Snapshot of photovoltaics-may 2023, EPJ Photovolt.14 (2023) 23. [百度学术]
-
[3]
X.Ai, J.Li, J.Fang,W.Yao,H.Xie, R.Cai,J.Wen,Multi-timescale coordinated ramp-rate control for photovoltaic plants and battery energy storage, IET Renew.Power Gener.12 (12) (2018)1390-1397. [百度学术]
-
[4]
Damira Kecˇek,Davor Mikulic´,Zˇeljko Lovrincˇevic´,Deployment of renewable energy: economic effects on the croatian economy,Energy Policy 126 (2019) 402-410. [百度学术]
-
[5]
T.K.Bogdan-Ionut¸Cra˘ciun, R.T.DezsoSe´ra, U.D.Annakkage,Power ramp limitation capabilities of large pv power plants with active power reserves, IEEE Trans.Sustain.Energy 8 (2) (2016)573-581. [百度学术]
-
[6]
M.M.A.Awan, A technical review of MPPT algorithms for solar photovoltaic system: SWOT analysis of MPPT algorithms[J], Sir Syed Univ.Res.J.Eng.Technol.12 (1) (2022) 98-106. [百度学术]
-
[7]
H.D.Tafti,C.D.Townsend,G.Konstantinou,et al.,A multi-mode flexible power point tracking algorithm for photovoltaic power plants[J], IEEE Trans.Power Electron.34 (6) (2018) 5038-5042. [百度学术]
-
[8]
H.D.Tafti,G.Konstantinou,C.D.Townsend,et al.,Comparative analysis of flexible power point tracking algorithms in photovoltaic systems[C], in: 2020 IEEE Energy Conversion Congress and Exposition (ECCE), IEEE, 2020, pp.110-115. [百度学术]
-
[9]
S.Patel, M.Ahmed, S.Kamalasadan, A novel energy storagebased net-load smoothing and shifting architecture for high amount of photovoltaics integrated power distribution system[J],IEEE Trans.Ind.Appl.56 (3) (2020) 3090-3099. [百度学术]
-
[10]
E.I.Batzelis, S.A.Papathanassiou, B.C.Pal, PV system control to provide active power reserves under partial shading conditions[J],IEEE Trans.Power Electron.33 (11) (2018) 9163-9175. [百度学术]
-
[11]
E.I.Batzelis,G.E.Kampitsis,S.A.Papathanassiou,Power reserves control for pv systems with real-ime mpp estimation via curve fitting, IEEE Trans.Sustain.Energy 8 (3) (2017) 1269-1280. [百度学术]
-
[12]
P.Kumari, N.Kumar, B.K.Panigrahi, A framework of reduced sensor rooftop SPV system using parabolic curve fitting MPPT technology for household consumers[J], IEEE Trans.Consum.Electron.69 (1) (2022) 29-37. [百度学术]
-
[13]
X.Li, H.Wen, Y.Zhu, L.Jiang, Hu.Yihua, W.Xiao, A novel sensorless photovoltaic power reserve control with simple real-time mpp estimation, IEEE Trans.Power Electron.34 (8) (2018) 7521-7531. [百度学术]
-
[14]
X.Li, H.Wen,B.Chen, S.Ding, W.Xiao, A cost-effective power ramp rate control strategy based on flexible power point tracking for photovoltaic system, Sol.Energy 208 (2020) 1058-1067. [百度学术]
-
[15]
A.F.Hoke, M.Shirazi, S.Chakraborty, E.Muljadi, D.Maksimovic, Rapid active power control of photovoltaic systems for grid frequency support,IEEE J.Emerg.Selected Topics Power Electron.5 (3) (2017) 1154-1163. [百度学术]
-
[16]
J.Wide´n,E.Wa¨ckelga˚rd,J.Paatero,P.Lund,Impacts of different data averaging times on statistical analysis of distributed domestic photovoltaic systems, Sol.Energy 84 (3) (2010) 492-500. [百度学术]
-
[17]
Md.Kamal Hossain,Mohd Hasan Ali,Statistical analysis of ramp rates of solar photovoltaic system connected to grid, in: IEEE Energy Conversion Congress and Exposition (ECCE), 2014, pp.2524-2531. [百度学术]
-
[18]
Xi Zhang, Chongqing Kang, Ning Zhang, Yuehui Huang, Chun Liu, J.F.Xu, Analysis of mid/long term random characteristics of photovoltaic power generation, Automat.Electric Power Syst.38(6) (2014) 6-13. [百度学术]
-
[19]
S.Lou, D.Zhang, D.H.W.Li, et al., Evaluating solar ramp rate correlations by simple radiation and wind measurements[J],Renew.Energy 235 (2024) 121358. [百度学术]
-
[20]
Lingfeng Xia,Jiaming Li,Liang Zhao,Xiaomeng Ai,Jiakun Fang,Jinyu Wen,Hailian Xie,A pv power time series generating method considering temporal and spatial correlation characteristics, Proc.CSEE 37 (2017) 1982-1992. [百度学术]
-
[21]
Yi Cui, Su Yu, Yong Liu, Yilu Liu, David Smith, Study of variability metrics for solar irradiance and photovoltaic output,in:2017 IEEE Power and Energy Society General Meeting, IEEE,2017, pp.1-5. [百度学术]
-
[22]
X.G.Agoua, R.Girard, G.Kariniotakis, Probabilistic models for spatio-temporal photovoltaic power forecasting, IEEE Trans.Sustain.Energy 10 (2) (2018) 780-789. [百度学术]
-
[23]
F.Wang, J.Li, Z.Zhen, C.Wang, H.Ren, H.Ma, W.Zhang, L.Huang, Cloud feature extraction and fluctuation pattern recognition based ultrashort-term regional pv power forecasting,IEEE Trans.Ind.Appl.58 (5) (2022) 6752-6767. [百度学术]
-
[24]
X.Jiao, X.Li, D.Lin, W.Xiao, A graph neural network based deep learning predictor for spatio-temporal group solar irradiance forecasting, IEEE Trans.Ind.Inf.18 (9) (2021) 6142-6149. [百度学术]
-
[25]
B.Zhou, W.Zhao, Su.Xiangrui, Lu.Siyu, T.Wang, W.Yao, P.Xie, T.Mao, L.Guan, Y.Lv (Eds.), 2018 IEEE Power & Energy Society General Meeting (PESGM), IEEE, 2018, pp.1-5. [百度学术]
-
[26]
Jin Tan, Changhong Deng, Ultra-short-term photovoltaic generation forecasting model based on weather clustering and markov chain, in: 2017 IEEE 44th Photovoltaic Specialist Conference (PVSC), IEEE, 2017, pp.1158-1162. [百度学术]
-
[27]
M.Kumar, P.Malik, R.Chandel, et al., Development of a novel solar PV module model for reliable power prediction under real outdoor conditions[J], Renew.Energy 217 (2023) 119224. [百度学术]
-
[28]
D.Peng,Y.Liu,D.Wang,et al.,Short-term PV-Wind forecasting of large-scale regional site clusters based on FCM clustering and hybrid Inception-ResNet embedded with Informer[J], Energ.Conver.Manage.320 (2024) 118992. [百度学术]
-
[29]
N.Kumar, B.Singh, B.K.Panigrahi, Voltage sensorless based model predictive control with battery management system: for solar PV powered on-board EV charging[J], IEEE Trans.Transp.Electrif.(2022). [百度学术]
-
[30]
Shivashankar Sukumar, Marayati Marsadek, K.R.Agileswari,Hazlie Mokhlis,Ramp-rate control smoothing methods to control output power fluctuations from solar photovoltaic(pv)sources—a review, J.Storage Mater.20 (2018) 218-229. [百度学术]
-
[31]
J.Martins, S.Spataru, D.Sera, D.-I.Stroe, A.Lashab,Comparative study of ramp-rate control algorithms for pv with energy storage systems, Energies 12 (7) (2019) 1342. [百度学术]
-
[32]
K.Iwabuchi,D.Watari,D.Zhao,et al.,Enhancing grid stability in PV systems:a novel ramp rate control method utilizing PV cooling technology[J], Appl.Energy 378 (2025) 124737. [百度学术]
-
[33]
K.Bringmann, N.Fischer, I.van der Hoog, et al., Dynamic dynamic time war**[C],in:Proceedings of the 2024 Annual ACMSIAM Symposium on Discrete Algorithms (SODA).Society for Industrial and Applied Mathematics, 2024, pp.208-242. [百度学术]
-
[34]
A.M.Ikotun, A.E.Ezugwu, L.Abualigah, et al., K-means clustering algorithms: a comprehensive review, variants analysis,and advances in the era of big data[J],Inf.Sci.622(2023)178-210. [百度学术]
-
[35]
T.J.Tsai, D.T.W.Segmental, A parallelizable alternative to dynamic time war**[C], in: ICASSP 2021-2021 IEEE International Conference on Acoustics, Speech and Signal Processing (ICASSP), IEEE, 2021, pp.106-110. [百度学术]
-
[36]
S.Veerapen, H.Wen, X.Li, Du.Yang, Y.Yang, Y.Wang, W.Xiao,A novel global maximum power point tracking algorithm for photovoltaic system with variable perturbation frequency and zero oscillation, Sol.Energy 181 (2019) 345-356. [百度学术]
-
[37]
T.Yang, X.Li, S.Ding, An improved constant power generation algorithm for photovoltaic systems, CPSS Trans.Power Electron.Appl.7 (4) (2022) 451-460. [百度学术]
-
[38]
J.-L.Starck, J.Fadili, F.Murtagh, The undecimated wavelet decomposition and its reconstruction,IEEE Trans.Image Process.16 (2) (2007) 297-309. [百度学术]
-
[39]
Y.Seo, S.Kim, O.Kisi, V.P.Singh, Daily water level forecasting using wavelet decomposition and artificial intelligence techniques,J.Hydrol.520 (2015) 224-243. [百度学术]
-
[40]
J.Wang, Z.e.Wang, J.Li, Wu.Junjie, Multilevel wavelet decomposition network for interpretable time series analysis, in:Proceedings of the 24th ACM SIGKDD International Conference on Knowledge Discovery and Data Mining, 2018, pp.2437-2446. [百度学术]
Fund Information

