Recommended articles:
-

-
Global Energy Interconnection
Volume 8, Issue 5, Oct 2025, Pages 747-759
Total inertia evaluation of multiple PV power stations with virtual inertia control using a small number of measurements
Abstract
Abstract The increasing penetration of PV power generation inevitably leads to the decline of system inertia, posing challenges to frequency stability.To this end, virtual inertia control has been proposed; however, it causes more fluctuations of system inertia.To address this issue, a novel equivalent inertia evaluation method for multiple PV power generation under virtual inertia control is proposed.The total system inertia is first estimated based on historical or injected disturbance.Then, the total inertia of multiple PV power generation is directly calculated by subtracting the inertia of synchronous generators from the estimated system inertia.To improve practicality, a partition-based strategy is introduced, which divides the system into regions characterized by homogeneous frequency response behaviors.After partitioning, only the synchronous generator data within the region and inter-area transmission line power are required for evaluation,reducing the demand for PMU data compared to traditional methods requiring measurements at each PV connection point.Comprehensive simulation results in a 10-machine 39-bus system penetrated with multiple PV power generation validated the effectiveness of the proposed method.
0 Introduction
With the transformation of the global energy structure and advancement of green development strategies, China’s photovoltaic (PV) power generation has developed rapidly, an d the installed capacity of PV power is growing continuously.By the end of December 2023, China’s installed solar power capacity reached approximately 610 million kilowatts, reflecting a substantial year-on-year growth of 55.2%[1].This surge has positioned solar energy as a significant factor in driving the energy revolution [2].However, the high proportion of PV power stations connected to the grid introduces challenges to the stability and reliability of traditional power systems [3,4].
The volatility and uncertainty of solar energy leads to changes in the frequency response characteristics of power systems under disturbances, and studying the frequency dynamics of power systems including PV power generation is important.In particular, to enhance the frequency stability of power systems with substantial integration of PV power, approaches such as frequency modulation should be adopted to realize inertia support.However,when PV power stations implement maximum power point tracking (MPPT) control, they cannot participate in inertia response due to the lack of spare power.In such situations, PV curtailment, DC capacitors, and additional energy storage units are employed as energy sources [5]to implement virtual inertia control, thereby contributing to system’s inertia support [6].Virtual inertia control introduces a feedback link to realize flexible control, and can quickly respond to frequency changes in the system.Recent studies have highlighted the importance of virtual inertia in PV systems.For instance, the inclus ion of virtual inertia control in the grid code has been pioneered in Spain, demonstrating that PV systems can actively contribute to frequency regulation by providing inertial response[7].The heterogeneous implementation of control methods and parameters across PV power stations results in significant variability in their equivalent inertia contributions, leading to more challenges for inertia allocation strategies and inertia security-domain estimation [8-10],which are important for secure and economic operation of power systems.As a result, in addition to traditional methods for evaluat ing the overall system inertia, evaluation methods targeting PV power stations have also been proposed.
In the evaluation method that takes the PV power stations’ inertia as the evaluation object, most existing studies define the equivalent inertia of the PV power station as an analogy of the swing equation of the synchronous generator.Reference [11] mainly studies the synthetic inertial response of actual PV power plants, but does not directly provide the theoretical inertia of the PV module.Reference[12] derives the equivalent virtual inertia expression of wind farms in the time domain and shows that the equivalent inertia of wind farms with virtual inertia control can be described by a curve with three-stage time-varying characteristics.Moreover, the proposed algorithm can be analogized for PV inertia evaluation.However, it requires internal control parameters of wind and PV power stations,which makes system inertia evaluation difficult.Reference [13] compares the change of the PV DC voltage to the change of the synchronous generator rotor speed and deduces the theoretical inertia of the PV single machine equipment with the DC capacitor as the energy source from the mechanism, but does not compare the simulations for the theoretical and actual inertias.Reference[14] is based on the relationship between the frequency change and frequency modulation energy of the single set or station.However, qualitati ve evaluation of the equivalent inertia of PV power stations has not been conducted.
In the evaluation method that considers the overall system as the evaluation object, using multi-node PMU measurement data to obtain the system inertia is the primary challenge.By equivalently transforming the system into a single synchronous generator, reference [15] proposes a method to estimate the system inertia based on the disturbance power and frequency change rate. [16]and [17] respectively use variable order frequency fitting and a low-pass filter to impr ove the accuracy of system inertia evaluation.Reference [18] uses the frequency of a single node value 1-s after disturbance occurrence to evaluate the inertia of PV systems controlled by virtual synchronous generators.However, this strategy requires the difference between the total mechanical and electromagnetic powers of the system, which is difficult to obtain in practice.After PV power stations are connected to the grid, the uneven distribution of the power system’s inertia intensifies, endowing the frequency with spat iotemporal distribution characteristics after the disturbance starts.In this case, the single machine equivalent approach introduces considerable error.Therefore, approaches such as considering the multi-machine equivalent or selecting part of the nodes according to a specific benchmark for the system equivalent after partitioning have been proposed.Reference[19] uses the multi-node inertia weighting method to calculate the regional inertia and further obtains the inertia level for the United Kingdom.Reference [20] directly selects the maximum number of possible frequency sampling points and estimates the system inertia based on the average value of the frequency change rate.However,this method requires a significant amount of data and lacks theoretical basis.Reference [21] determines the system frequency sampling point by leveraging the inertia center to evaluate the overall system inertia, but the accuracy of this method for the evaluation of multi-machine complex systems is yet to be verified.Among these, the main issue is that traditional methods using multimachine equivalence to evaluate inertia require a significant amount of data, which can be challenging to obtain.
In methods that apply the concept of multi-machine equivalence to evaluate system inertia, partitioning based on network topology and geographical loca tion is commonly used [22].In these methods, researchers mainly use k-means, spectral, and hierarchical clustering to partition the power system, among which the k-means clustering method is the most widely applied.Reference [23]proposes a partitioning strategy for new energy power systems based on system clustering.The strategy first analyzes the difference in inertia between new energy devices and synchronous generators, constructs a node inertia response model, and reduces the dimensionality through principal component analysis.Consequently, the system clustering method is applied to cluster and partition nodes,which is suitable for power systems wh ere new energy devices and synchronous generators coexist.Reference[24] proposes a partitioning method to dynamically estimate the frequency regulation capability of power systems at multiple time scales.However, the demand for real-time data and complex algorithms may limit its applicati on in practical systems.Reference [25] proposes a real-time partitioning method that considers the spatiotemporal distribution characteristics of frequency response, and calculates the frequency curve trend and numerical approximation distance with hierarchical and k-means clustering algorithms.In general, the k-means method is widely used in the partitioning of power systems.Setting appropriate partitioning targets ensures that the points within one region have similar frequen cy characteristics,which allows for a more accurate evaluation of the regional inertia.Nevertheless, applying the partitioning results to evaluate the equivalent inertia of PV power stations needs to be studied further.
In light of the shortcomings of current approaches, an innovative evaluation method tailored for PV power stations is introduced in this paper.The method enables evaluating the equivalent inertia of multiple PV devices based on regional data.The main contributions are summarized as follows:
The formula for the equivalent inertia of PV power stations unde r virtual inertia control is derived.
A method to quantify the total inertia of multiple PV power stations based on measurements of the synchronous generator frequency after a disturbance is proposed.
Based on system partitioning, the amount of data required for total inertia evaluation of mult iple PV power stations is further reduced, facilitating practical applications.
The proposed method pioneers a two-step process: initially, it quantifies the inertia of one area utilizing regional data; subsequently, it isolates the inertia contribution from generators in the area to deduce the equivalent inertia of total PV devices.The simulation outcomes demonstrate the accuracy of the proposed method, demonstrating its practicality in systems with multiple PV power generations.
1 Definition of inertia for PV power stations and power systems including PV power stations
1.1 Theoretical inertia of PV power stations
To investigate the equivalent inertia of PV power stations, it is first necessary to derive its theoretical expression.The common two-stage virtual inertia control topology for PV power stations is shown in Fig.1 [26].

Fig.1.Block diagram of two-stage virtual inertia control for PV power stations.
Inthe diagram,Kdisthe PV virtual inertiacontrol coeffici ent,TPis the low-pass filter time constantwithin virtual inertia control andV dcrepresents the frequency of center of inertia (COI), whichis approximately equal to the frequency of the PV connection point.To enable inertia response in the PV power station without additional energy storage, curtailment control is introduced as an energy source in MPPT control of the boost converter circuit.The frequency of the COI is used as feedback, and the reference value of the PV device power output is mainly decided by the virtual inertia control coefficient, thereby changing the PV output instantaneously after a disturbance.After conversion to the rated capacity, the duty cycle d can control the output of the boost converter circuit to the DC capacitor voltageV dcthrough PI control.Therefore, the actual power change of the PV device ΔPviris based on the control of the PV inverter voltage[27].
In this process, although there is a certain delay in the boost and inverter circuits, compared to the inertia response and electromechanical transient response process, the response speed of the power electronic converter is significantly faster [28].Thus, the dynamics of the converter can be neglected,and ΔPvir is approximately equal toΔPref.In summary, when the PV curtailment rate is constant, the additional power generated by the PV power station under virtual inertia control after capacity conversion can be expressed as (1).
In (1), ΔPvir srepresents the power variation when the virtual inertia of the PV device responds based on the capacity of the PV device, f represents the frequency at the connection point of the PV device,andSB and Spvrepresent the system’s rated capacity and the PV power generation’s rated capacity, respectively.Similar to the inertia of a synchronous generator, the theoretical inertia of the PV power generation is defined by the additional power generated by the PV power generation and the rate of change of frequency (RoCoF) in the PV connection point at the moment of disturbance, as shown in (2).
In (2), Hpv sis the equivalent inertia provided by the PV power station under virtual inertia control at the system’s rated capacity.In the frequency domain, by substituting (1) into (2), the theoretical inertia of the PV power generation is obtained as follows:
By performing an inverse Laplace transform on(3), the theoretical inertia of the PV power generation in the time domain is obtained, as shown in (4).
The dynamic nature of  arises from the transient interaction between the virtual inertia control loop and system frequency response.Specifically, the differentiation block and low-pass filter time constant
  in the control topology endows a time-dependent behavior to
  ,making it a variable during the initial phase of disturbance.
 can converge to a steady-state value within a short transient time τ.
The value of τdecreases when a smaller is applied.Indeed, a small value is typically adopted for
 in practical applications to avoid latency and attenuation[29].Therefore, the virtual inertia support by PV devices is assumed to be constant.
1.2 Theoretical inertia of power systems including PV power stations
In addition to the inertia of the PV power stations, the system’s inertia mainly considers the contribution of the synchronous generator.Therefore, the composition of the inertia of the power system including PV power stations is shown in (6).
In (6),  represents the equivalent inertia of the power system, and the equivalent inertia of the synchronous generators within the system
 is defined by aggregating the parameters of the synchronous generators as follows:
In (7),  represents the number of synchronous generators in the power system, and
 and
and  represent the rated capacity and inertia of the j-th generat or, respectively.Finally,by substituting(5) and (7) into (6), the theoretical equivalent inertia of the system can be obtained.In other words, to evaluate the equivalent inertia of PV power stations, it is necessary to know the system inertia as well as the generat ors’ rated inertia.This is the main theoretical foundation of the proposed evaluation strategy.Further details are provided in the next section.
2 Total inertia evaluation for multiple PV power stations
2.1 Inertia evaluation based on system data
To quantitatively evaluate the equivalent inertia of PV power stations under virtual inertia control, the system frequency response (SFR) model is introduced.This model uses a single synchronous generator model instead of the entire system to characterize the average frequency response of a power system following a disturbance.In traditional power systems, the SFR model typically includes governor, prime mover, and load equivalent models, simulating dynamic frequency changes after power imbalances.The simplified SFR model under disturbance is shown in Fig.2[30].
In Fig.2, ΔPdis the variation of power generation or load in the grid,ΔPmis the variation of mechanical power of the synchronous generator,ΔPais the power variation allocated to the synchronous generator, D is the equivalent damping coefficient of the generator, R is the governing coefficient of the governor,TR is the reheat time constant of the synchronous generator,FHis the ratio of the highvoltage cylinder of the synchron ous generator to do the work, andKmis the coefficient related to the generator power factor and the standby capacity.
After virtual inertia control is utilized, the frequency model of the power system including PV devices is analyzed and the feedback loop of the SFR model of the PV-containing power system is added, as shown in Fig.3.
Within the few seconds after the disturbance, the frequency deviation is limited such that the contribution of damping is negligible.Moreover, our focus is on the initial frequency change rate post-disturbance, which is primarily influenced by inertia rather than damping.Therefore, the damping coefficient D can be further neglected.Then,the synchronous generator aggregated inertia can be expressed as:
where the center of inertia frequencyωcoiin the SFR model is defined as follows.
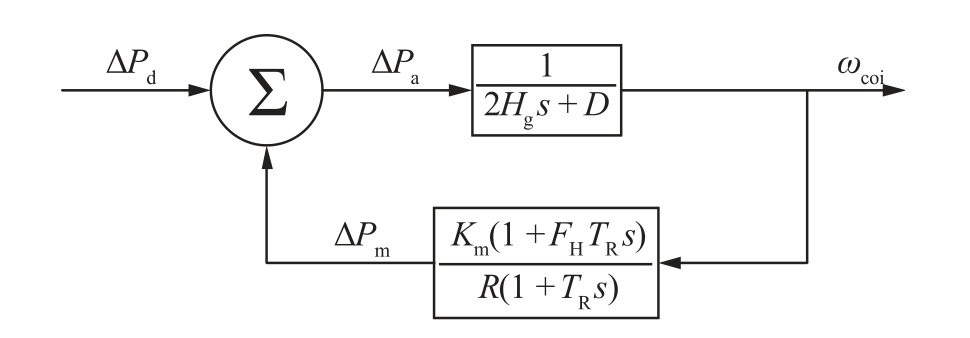
Fig.2.Simplified SFR model of convent ional power system under disturbance.
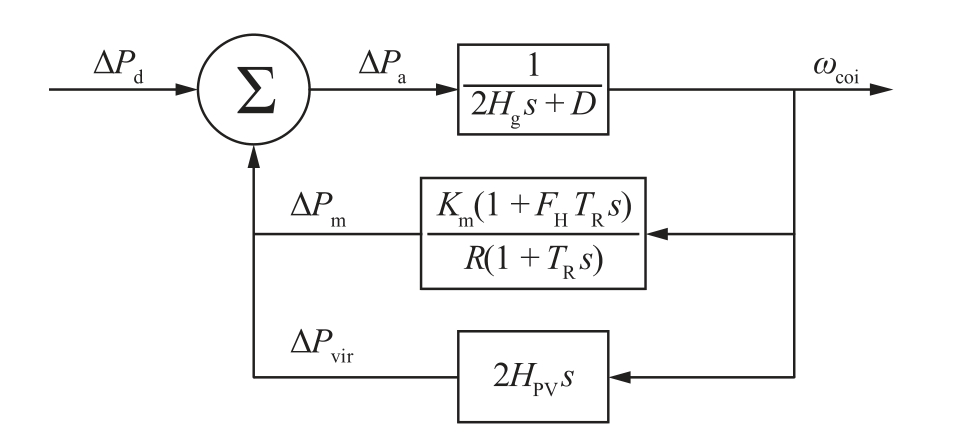
Fig.3.Simplified SFR model under disturbance of power system including PV power stations.
In (8), the theoretical value of the equivalent aggregated inertia of the synchronous generatorsHgis obtained through the SFR model, which shou ld be numerically equal to (7).Considering that the mechanical power of the synchronous generators cannot be changed abruptl y at the instant after the start of the disturbance,ΔPmis approximately 0.Therefore,based on(2) and (8), the total equivalent inertia of the PV power stations in the system can be expressed as:
where
Similar to the methods as reported in [31] and [32], the proposed evaluation method relies on historical or injected disturbance, both the location and magnitude of which are predetermined without measurement.Therefore, the measurement quantities required for this method only include the frequency of synchronous generators.Based on this,the total system inertia can be calculated according to(11), and the total inertia of multiple PV power stations under virtual inertia control can be estimated according to(10).However, this method requires frequency measurements of all synchronous generators in the system,which is difficult in practice.
2.2 Inertia evaluation based on regional data
In this section, further improvement is made by incorporating the system partitioning method, which divides the system into areas exhibiting similar frequency characteristics within themselves.Based on this, the num ber of measurements for the synchronous generator frequency can be reduced further,and detailed illustrations are given as follows.
2.2.1 System partitioning strategy
For power system including PV power stations, since the synchronous generator is the main component of the system inertia response, the clustering algorithm is first considered to partition the synchronous generators.The electrical distance is employed as a key parameter for partitioning, supported by the fact that frequency variations depend on the unbalanced power, which is distributed throughout the power system in proportion to the electrical distance.Consequently, partitioning the system based on the electrical distance between synchronous generators facilitates each region having similar frequency characteristics after the disturbance.
Based on the k-means clustering algorithm, the equivalent conductance is used as a parameter of the electrical distance.By obtaining the electrical distance between nodes in the generator, the generator transient reactance is incorporated into the system conductance matrix to form an augmented matrix,and the simplified system augmented conductance matrix can be expressed as (12) [33]:

The matrix is simplified using Kron reduction, and only the nodes within the generator are retained to obtain the generator correlation matrix.The element with i-th row and j-th column in the matrix represent the conductance from the i-th to the j-th generator node.The larger the conductance is, the closer the electrical correlation between the generators is.Thus, it can be regarded as the correlation between the i-th and j-th generators.The number of partitions is optimized using the elbow method[34] based on the sum of squared errors to confirm the optimal number of partitions.Then, the k-means clustering method is used on the correlation matrix to complete the generator partitioning.
Further, the frequency of each node of the system can be expressed in terms of the generator frequency[35].The node can be assigned to the corresponding generator and area according to the linear relationship between the node and the generator frequencies.Firstly, the network node voltages are expressed in terms of generator node voltages,as in (13).
where Ue and Unetare the voltage vectors of the potential and network nodes in the generator, respectively.R denotes the correlation matrix between the node and the potential node voltage in the generator, which is calculated as shown in (14).

If a fault occurs at node k, ba sed on the expansion of(13) in k correlation, the fault point voltage can be expressed in terms of each generator’s internal potential.After further sim plification, the voltage and phase angle at node k can be obtained as follows.
where V k and V jare respectively the voltage amplitudes at node k and generator j.δk and δjare the phase angles corresponding to the potentials at node k and generator j,respectively.r kjis the element of matrix R that represents the voltage relationship between node k and generator j.After simplification, the voltage angle at node k can be obtained as (16).
The voltage angle can be generalized to the frequency relationship in (17).
where fk and fjare the frequencies of node k and gen erator j, respectively.
Therefore, based on the linear relationship of frequency between nodes and generators, each node in the system can be categor ized to its corresponding generator and then further assigned to the corresponding area.
2.2.2 Evaluation of equivalent inertia of PV power stations
After partitioning, the points within each area possess similar frequency characteristics, and a multi-machine equivalent method can be used to equivalent each area.There fore, the regional equivalent inertia of the area containing the PV power stations can be denoted as Harea,which contains n ga synchronous generators and n e aPV power stations.Analogously to (6), the equivalent inertia of the area including PV power stations is theoretically analyzed as (18):
where Hgais the equivalent inertia of the synchronous generators in the area after aggregation at the baseline capacity of the system, as is shown in (19).
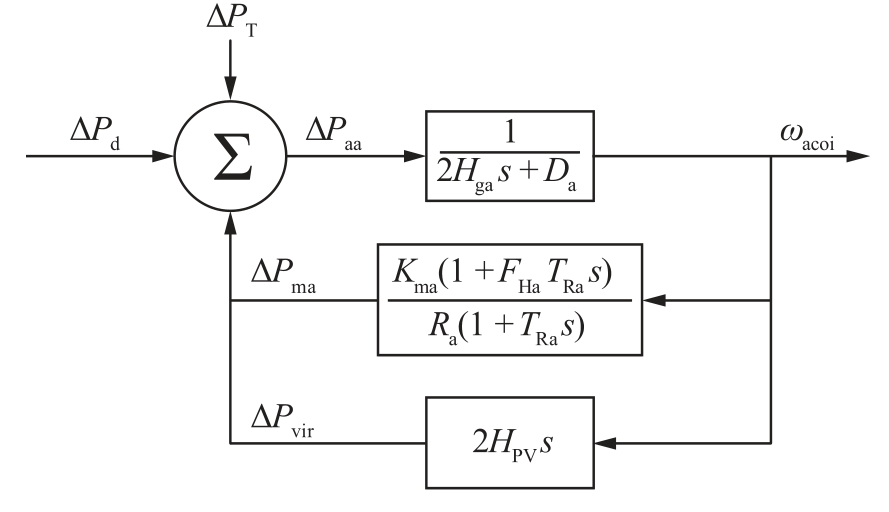
Fig.4.Simplified SFR model under disturbance of area including PV power stations.
To accurately consider the frequency response characteristics of different areas after the disturbance, the regional SFR model is used to equate the area where the PV power stations are located.In this model, the inter-area transmission line power variation is introduced as an input, as shown in Fig.4.
In Fig.4, Da, Ra, TRa, FHa, Kmarespectively represent the synchronous generator equivalent damping coefficient,governor adjustment coefficient, synchronous generator reheat time constant, high-voltage cylinder work ratio,synchronous generator power factor, and the coefficient related to the generator power factor and the standby capacity in the area where the PV is located.ΔPTis the inter-area transmission line power variation.ΔPaais the disturbance power variation allocated to the synchronous generators in the area.ΔPmais the mechanical power variation of the synchronous generators in the area.Analyzing the simplified SFR model of the area, when the synchronous generator equivalent damping coefficient is ignored, the regional synchronous generator equivalent inertia can be expressed as (20).
where ωacoidenotes the center of inertia frequency of the area, as in (21).
Analogously to (8), the theoretical equivalent aggregated inertia of the synchronous generator in this area can be obtained through the SFR model, which is numerically equal to (19).Since ΔPma 0,the actual inertia of the power system including PV power stations can be evaluated.Then,based on(2) and (20), the expression of total equivalent inertia of PV power stations based on regional data is obtained as follows.
where
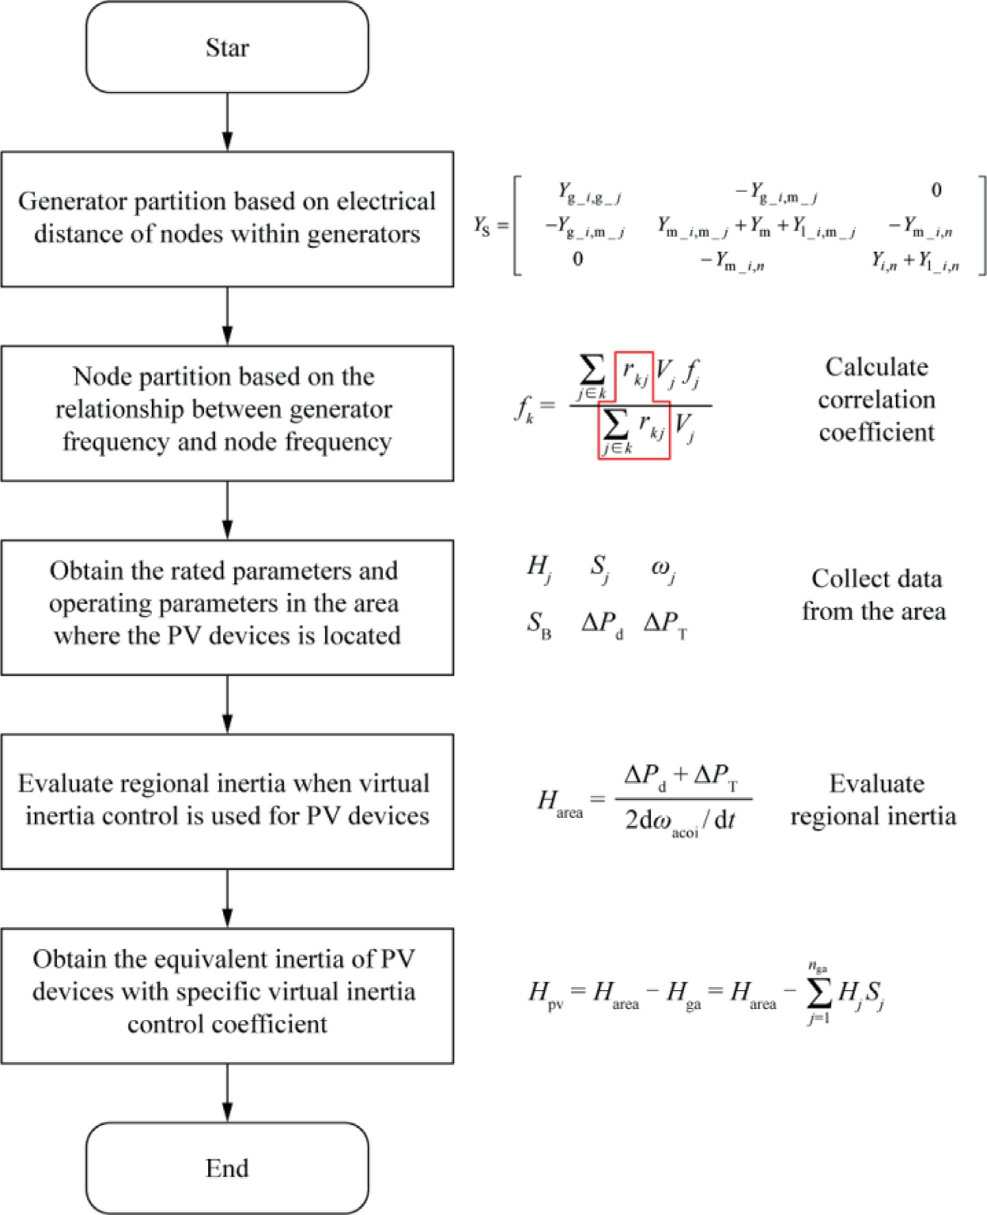
Fig.5.Evaluation strategy based on system partitioning to obtain the total equivalent inertia of PV power stations.
According to (22) and (23), the total inertia of multiple PV power stations can be evaluated based on synchronous generator data within the region and inter-area transmission line power, both of which can be readily obtained using PMUs[36,37].The overall evaluation pr ocess is shown in Fig.5.
It should be noted that this inertia evaluation strategy is not limited to PV devices.It can be applied to other energy sources which have the same or equivalent powerfrequency characteristics as the structure shown in Fig.4.For example, the proposed evaluation method is applicable to permanent magnet synchronous wind power generators and battery energy stora ge systems,which integrate inertia-emulating feedback loop and delay element[38,39].
3 Example analysis
3.1 10-machine 39-bus system including PV power stations
To verify the effectiveness of the proposed strategy, a 10-machine 39-bus system includi ng PV power stations is built in MATLAB/Simulink and shown in Fig.6.The frequency of the model is set to 50 Hz and all the loads are set to a constant power load model.The rated capacity of all generators is 900 MVA, where the inertia of generators is shown as Table 1.
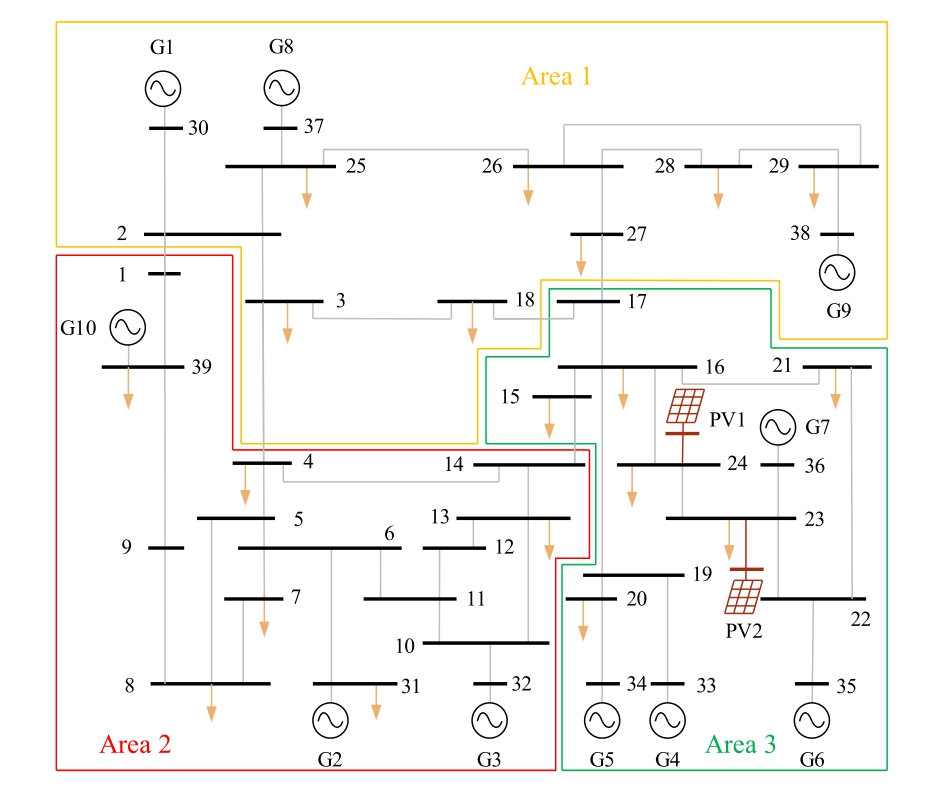
Fig.6.The topology of 10-machine 39-bus system including PV power stations.
Table 1 10-machine 39-bus system generator parameter.
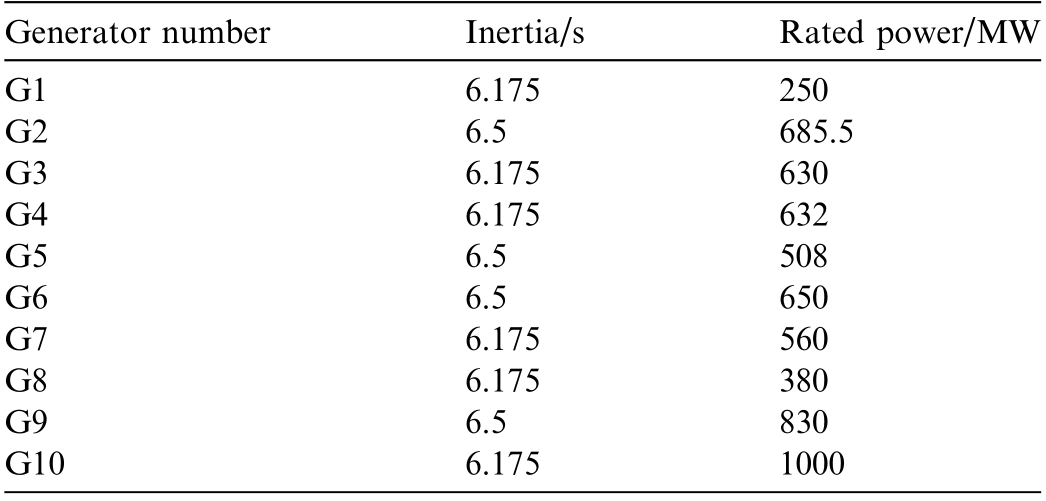
Generator numberInertia/sRated power/M W G16.175250 G26.5685.5 G36.175630 G46.175632 G56.5508 G66.5650 G76.175560 G86.175380 G96.5830 G106.1751000
To verify that the proposed strategy can simultaneously evaluate the equivalent inertia of all PV power stations in the area, several PV power stations are accessed in the area, and the working conditions are set as follows:
Case 1: In area 3, PV power stations PV1 and PV2 have access to nodes 23 and 24 at the same time.The rated capacity of both is 250 MW, using virtual inertia control and considering the low-pass filter time constant Tp 0 001s.A load disturbance of 200 MW is added to node 23 at 15 s, and the frequency measurement window is 100 ms.
Table 2 Total theoretical equivalent inertia of PV in Case 1.
PV virtual inertia control coefficient Case 1 PV theoretical inertia/s2.7784.1675.556 Kd 10Kd 15Kd 20
The PV virtual inertia control coefficients are set to different values to verify the inertia evaluation strategy.According to (5), the total equivalent inertias of PV devices HT are calculated as shown in Table 2.
Moreover, to examine the accuracy of the evaluation results, the error calculation formula is introduced:
where HC and HT are the evaluated and theoretical inertia values of the PV power stations, respectively.This formula provides a percentage error, which is a standar d measure for evaluating the accuracy of the evaluation method by comparing the evaluated inertia with the theoretical value.
3.2 Inertia evaluation results based on system data
First, the synchronous generator equivalent aggregated inertia is obtained based on the synchronous generator rated parameters, as shown in (25).
Then, when the PV adopts virtual inertia control, the overall equivalent inertia of the system is evaluated under different virtual inertia control coefficients, respectively.According to (8), the evaluation results for Case 1 are shown in Table 3, in which the inertia is all based on the baseline capacity of the system.
Based on (10), total equivalent inertia of PV is further evaluated and compared with the theoretical value as shown in Fig.7, which visually represents the comparison between the evaluated and theoretical inertia values using the method based on syst em data and the impact of virtual inertia control on the system’s overall inertia.
As shown in Table 3 and Fig.7, when the PV in the system adopts virtual inertia control, it is obvious that the larger the virtual inertia control coefficient of the PV is, the larger the system equivalent inertia is.But this method requires data from all synchronous generators in the system, and thus, the required number of PMUs is relatively large.
3.3 Inertia evaluation results based on regional data
To adopt the inertia evaluation strategy based on regional data, the system is first partitioned.Based on the kmeans clustering method, the 10-machine 39-bus system including PV power stations is divided into three areas under both operating conditions,with G1,G8,G9 belong-ing to area 1; G2, G3, G10 belonging to area 2; and G4,G5, G6, G7 belonging to area 3.Further node partiti oning is conducted, the generator frequency and node frequency relationship matrix are calculated according to (17), and the node partitioning results are shown in Fig.6.To validate the effectiveness of the partitioning strategy, the frequency response in different areas is analyzed.Specifically, the frequency of typical generators in an area and its corresponding COI frequency are compared,which are presented in Fig.8.
Table 3 Inertia evaluation results based on system data.
PV virtual inertia control coefficient Case 1 system inertia/s66.0667.46868.949 Kd 10Kd 15Kd 20
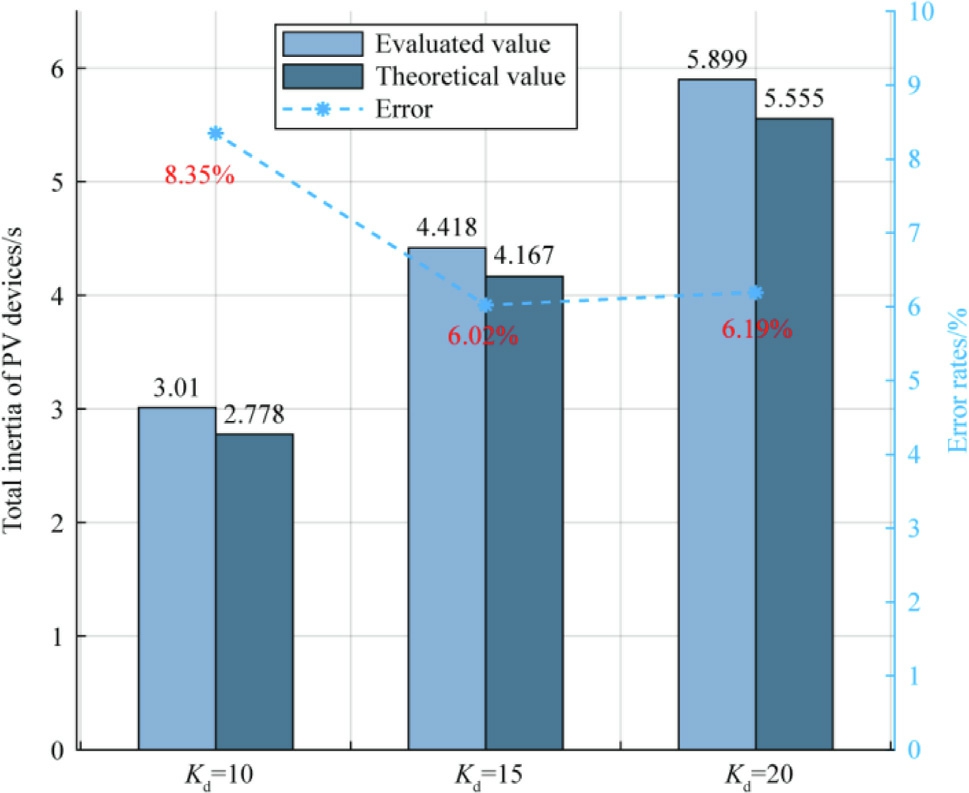
Fig.7.Evaluation results of PV power stations inertia based on system data.
As illustrated, the inertia center frequency of each area closely aligns with the frequency of the generator within the area, and three COI frequencies have a more significant difference, demonstrating the frequency distribution characteristics of the system.According to the generator partitioning and node partitioning results, the PV power stations belong to area 3,and thus,the total inertia of synchronous generators in area 3 is calculated as
When the PV adopts virtual inertia control, the overall equivalent inertia of area 3 can be evaluated under different virtual inertia control coefficients as follows.Firstly,the variation of inter-area transmission line power between area 3 and the other two areas is detected.Specifically,the PMU is set at lines 14-15,17-18,and 17-27;then,the total power change of these lines is denoted asΔPT.Moreover,the disturbance is artificially set at 200 MW in Case 1,which means the power imbalanceΔPdin this area is 200 MW.Subsequently, to obtain the center of inertia frequencyωacoifor area 3, PMUs are installed on generators 4, 5, 6 and 7, respectively, and the RoCoF of COI after the disturbance immediately can be measured.Ultimately, the equivalent inertia of area 3 under different conditions can be calculated according to (23).The evaluation results for Case 1 are shown in Table 4, in which the inertia are all based on the baseline capacity of the system.Based on(22), total PV equivalent inertia is evaluated and compared with the theoretical value as shown in Fig.9.
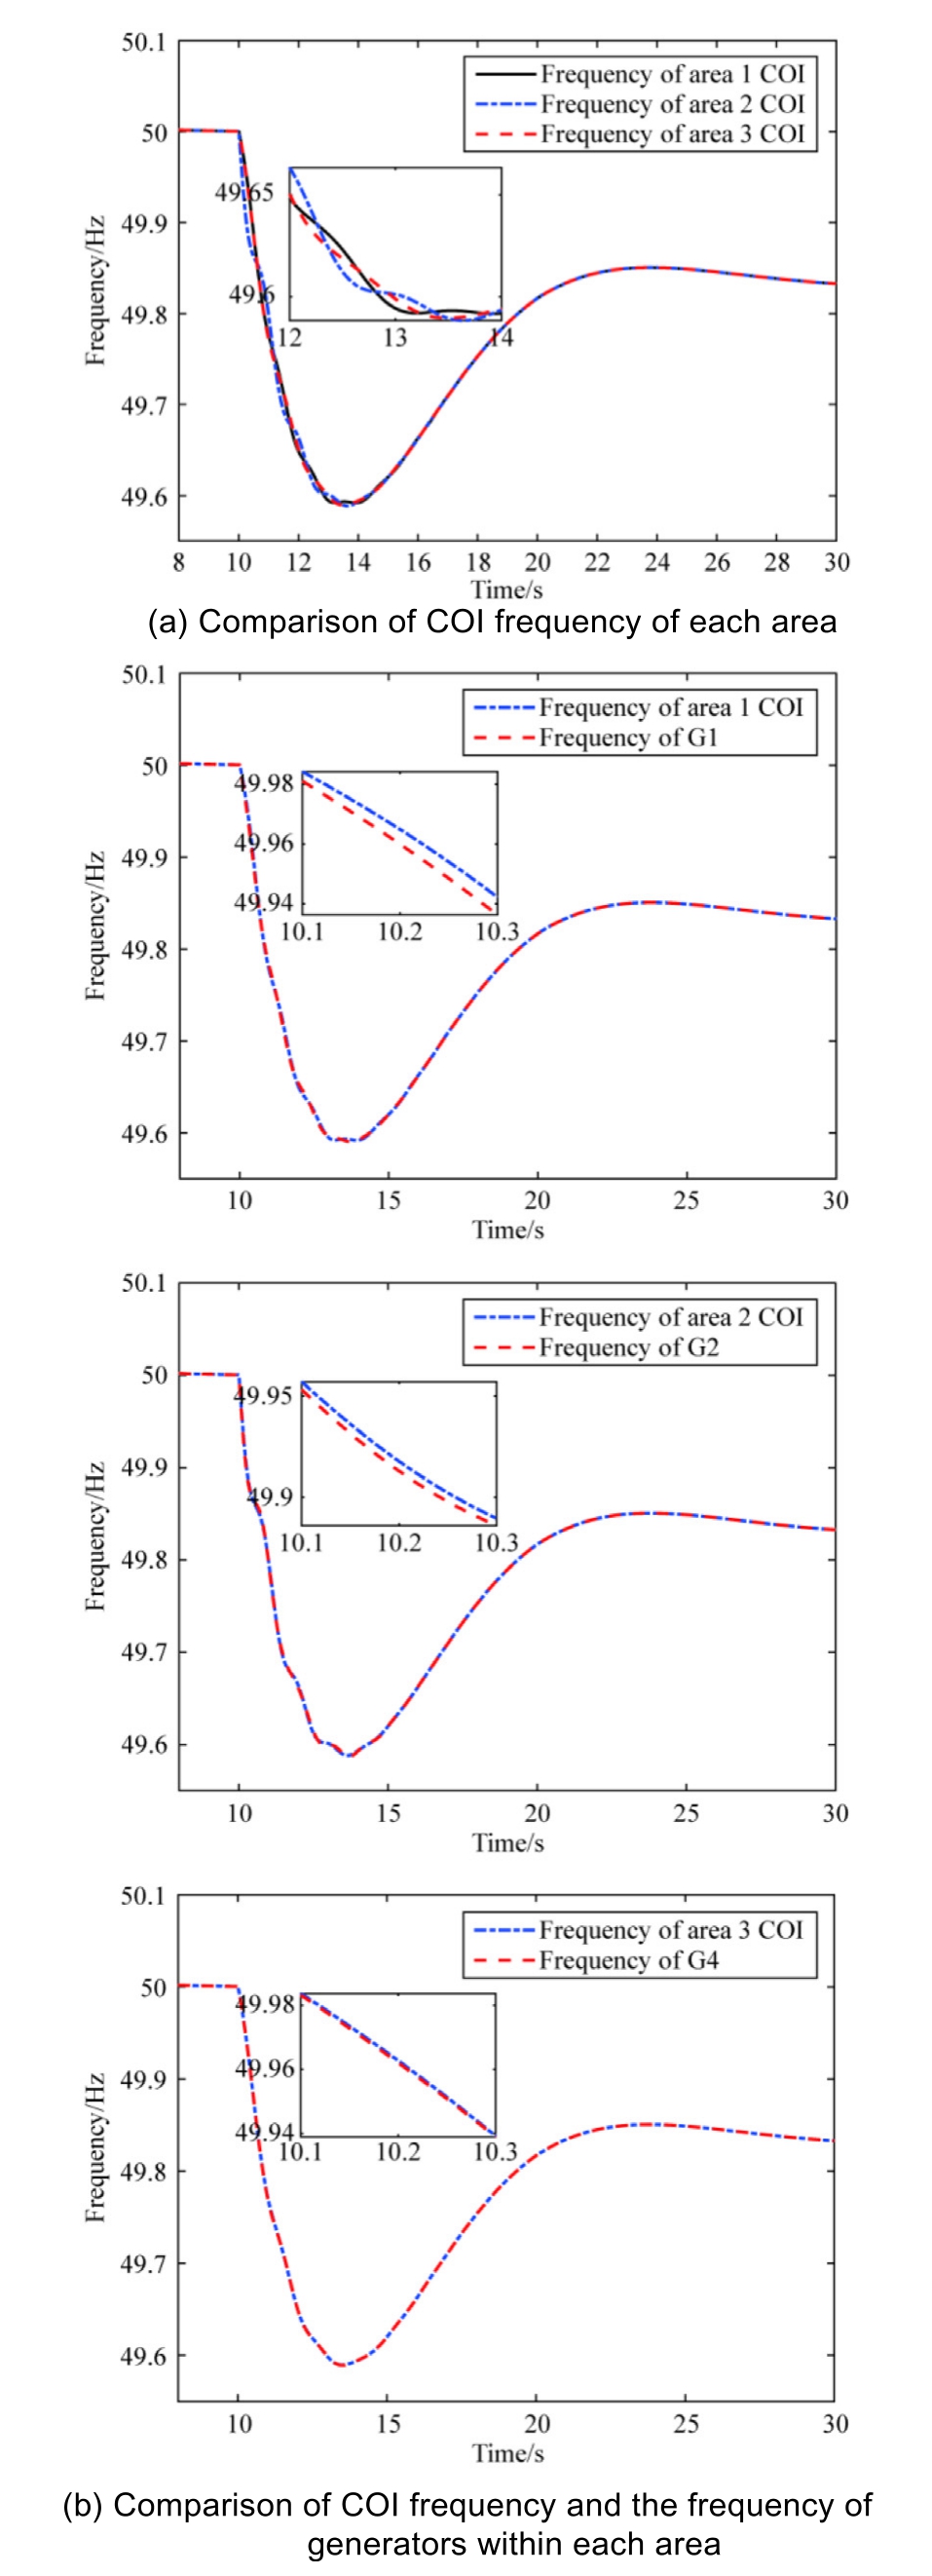
Fig.8.Comparison of COI frequency of each area and the frequency of generators within each area.
Table 4 Inertia evaluation results based on regional data in Case1.
PV virtual inertia control coefficient Case 1 area 3 total inertia/s15.24716.87118.051 Kd 10Kd 15Kd 2 0
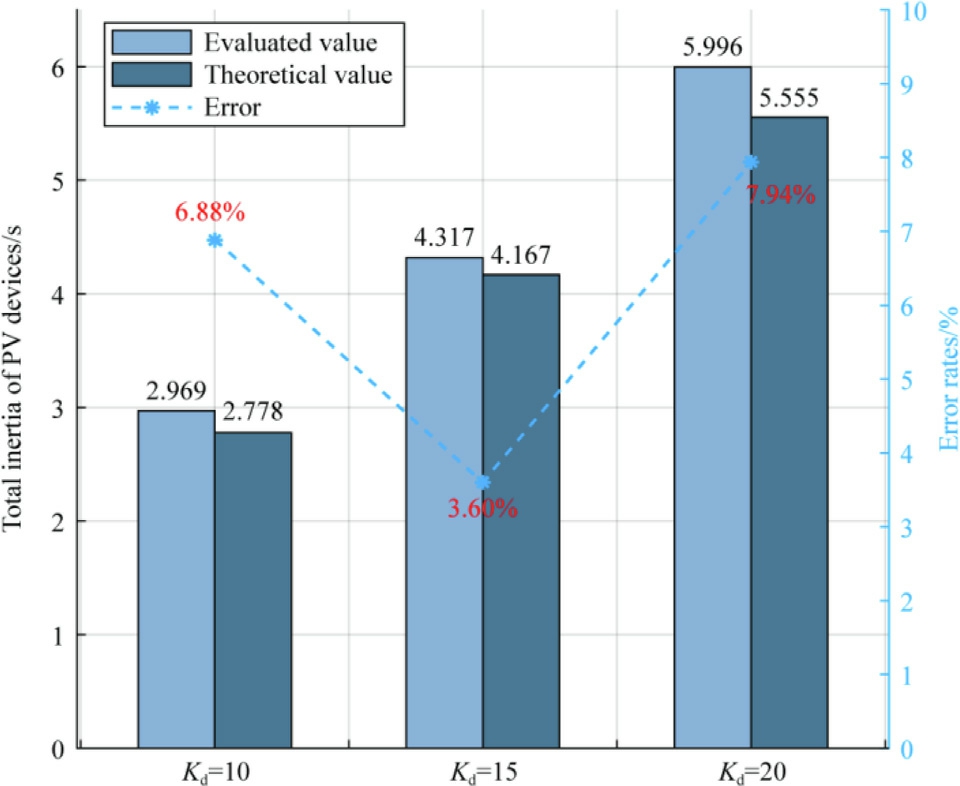
Fig.9.Evaluation results of PV power stations inertia based on regional data in Case 1.
As shown in Table 4 and Fig.9, when evaluating PV inertia based on regional data, the average error between the total equivalent inertia and the theoretical values is similar to that from evaluations based on system data,and the evaluation error can be controlled at less than 10%; this confirms the precision of the evaluation method presented in this paper.
3.4 Discussion on the merits of the method considering increasing deployments of PV devices
The primary merit of the proposed evaluation method after partitioning lies in its capability to decrease the number of required measurements.Compared to the evaluation method without partitioning, although the new measurements of inter-area transmission power are required, the overall data required by the method with partitioning will be lower due to the significantly reduced measurements of synchronous generator frequency.To substantiate this argument, another case study in the 10-machine 39-bus system including 10 PV power stations is used as an example to illustrate the benefits.
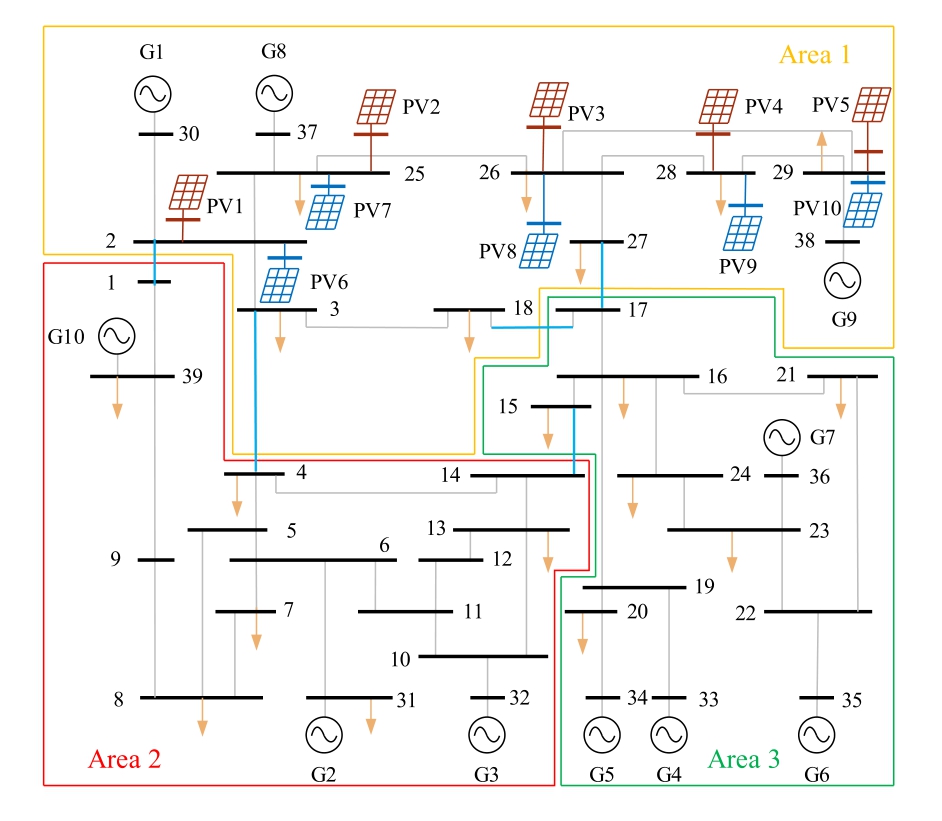
Fig.10.The partitioning results of 10-machine 39-bus system including PV power stations in Case 2.
Case 2: In Area 1, two distinct sets of PV power stations using different inertia control coefficients are added to five different buses as shown in Fig.10, and the rated capacity of every single PV power generation is 50 MW.The details of the inertia control coefficients and the corresponding PV theoretical inertias are presented in Table 5.Then, a load disturbance of 200 MW is added to node 26 at 15 s,and the frequency measurement window is 100 ms.
The total inertia of synchronous generators in area 1 is calculated as
Then, the total regional inertia is evaluated according to(23) and the results are shown in Table 6.Finally, the equivalent inertia of PV devices is evaluated based on(22) and compared with the theoretical value are shown in Fig.11.Based on the evaluation results, it can be concluded that when there are a substantial number of PV power stations in a region, the proposed method can still effectively evaluate the sum of the equivalent inertia of all PV power stations within the region.
In such a case, the traditional method would require the installation of 10 PMUs for PV inertia evaluation while the proposed method without partitioning requires PMUs to be installed at 10 synchronous generators[40].In comparison, the proposed method with partitioning only requires PMUs to be installed at three synchronous machines and four interconnection lines, indicating that seven PMU s are sufficient.The reduced number of PMUs will further increase with more deployments of PV power stations.This makes the proposed method more suitable for modern power systems wi th an increasing number of PV power stations.
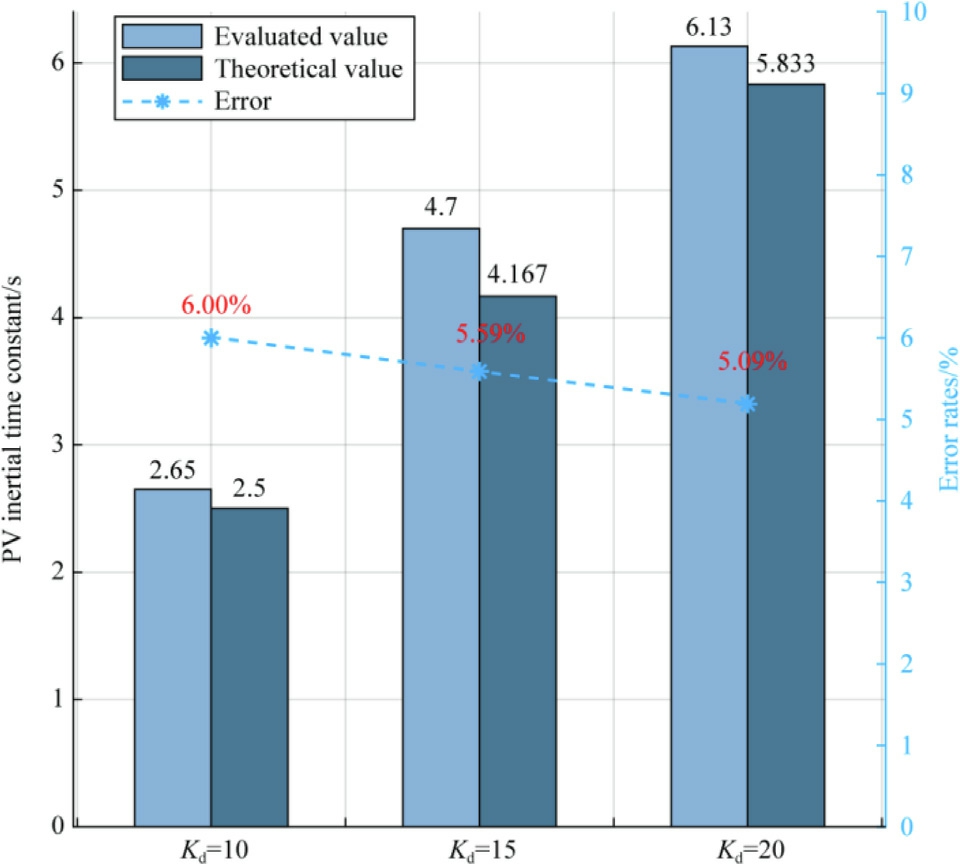
Fig.11.Evaluation results of PV power stations inertia based on regional data in Case 2.
3.5 The impact of disturbance location on evaluation results
To further investigate the impact of disturbance location on the inertia evaluat ion results, the following Case 3 is set up.
Case 3: In Areas 2 and 3, two distinct sets of PV power stations using different inertia control coefficients are added to five different buses as shown in Fig.12, and PV virtual inertia control coefficients of two sets are 18 and 24.The rated capacity of every single PV power generation is 100 MW.Then, a load disturbance of 200 MW is added to different nodes in Areas 2 and 3 at 15 s, and the frequency measurement window is 100 ms.Specifically, disturbances are randomly applied to three nodes in both Areas 2 and 3.Then, the equivalent inertia of the areas is evaluated based on (23) and the results are summ arized in Table 7.
Furthermore, the total theoretical equivalent inertia of PV is calculated based on(3).Moreover, the overall equivalent inertia evaluation value of PV is calculated according to(22) and the data in Table 7.The final summary results are shown in Table 8, and the error based on the theoretical values and the evaluated values is as follows.
Table 5 Total theoretical equivalent inertia of PV in Case 2.

PV virtual inertia control coefficientPV-1 PV-2 PV-1 PV-2 Case 2 PV theoretical inertia/s2.54.1675.833:Kd 6 :Kd 12 :Kd 18:Kd 12 :Kd 18 :Kd 2 4 PV-1 PV-2
Table 6 Inertia evaluation results based on regional data in Case 2.

PV virtual inertia control coefficientPV-1 PV-2 PV-1 PV-2 Case 2 area 1 total inertia/s21.5023.5524.98:Kd 6 :Kd 12 :Kd 18:Kd 12 :Kd 18 :Kd 24 PV-1 PV-2
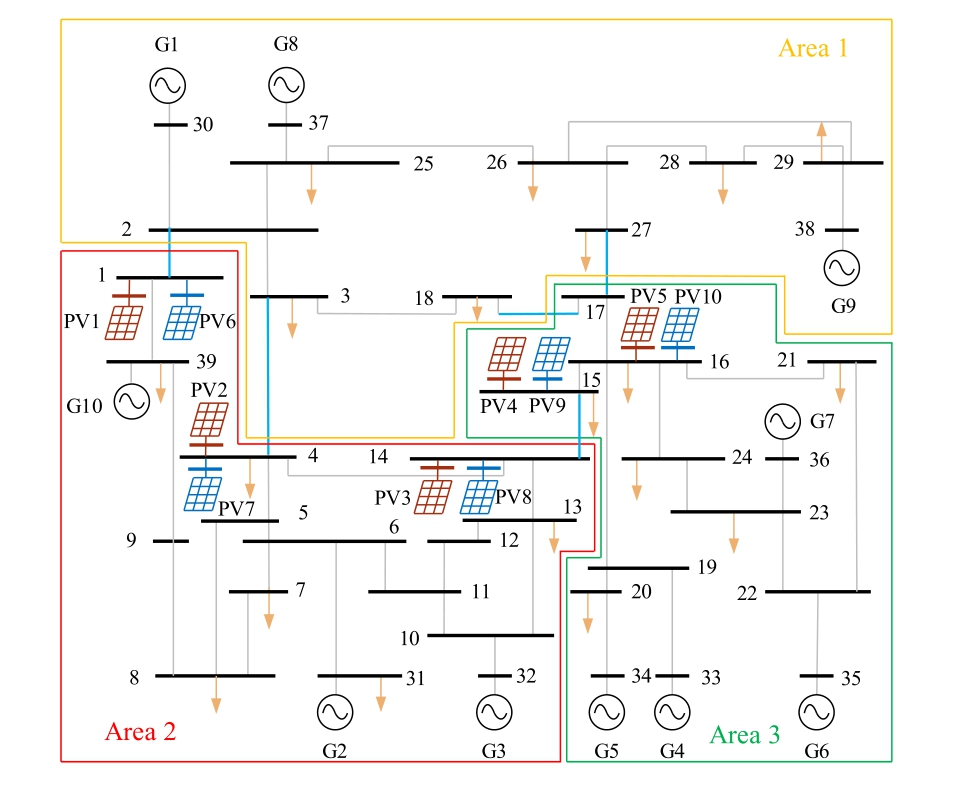
Fig.12.The partitioning results of 10-machine 39-bus system including PV power stations in Case 3.
From the above table, it can be seen that in Case 3, if disturbances are applied at different locations in Area 2,the average evaluation value of the equivalent total inertia of PV in this area is 7.37 s,with an average error of 5.28%.If disturbances are applied at different locations in Area 3,the average evaluation value of the equivalent total inertia of PV in this area is 4.94 s, with an average error of 5.85%.Based on the above data, it can be concluded that when disturbances occur at different locations, the evaluat ion results differ from the average inertia value in the area by no more than 2%.In other words, suitable evaluation accuracy can always be achieved when the disturbance is added to different locations.
4 Summary
In this paper, the total equivalent inertia evaluation of multiple PV power stations under virtual inertia control is evaluated with a small number of measurements.The main conclusions are summarized as follows:
1) Through theoretical analysis based on the SFR model, the total inertia of PV power stations can be quantitatively evaluated by determining the difference between system total inertia and synchronous generator inertia.This technique allows for the inertia evaluation of PV power stations without the need for PV virtual inertia control parameters,simplifying the assessment process for power system with plenty of PV power stations.
Table 7 Evaluated inertia of region including PV in Case 3.

Disturbance locationTotal inertia of synchronous generators in corresponding region/sEvaluated inertia of correspon ding region /s Node 618.8526.313 Node 726.245 Node 1026.101 Node 1925.3530.217 Node 2130.277 Node 2330.269
Table 8 Evaluation results of the total equivalent inertia of PV in Case 3.

Disturbance locationTheoretical inertia value /sEvaluated inertia value /srelative error Node 677.4636.61%Node 777.3955.64%Node 1077.2513.59%Node 194.6674.8674.29%Node 214.6674.9275.57%Node 234.6675.0265.40%ε
2) In contrast to traditional approaches that necessitate measurement data from each connection point at PV generators, the proposed estimation method without partiti oning achieves accurate evaluation by relying primarily on synchronous generator data of the system.
3) Compared to the estimation method without partitioning, another estimation method with partitioning also achieves accurate evaluation by using synchronous generator data within the region and the inter-area transmission line power, further reducing the required measurements.
In the future, work will be conducted to extend the evaluation method to application scenarios where more types of energy sources are included.Moreover, applications of the evaluation results in system frequency control will be investigated.
CRediT authorship contribution statement
Yujia Gu: Resources, Investigation, Writing - review &editing, Conceptualization.Jinpeng Guo: Writing - original draft, Supervision, Writing - review & editing,Methodology.Hongqiang Li: Software, Investigation, Formal analysis.Lei Zhou: Validation, Writing - review &editing.Yuanchen Dong: Visualization, Validat ion, Writing - original draft.Xin Ma: Resources, Investigation.Xueping Pan: Conceptualization, Supervision, Writing -review & editing.
Declaration of competing interest
The authors declare the following financial interests/personal relationships which may be considered as potential competing interests: Yujia Gu, Hongqiang Li, Lei Zhou, and Xin Ma are currently employed by State Grid Ningxia Electric Power Co., Ltd.The research project is funded by State Grid Ningxia Electric Power Co., Ltd.
Acknowledgments
This work was supported by the science and technology project of State Grid Ningxia Electric Power Co., Ltd.(5229D K23000C) and the project of Ningxia Natural Science Foundation 2024AAC03745 (B329DK24000S).
References
-
[1]
National Energy Administration (2024) National Energy Administration releases national electricity industry statistical data for 2023.Available via https://www.nea.gov.cn/2024-01/26/c_1310762246.htm.Accessed 26 Jan 2024. [百度学术]
-
[2]
X.Y.Chen, G.Tian, Y.Huang, et al., New power system development path mechanism design, Global Energy Interconnect.6 (2) (2023) 166-174. [百度学术]
-
[3]
M.Swadi, D.Jasim Kadhim, M.Salem, et al., Investigating and predicting the role of photovoltaic, wind, and hydrogen energies in sustainable global energy evolution, Global Energy Interconnect.7(4) (2024) 429-445. [百度学术]
-
[4]
T.F.Ma, W.Pei, Y.H.Yang, et al., A coordinated operation method of wind-PV-hydrogen- storage multi-agen t energy system,Global Energy Interconnect.7 (4) (2024) 446-461. [百度学术]
-
[5]
Z.X.Lu, J.H.Jiang, Y.Qiao, et al., A review of the analysis and optimization of generalized inertia in the new power system,Proceedings of CSEE 43 (5) (2023) 1754-1776. [百度学术]
-
[6]
X.Yan, S.Zhang, J.Jia, Analysis of power system frequency characteristics under virtual inertia control of photovoltaic equipment, Renew.Energy 41 (1) (2023) 81-89. [百度学术]
-
[7]
H.X.Zhang, Z.M.Gao, Y.J.Cao, et al., Review and prospect of research on power system inertia with high penetration of renewable energy source, Journal of Shandong University(Engineering Science) 52 (5) (2022) 1-13. [百度学术]
-
[8]
C.Ye, D.Liu, X.Yang, et al., Optimal operation strategy of high proportion new energy power system based on minimum inertia evaluation, Power System Technology 47 (2) (2023) 1-8. [百度学术]
-
[9]
H.Liu, H.Ma, Z.Xiong, et al., Virtual inertia configuration strategy based on improved fireworks algorithm, Science Technology Engineering 19 (16) (2019) 154-158. [百度学术]
-
[10]
X.Lin, Y.Wen, W.Yang, Inertia security region: concept,characteristics, and assessment method, Proceedings of CSEE 41(9) (2021) 3065-3079. [百度学术]
-
[11]
Y.C.Xu, J.X.Ren, W.Y.Song, et al., Real-time partitioning method considering the spatiotemporal distribution characteristics of frequency response in new energy power systems, Electrical Power Construction 46 (3) (2022) 1-16. [百度学术]
-
[12]
R.Villena-Ruiz, A.Honrubia-Escribano, J.C.Herna´ ndez, et al.,Assessment of the synthetic inertial response of an actual solar PV power plant, Int.J.Electr.Power Energy Syst.157 (2024) 109875. [百度学术]
-
[13]
S.Li, Q.Song, Z.Xue, et al., Inertia estimation of new energy power system with virtual inertia response of wind power,Electrical Power Engineering Technology 42 (2) (2023) 84-93. [百度学术]
-
[14]
A.B.T.Attya, T.Hartkopf, Control and quantification of kinetic energy released by wind farms during power system frequency drops, IET Renew.Power Gener.7 (3) (2013) 210-224. [百度学术]
-
[15]
T.Inoue, H.Taniguchi, Y.Ikeguchi, et al., Estimation of power system inertia constant and capacity of spinning-reserve support generators using measured frequency transients, IEEE Trans.Power Syst.12 (1) (1997) 136-143. [百度学术]
-
[16]
M.Shamirzaee, H.Ayoubzadeh, D.Farokhzad , et al., An improved method for estimation of inertia constant of power system based on polynomial approximation, in: 2014 Smart Grid Conference (SGC), 2014, pp.1-7. [百度学术]
-
[17]
P.Wall, V.Terzija, Simultaneous estimation of the time of disturbance and inertia in power systems, IEEE Trans.Power Delivery 29 (4) (2014) 2018-2031. [百度学术]
-
[18]
D.Li, T.Guo, Q.Liu, et al.,Inertia evaluation of renewable power system considering photovoltaic generation, Acta Energiae Solaris Sin 42 (5) (2021) 174-179. [百度学术]
-
[19]
P.Ashton, C.Saunders, G.Taylor, et al.,Inertia estimation of the GB power system using synchrophas or measurements, IEEE Trans.Power Syst.30 (2) (2017) 701-709. [百度学术]
-
[20]
H.Zeng, A.Su, Y.Ge, et al., A fast online estimation algorithm for regional power grid rotating inertia considering load characteristics, Power Grid Technol 47 (2) (2023) 423-436. [百度学术]
-
[21]
Li Dongdong, Zhang Jiale, Xu Bo, et al., Equivalent inertia evaluation of new energy power systems considering frequency distribution characteristics, Power Grid Technol.44 (08) (2020)2913-2921. [百度学术]
-
[22]
C.Ye, Z.He, P.Zeng, et al., Equivalent inertia ass essment and frequency control parameter setting of photovoltaic grid-con nected systems, Power Supply (2024) 1-13. [百度学术]
-
[23]
J.Sun, M.Liu, L.Deng, et al., A review of research on partitioning and decoupling state estimation in power systems,Power Syst.Prot Control 46 (10) (2018) 162-169. [百度学术]
-
[24]
P.Han, J.Guo, W.Dong, et al., Partition strategy for new energy power systems based on system clustering method, Electr.Power Syst.Automation 36 (5) (2024) 114-120. [百度学术]
-
[25]
J.X.Tian, C.Wang, Dynamic estimation of frequency regulation capability in power systems across multiple time scales, In:Proceedings of 2024 3rd International Conference on Energy,Power and Electrical Technology (ICEPET).Chengdu, China.2024.pp.532-540. [百度学术]
-
[26]
H.Yang, Q.Jia, L.Xiang, et al., A virtual inertia control strategy for two-stage photovoltaic power generation, Autom Electr Power Syst 43 (10) (2019) 87-102. [百度学术]
-
[27]
C.Zhong, S.Zhou, G.Yan, et al.,A frequency control strategy for photovoltaic power generation participating in power grid based on variable load rate, Transaction on China Electrotech Socience 34 (5) (2019) 12. [百度学术]
-
[28]
S.C.Li, C.H.Deng, Z.J.Long, et al., Calculation of equivalent virtual inertial time constant of wind farm,Automation of Electric Power Systems 40 (7) (2016) 22-29. [百度学术]
-
[29]
J.Ma, Y.Qiu, Y.N.Li, et al., Research on the impact of DFIG virtual inertia control on power system small-signal stability considering the phase-locked loop, IEEE Trans.Power Syst.32(3) (2017) 2094-2105. [百度学术]
-
[30]
Q.X.Shi, F.X.Li, H.T.Cui, Analytica l method to aggregate multimachine SFR model with applications in power system dynamic studies, Proceedings of 2019 IEEE Power & Energy Society General Meeting (PESGM), 2019. [百度学术]
-
[31]
Z.Liu, C.Hong, et al.A method for inertia evaluation of new energy power systems based on WRLS-ARMAX system identification.ChinaNationalIntellectualProperty Administration, No.CN118074167A.2024. [百度学术]
-
[32]
B.Liu, Z.Chen, Y.Wang, et al., Equivalent inertia evaluation of new power system based on slope gradient disturbance, Electr.Power Automat.Equipm.44 (3) (2024) 49-56. [百度学术]
-
[33]
F.Milano, A´.Ortega, Frequency divider,IEEE Trans.Power Syst.32 (2) (2017) 1493-1501. [百度学术]
-
[34]
F.R.Su, W.W.Mu, X.M.Zhao, et al., An improved method for dividing K-value and center initialization of clustering, Comput.Eng.49 (11) (2023) 85-93. [百度学术]
-
[35]
F.Liu, G.Xu, J.Liu, et al., Inertia distribution characteristics of power systems considering grid structure and parameters,Automat.Electr.Power Syst.45 (23) (2021) 60-67. [百度学术]
-
[36]
P.M.Ashton, G.A.Taylor, M.R.Irving, et al., Novel application of detrended fluctuation analysis for state estimation using synchrophasor measurements, IEEE Trans.Power Syst.28 (2)(2013) 1930-1938. [百度学术]
-
[37]
L.Fanglei, B.i.Tianshu, et al., Partitioned inertia estimation method based on PMU synchronized measurement, North China Electric Power University 47 (3) (2020) 19-26. [百度学术]
-
[38]
I.Pazmin˜o, S.Martinez, D.Ochoa, Analysis of control strategies based on virtual inertia for the improvement of frequency stability in an islanded grid with wind generators and battery energy storage systems, Energies 14 (3) (2021) 698. [百度学术]
-
[39]
J.Hu, Z.Chen, M.Cheng, Virtual inertia emulation in battery energy storage systems for frequency regulation:a delay-dependent stability analysis, IEEE Trans Sustain Energy 11 (3) (2020) 1295-1305. [百度学术]
-
[40]
Z.Zou, T.Bi, et al.A method for evaluating the equivalent inertia of wind-solar storage power station grid-connection points based on energy perspective, china national intellectual property administration No.CN202111547793.5.2022. [百度学术]
Fund Information

