Recommended articles:
-

-
Global Energy Interconnection
Volume 8, Issue 5, Oct 2025, Pages 891-904
Bayesian optimized support vector regression with a Gaussian kernel for accurate prediction of the state of health of lithium-ion batteries used for electric vehicle applications☆
Abstract
Abstract The state of health SoH of lithium ion batteries plays a predominant role in ensuring the safe and reliable operation of electric vehicles.In this, a novel SoH estimation approach using support vector regression with a Gaussian kernel optimized using the Bayesian optimization technique (BO-SVR with a Gaussian kernel) was proposed.Unlike, traditional approaches that use the internal resistance, and battery capacity as input parameters, this study utilized the equivalent discharging voltage difference interval and equivalent charging voltage difference interval, as they capture the dynamic voltage characteristics associated with the battery degradation.The model was simulated using MATLAB 2023a.The mean absolute error,R2,root mean squared error,and mean squared error were considered as performance indicators.The simulation results indicated that the proposed BO-SVR with a Gaussian kernel model had superior performance to other kernel SVR and Gaussian Process Regression models, with a reduced RMSE of 0.0082, thus demonstrating its potential to predict the SoH more accurately.
0 Introduction
Climate change is a global concern, with greenhouse gas emissions reaching 37.4 Gt in 2023, an increase of 1.1%compared to that in 2022.China and India are major emitters, accounting for 35% and 8%, respectively.The transportation sector has experienced the most significant growth in emissions, emitting nearly 240 Mt of CO2 globally,of which India contributes 19 Mt CO2[1].Figs.1 and 2 depict the global rise in CO2 from 2000 to 2023 and the CO2 emissions from the transportation sector in 2023,respectively.The United Nations Climate Change Conference (COP26) in Glasgow addressed energy crisis challenges, with governments, businesses, and scientists discussing net-zero emission and Par is Agreement goals.At this conference India announced its goal of reaching net-zero by 2070[2].Electric vehicles (EVs) and renewable energy sources are promising solutions to the energy crisis and may provide a 40%reduction in greenhouse gas emission [3].EV development contributes to the achievement of sustainable development goals by promoting cleaner energy, combating climate chan ge, improving public health,creating sustainable cities,and fostering innovation[4].In 2023, EV sales reached 14.18 million units, up by 35% from that in 2022 [5].
Deploying electrification in transportation requires effi-cient energy-storage systems.In an EV, the conversion,storage, and management of energy are significantly aided by the lithium-ion battery (LIB).Compared to other widely used secondary batteries, such as lead-acid,nickel-chromium, and nickel-metal hydride batteries,LIBs have an extended battery life,greater specific energy,and greater power density [6].As of 2020, LIBs have an energy density of 450 Wh/L, up from 110 Wh/kg(9 Wh/L) in 2010; and research is currently being conducted to increase this value to 550 Wh/kg(1200 Wh/L) by 2030.It is anticipated that in 2031, the demand for LIBs will increase by 26% over that in 2021,reaching a market value of$70 billion by 2026.The utilization, of LIBs in EVs, as well as their recycling and disposal,have garnered significant attention owing to their unprecedented demand and high production costs [7,8].
Battery retirement occurs when an (EV’s) capacity falls below 80% of its average capacity, which is generally regarded as insufficient to satisfy the energy and power requirements of EVs.Conversely, decommissioned batteries still serve a vita l function in energy-storage systems with reduced power and energy requirements.The applications of these decommissioned batteries in power systems include load-shifting and frequency management [9].
0.1 Background study
Monitoring the state of health (SoH) of LIBs is an essential operation that must be performed to guarantee the dependable and secure operation of battery systems.Accurate a ssessment and prediction of the SoH are challenging because it’s aging path-dependent nature and various influences[10].Battery aging is often described by the term ‘‘SoH,” which can be characterized by internal resistance, cycle, and battery capacity and quantified as a pe rcentage.Cycle capacity loss and increased internal resistance are the primary symptoms of battery aging[11].Concurrently, the decrease in capacity and increase in resistance are influenced by different factors [12], making it more challenging to determine the SoH appropriately.The loss of active materials and lithium inventory are the main reasons for capacity loss, a result of the many side reactions that occur during battery operation.As the electrical contact inside the porous electrode breaks down and the passivation layer on the surface of the active particles increases, the internal resistance of the battery gradually increases.Internal resistance measurement is complicated because the test results may be influenced by the electrochemistry, load, and temperature.Capacity is the most commonly used metric in research, because it can be employed to visually assess a cell’s storage status and represent the external effects on batteries more accurately [13].
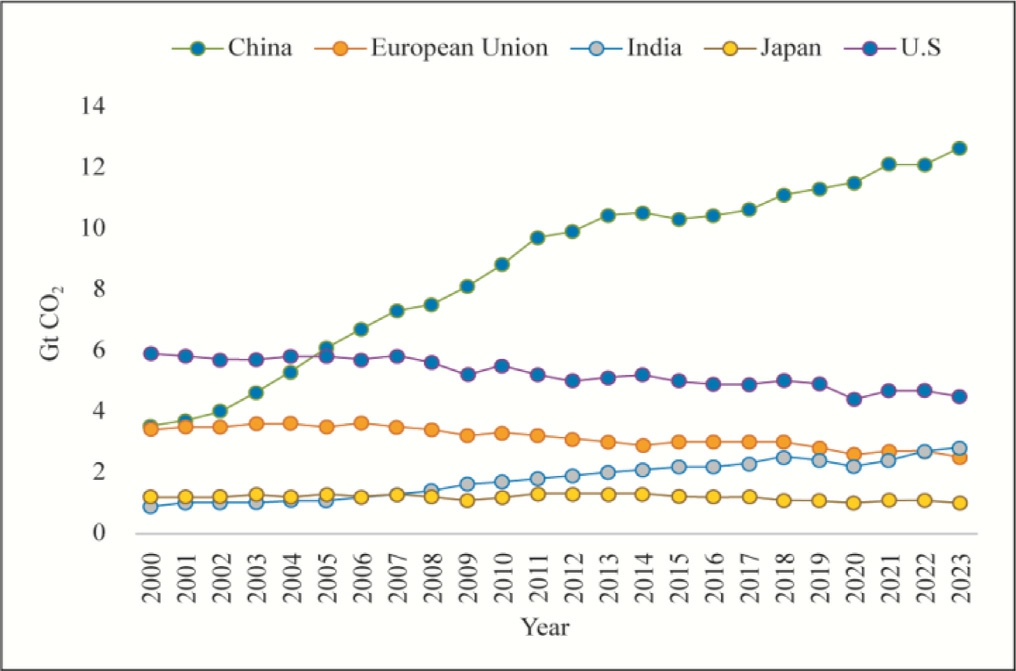
Fig.1.Global CO2 emission trend from 2000 to 2023 [1].
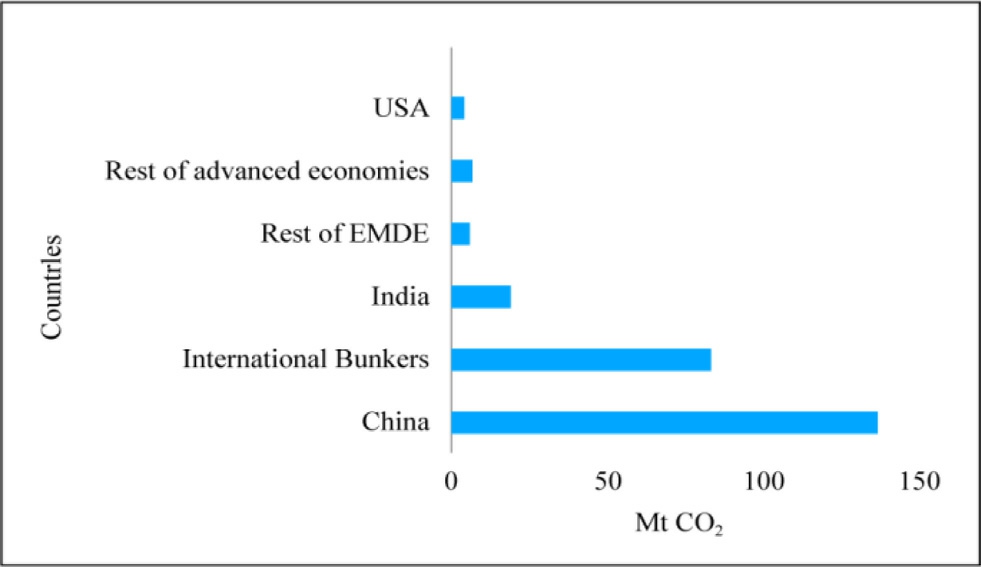
Fig.2.Global CO2 emission trend in the transportation sector in 2023[1].
Recently, various methodologies, including filtering techniques and model-based approaches, have been presented to evaluate the SoH of (LIBs).The model-based approaches include both the equivalent circuit and electrochemical models.Electrochemical models can accurately simulate the diverse mechanisms of battery degradation over time.The accuracy of the model parameters is essential for ascertaining the precision of its estimations.Consequently, the model parameters cannot be modified in realtime during battery aging and other processes,resulting in diminished estimation accuracy [14].The development of models for complicated non-linear systems also constitutes a significant limitation of model-based approaches.To address this issue, filter-based SoH assessment methods utilizing Kalman [15], Hα [16], and Particle filters (P Fs)[17] have been developed.In [18], the SoH was evaluated using an extended Kalman PF, incorporating battery aging as a variable for SoH estimation..The impact of the seasonal temperature and driving distance on the evaluated battery was examined.The integrated Kalman Filter
Least square - Gated Recurrent Unit model was proposed by Hang et al.[19], wherein KF-LSR assessed the internal resistance of the battery and the GRU evaluated the SoH of the battery.In [20], Xu et al.estimated the SoH using a hybrid XGBoost-KF methodology.Principalcomponent analysis was employed in the proposed methodology to mitigate data redundancy.The primary disadvantage of the Kalman-filter-based technique is the assumption that the system is linear and subject to Gaussian noise.In practice, the system is nonlinear an d also exhibits non-Gaussian noise.The estimation of the SoH using the integration of a PF with a genetic algorithm(GA) and regression filter was proposed by Liu et al.[21].Although the application of PF yields high accuracy in predicting the SoH of batteries, a significant restriction is that a decrease in the number of particles diminishes the estimation accuracy.
Table 1 Comparison of data-based SoH estimation methods.

ReferenceAlgorithmsInput parameters[34]Gaussian process regressionVoltage, current, and temperature[35]Support vector machineVoltage, current, and temperature[36]Extreme machine learningVoltage, current, and temperature[37]Deep learningVoltage, current, and temperature[38]Hybrid algorithmVoltage, current, and temperature ProposedBO-SVR with Gaussian kernelEquivalent discharging voltage difference interval (EDVDI) and equivalent charging voltage difference interval (ECDVI)
Hence, recently, numerous articles related to datadriven approaches have been publis hed,including support vector regression (SVR) [22], Gaussian process regression(GPR)[23,25], extreme learning machine(ELM)[24], long short term memory(LSTM)[26,27], and Gated Recurrent Unit [28].Because these models utilize readily available battery data, such as the voltage, current, and temperature obtained during the charging and discharging processes they do not require knowledge of electrochemical mechanism of the battery.These algorithms build a relationship between the degraded feat ures and capacity degradation to estimate the SoH with high accuracy.The articles proposing the estimation of the SoH of a battery using datadriven approaches are listed in Table 1.As shown, it is evident that the battery voltage and current are the main input features of battery degradation.Initial ly, SoH estimation using a deep convolutional neural network(DCNN) was proposed in [29], which considered the battery voltage and current from a particular charging cycle as input parameters for esti mating the SoH K-nearest neighbor based SoH estimation was proposed in[30], with five charge-related parameters as input variables, and the SoH was estimated with a reduced root mean squared error (RMSE) of 2%and maximum error <5%.Recurrent neural network (RNN)-based SoH estimation was proposed in [31] because battery aging occurs over time and can be represented in a time-series analysis.In [32],DCNN-based SoH estimation was proposed, which estimated the battery discharge capacity related to the battery SoH with better accuracy.SVR-based SoH estimation considering battery capacity and internal resistance as the input parameters and terminal voltage as the target variable was proposed in [30].The combination of SVR+ GA + Adaptive unscented Kalman filter (AUKF) was used to predict the SoH in[33], where the AUKF was used to update the noise, and the GA was used to tune the SVR parameters.
0.2 Motivation
Although, existing data-driven approaches can estimate the SoH of LIBs with better accuracy, they still face some constraints.A major drawback is the application of singlekernel models, which fail to fully exploit the potential of the considered algorithm.Multiple factors, namely, input parameters, model hyperparameters, activation functions,and training procedures, have a significant impact on the estimation of the battery SoH.Among these, accurate input parameters and optimal hyperparameters are highly important for enhancing accuracy.The selection of an appropriate hyperparameter helps to overcome data under fitting and overfitting and reduces the computational burden.Conventionally, a trial-and- error- based hyperparameter selection is implemented, which is unreliable and time-consuming.Hence, the implementation of an appropriate hyperparameter-tuning algorithm is important.
In many studies, the rated capacity has been used as a SoH indicator.However, it is challenging to determine the maximum delivered capacity of an operational battery.This is because the cell is unlikely to operate entirely charged or discharged.This limitation necessitates the identification of an appropriate input parameter with a high correlation with the target SoH.As the battery ages,its internal resistance increases, leading to a reduction in charge retention capability.The equivalent charging voltage difference interval (ECVDI) and equivalent discharging voltage difference interval (EDVDI) are more of representing the dynamic voltage characteristics associated with the battery degradation and providing insights into the internal chemical processes than voltage and current measurements.Hence, the consideration of these factors as input parameters can increase the estimation accuracy by incorporating information related to the dynamic behavior of the battery.
0.3 Contribution of the study
In this study, the ECVDI and EDVDI were considered as input parameters to estimate the target SoH because of their higher co rrelation with battery degradation compared to static voltage and current measurements.
Bayesian optimization (BO)based hyperparameter selection was implemented to overcome the constraints of conventional trial-and-error methods by intelligently exploring the hyperparameter search space.
A comparison of the performance of various machine learning (ML) algorithms, namely, SVR and GPR, with different kernel functi ons in estimating the battery SoH was conducted for a standardized dataset.
The remainder of this paper consists of six sections.The concept of SoH prediction is explained in Section 2.Section 3 delves into ML algorithms, and Section 4 covers the methodology of the proposed work.Section 5 presents the experimental findings and discussion.Finally,Section 6 concludes the paper.
1 SoH of lithium-ion batteries
The SoH of a battery progressively declines, with a decrease in its capacity and an increase in its internal resistance owing to charging and discharging periods and the accumulation of sheltering time.Ther efore, the definition of the SoH is based on three factors: the capacity of the battery, lithium-ion concentration in the battery, and internal resistance.
1.1 Capacity-based SoH definition [39,40]
The SoH of a battery based on battery capacity is defined as
where,
QMaximum= maximum available battery capacity, under rated operating conditions.
Qrated= rated capacity of the battery
The SoH varies greatly with temperature and measurement current variations.
1.2 Internal resistance-based SoH definition [41,42]
The SoH of a battery based on internal resistance is defined as
where,
Re= internal resistance at the end -of -life
R= current state intern al resistance
Rn= new internal batte ry resistance
The internal resistance is an important parameter that represents battery aging.An increase in the internal resistance of a battery indicates a decrease in the battery health.
1.3 Lithium-ion concentration in the electrode-based SoH definition[43]
The lithium-ion concentration in a battery varies owing to an electrochemical reaction.Hence, the SoH of a battery based on the concentration of lithium ions in the electrode is defined as
where,
Q0= lithium-ion concentration after multiple cycles
Q= nominal capacity
2 Machine learning algorithm-based SoH prediction
ML is a subtype of artificial intelligence that allows machines to learn from data and experience.Hence, they can identify patterns and make accurate predictions.The utilization of data for making predictions and classifications in systems offers significant benefits, especially in situations where the models demonstrate substantial nonlinearity and the task of generating system equations is a rduous and time-consuming.Regression analysis is a form of supervized ML that uses statistical concepts to predict the correlation between a dependent target variable and one or more independent input variables.This study utilized SVR and GPR.
2.1 Support vector regression
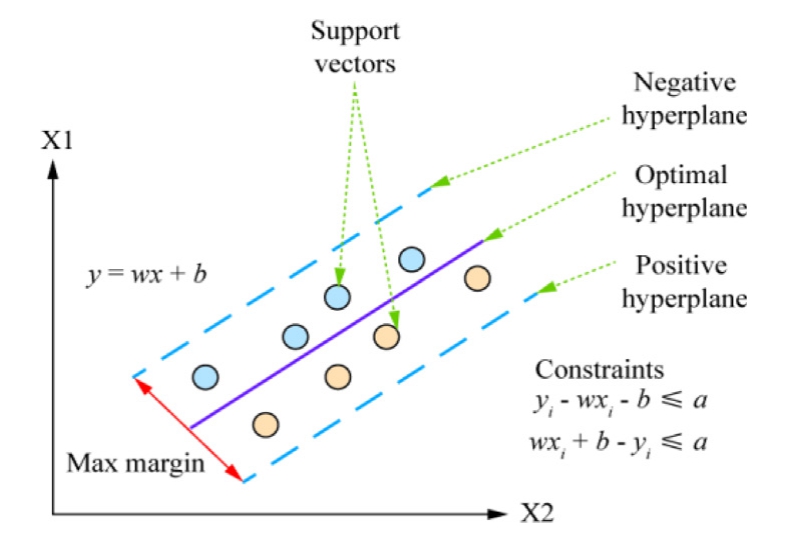
Fig.3.Support vector machine modeling [44].
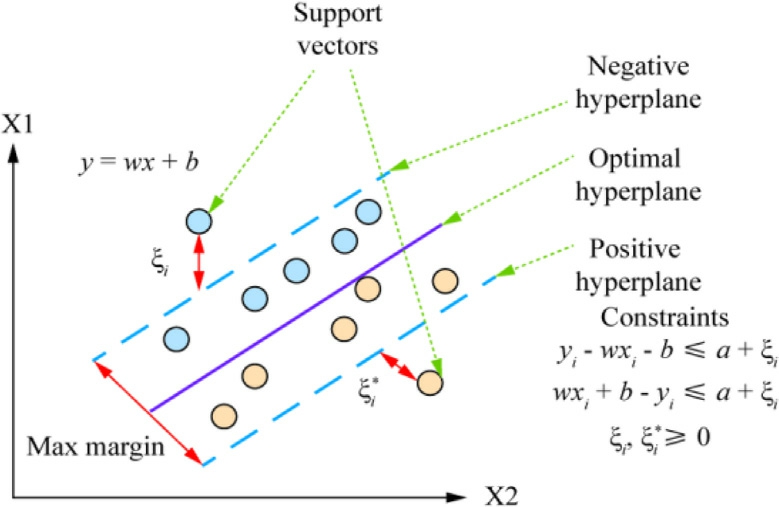
Fig.4.Support vector regression modeling [44].
Table 2 Kernel functions of SVR.

Linear Polynomial Gaussian Radial Basis Function Sigmoidal k xi xxi x k xi xtanh γxi x θ k xi xxi x 1 d k xi xexpxix σ 2 2 k xi xexp γ xi x 2
Fig.3 shows that the support vector machine (SVM)classification algorithm maximizes the distance between the training data and the decision boundary.To achieve a precise classification, binary classification problems are solved by utilizing the concept of a separation hyperplane and determining the maximum separation margin.The support vectors define the optimal hyperplane.The primary characteristic of an SVM is the utilization of the kernel trick, which employs a kernel function ϕ to transform data into a higher-dimensional space.This trans formation facilitates enhanced differentiation between distinct classes.The mapping in this approach uses a range of kernel functions, including linear, polynomial, quadratic,exponential, sigmoidal, and Gaussian functions [44-47].
For a given training dataset,![]() with the constraintsxm Rn ym1 1 ,the inequalities satisfied by the SVM are
with the constraintsxm Rn ym1 1 ,the inequalities satisfied by the SVM are
SVR is a variant of the SVM that incorporates a tolerance margin ε around a function.It aims to identify the optimal ε value that approximates a continuous-valuedfunction and minimizes the prediction error, as shown in Fig.4.SVR employs an ε-insensitive loss function, which imposes a penalty on predictions that deviate more than ε units from the desired output.The choice of an adequate kernel function is crucial for determining SVR performance.SVR offers a range of kernel functions, including linear,Gaussian,sigmoidal,linear,polynomial,and radial basis functions, as listed in Table 2.
Table 3 Classification of the GPR covariance function.
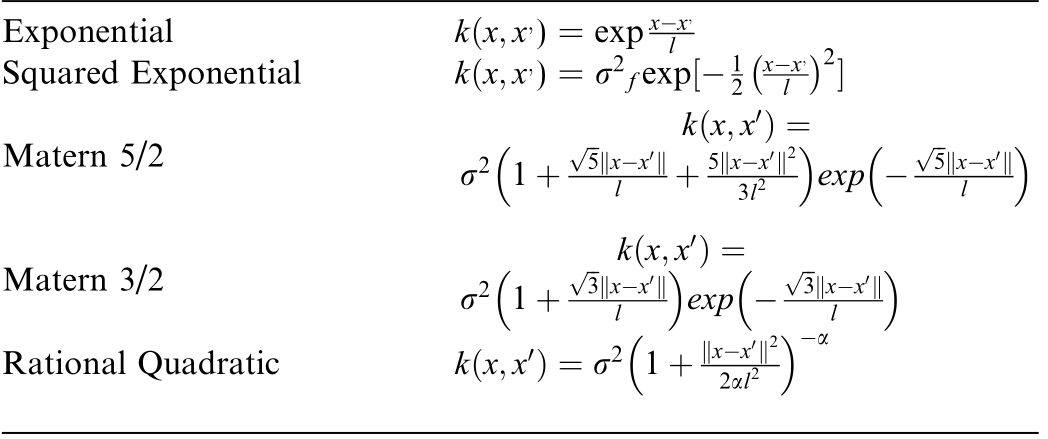
Exponential=Squared Exponential)=Matern 5/2 k x x ) expxx k x x σ2 f exp 1 l 2 x xl 2 k x x σ2 15xx l 5 x x 2 3l2 exp5xx l Matern 3/2 Rational Quadr atic k x x σ 1lexpl 23 x x3 x x 2α k x xσ2 1xx 2α l2
2.2 Gaussian process regression
Regression, classification, and uncertainty quantification are just a few statistical and ML tasks that use a Gaussian process (GP), which is a non-parametric and probabilistic model.GPs are versatile and effective techniques for modeling intricate relationships in data and producing predictions with quantifiable uncertainty.GP regression assumes that the data points are generated from a multivariate Gaussian distribution, and the objective is to estimate this distribution.Mathematically, GPR can be represented by the following equations [48-51].
Assume, X1.Xn as input data variables and Y1.Yn as output data variables.X and Y are elements of a set of real numbers.In GPR, the input and output variables are connected by a function f, which is constructed using the mean (μ) and covariance function (k).Many kernels are utilized in GPR,namely,Matern 3/2 exponential,rational quadratic, squared exponential, and Matern 5/2.The formulas for several covariance functions are presented in Table 3.The distribution function ‘‘f” for a collection of test sites (X*) is expressed as
For the kernel Mater n 5/2,

where,
k x x= the kernel that calculates the proximity between two input variables x and 
σ2= kernel scale or variance parameter.A higher kernel scale indicates greater variance.
l2= kernel length or charact eristic length
 squared Euclidean distance
A Bayesian interface is used to calculate the distribution of ‘‘f”.Initially, the posterior distribution of f is calculated as
where,

Using the calculated posterior distribution, the posterior predictive distribution can be estimated and applied for predictions at the test points.
where,

2.3 Hyperparameter tuning using Bayesian optimization
Several ML models, including SVR and GPR, consist of multiple hyperparameters that must be selected, such as kernel types.The selec ted hyperparameters have a substantial influence on the performance of each ML model[52].During SVR modeling, three primary hyperparameters are utilized: the insensitive loss function (ε), box constraint (C), and Gaussian width (γ).The parameter ε defines the tolerance margin, which represents an insensitive region.The parameter C determines the weight of errors that occur outside of the tolerance margin.Increasing the value of C in SVR results in the model closely fitting the training data and may improve its ability to predict poorly represented test data.A low ε indicates noise-free data,which in turn leads to an excessive adjustment of the SVR model.
Conversely, a lower C value or a greater value of ε can lead to an insufficient adjustment of the SVR model.The variable γ is equally accountable for both the underestimation and overestimation of projections.Increasing the γ value results in overfitting, whereas decreasing the γ value causes prediction failure.Similar hyperparameters, such as sigma, kernel scale, and kernel length, play a significant role in GPR.
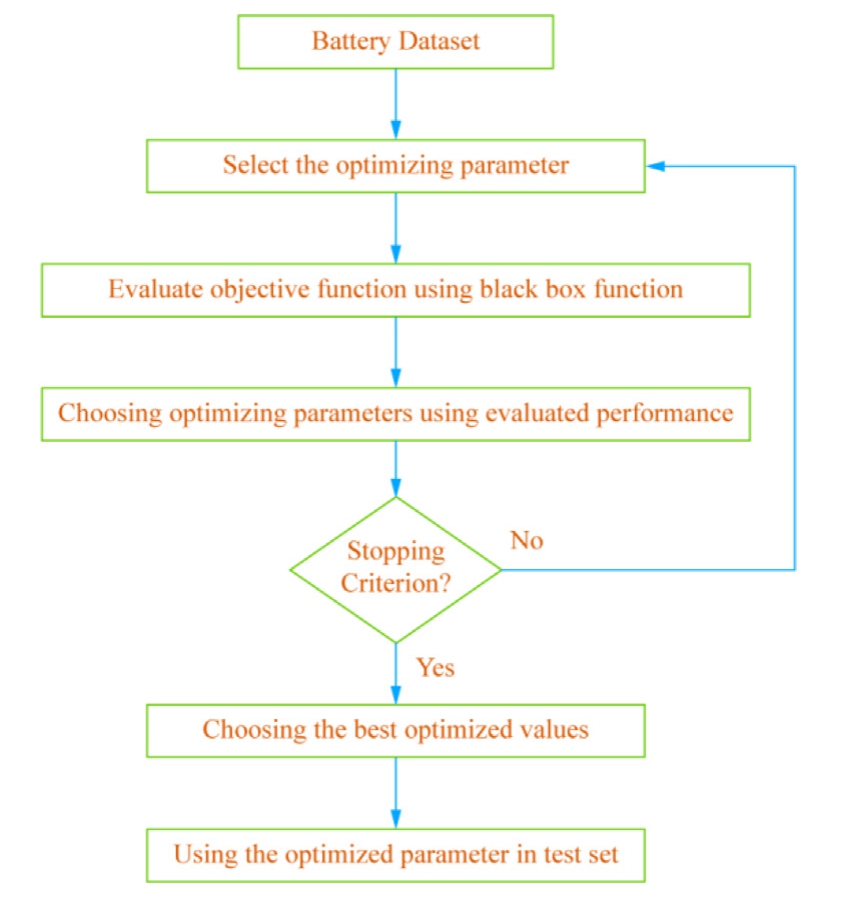
Fig.5.Flowchart of optimal hyperpa rameter selection using BO.
Several optimization techniques, including grid search,random search, and BO, ha ve been proposed for hyperparameter tuning [53].To determine the ideal hyperparameters for the SVR and GPR, this study employed the BO procedure.Fig.5 depicts a flow chart of BO.BO is a systematic approach employed to sequentially optimize the parameters of a black-box function.BO utilizes prior knowl edge to evaluate the response surface function.The Bayesian theorem is the foundational premise of BO [54].To update the posterior of the optimization function, it initially establishes a prior distribution over the optimization function and collects data from the prior sample set[55,56].
2.4 Performance evaluation
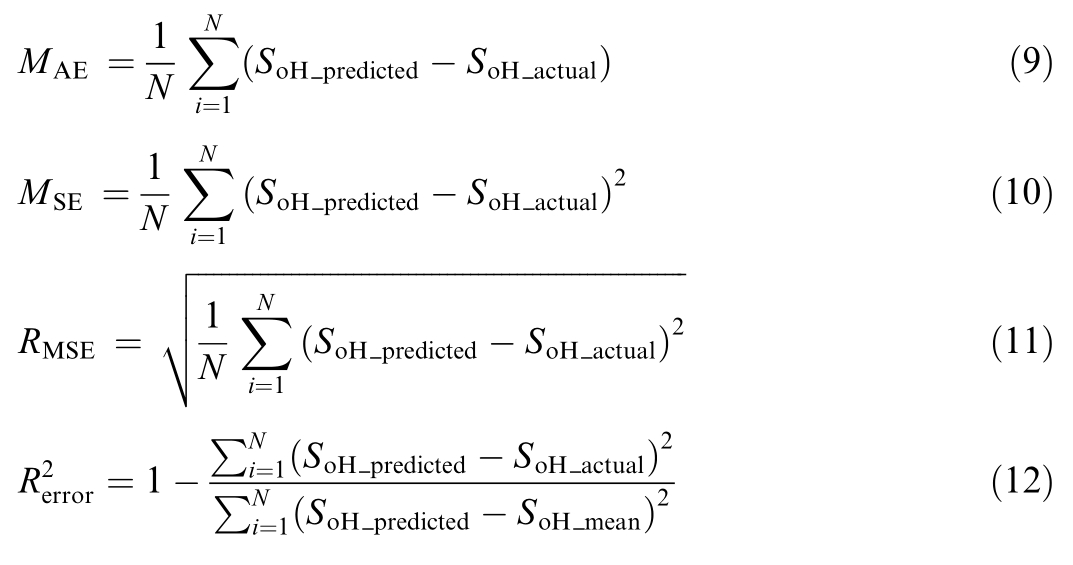
The efficacies of the ML regression models are evaluated by comparing the estimated and observed values.The performance of the regression model was evaluated using performance indica tors including the mean absolute error (MAE), mean squared error (MSE), RMSE, and R2.Eqs.(9)-(12) provide expressions for these perfor mance matrices [10]:
3 Methodology
This study focused on analyzing a dataset of LIB degradation obtained from NASA’s Prognostics Center of Excellence (PCoE).Dataset B0005, which consisted of LIBs of the 18,650 families, was analyzed and evaluated under diverse operating conditions, including multiple charging and discharging cycles.The analysis was conducted at a temperature of  .In constant current(CC) mode, the battery was charged with a current of 1.5 A until it reached a voltage of 4.2 V.Subsequently,the constant voltage (CV) mode was activated and maintained until the charging current decreased to 20 mA.The battery was discharged at a continuous current of 2.5 A until the voltage of battery B0005 decrease to 2.7.Fig.6 shows the charging and discharging profiles for the B0005 dataset.
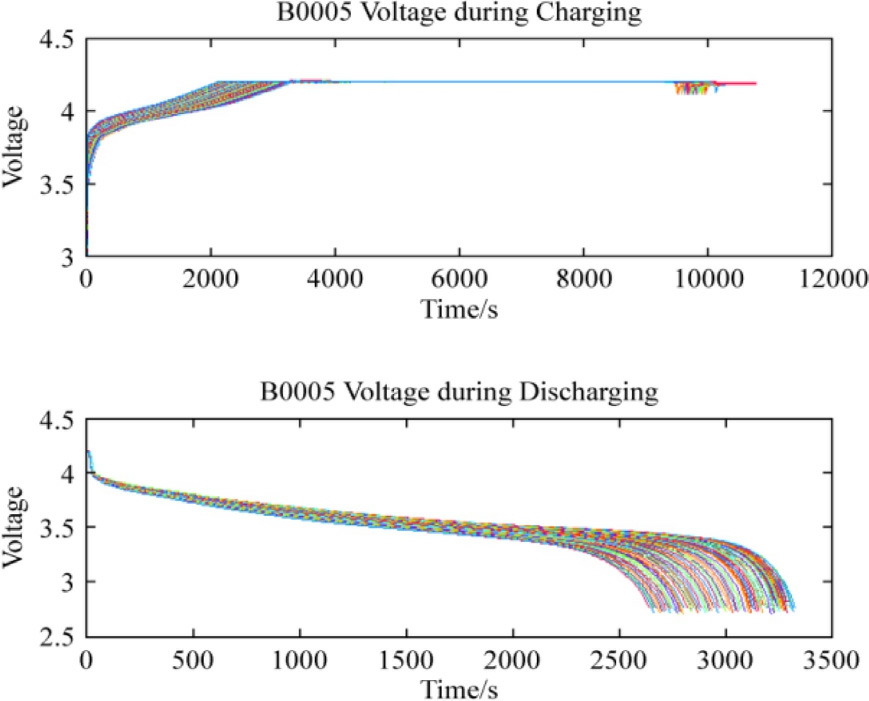
Fig.6.Charging and discharging voltage profile of the B0005 dataset.
Literature analysis revealed that battery capacity is predominantly utilized as the primary measure of a battery’s SoH.Because of the reliance on historical capacityfading datasets, these analyses are not recommended for online SoH calculations.This study co nsidered the ECVDI and EDVDI as health indicators.The changes in the ECVDI, EDVDI, and SoH of the battery corresponding to the battery lifecycle are depicted in Figs.7, 8, and 9,respectively.Based on the graph, it can be deduced that both the ECVDI and EDVDI increased and decreased,respectively, correlating with the SoH of the LIB.
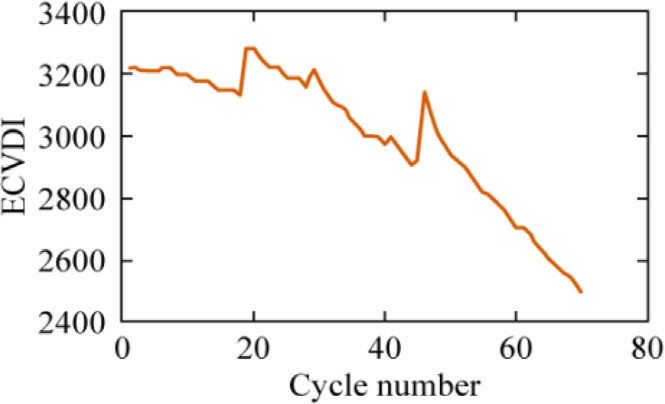
Fig.7.Equivalent charging voltage differen tial interval vs battery cycle.
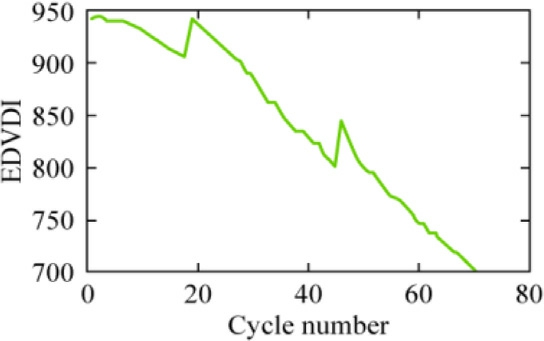
Fig.8.Equivalent discharging voltage differenti al interval vs battery cycle.
Fig.10 presents a block diagram illustrating the utilization of ML algorithms (SVR and GPR) to estimate battery health.Data scaling was performed after selecting the dataset.The initial 73 cycles of the dataset were allocated for training, whereas the remaining 90 cycles were designated for testing.The EDVDI and ECVDI data were used as inputs, whereas the SoH of the battery was used as the target data for training the ML algorithms.The trained model was then subjected to validation to asses s its performance.The best model was selected based on an examination of the model performance, with preference given to the model that exhibited the lowest estimation error.
4 Experimental results and discussion
4.1 Estimation of the SoH using BO-SVR
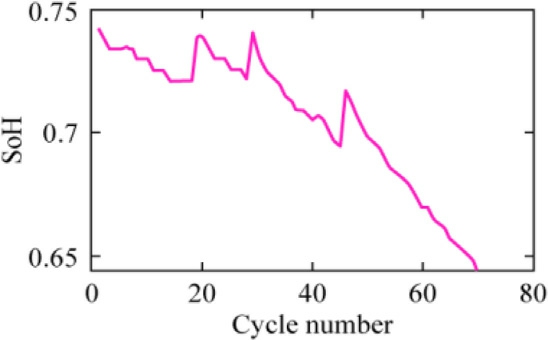
Fig.9.SoH vs battery cycle.
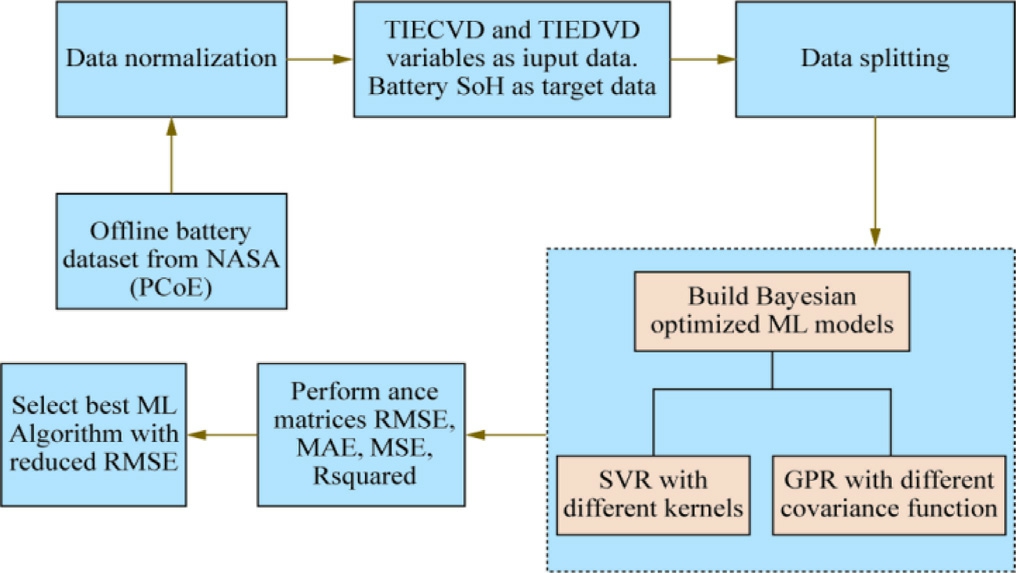
Fig.10.Flowchart of the proposed methodology.
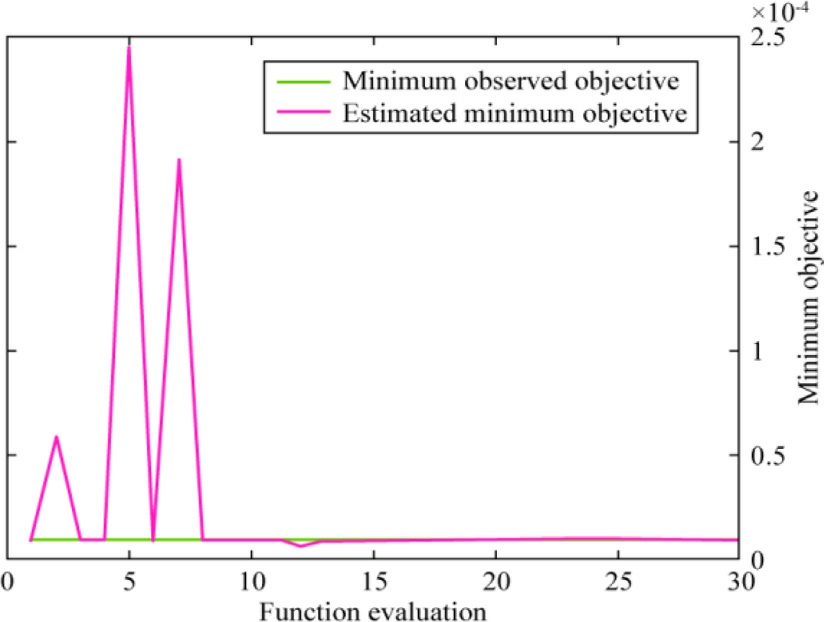
Fig.11.Minimum objective vs number of function evaluations of BOSVR with the Gaussian kernel function.
The BO-SVR model was refined by optimizing its hyperparameters, namely, the kernel function, box constraint, ε, and γ, as the performance of the model is greatly influenced by these parameters.K-fold cross-validation was employed as a measure to mitigate overfitting.For this study, we chose 7-fold cross-validation as a measure to prevent overfitting.This method demonstrated a low RMSE while requiring less computational effort.The BO technique was used to tweak the model hyperparameters.The prediction accuracies of the models were then tested.
The performance of BO-SVR with a Gaussian kernel function was assessed by analyzing Fig.11, which displays the relationship between the minimum objective and the number of function evaluations.The minimum objective is the lowest value achieved for the objective function.The minimum objective may exhibit either a rapid or a gradual convergence rate as the number of function evaluations increases.The convergence of both the observed and estimated minimum objectives to a similar value indicates effective optimization.According to the graph, the predicted goal function exhibited a consistent pattern of both increasing and decreasing until the eighth iteration.Eventually, both the observed and estimated values converged to the same function value.A maximum of 30 function evaluations were performed.The optimized hyperparameter values required to attain a satisfactory feasible point were as follows: box constraint = 638.78,kernel scale=325.87,and epsilon=3.98 10 5.The optimized hyperparameter values for the predicted best feasible point were as follows: box constraint = 258.41,kernel scale = 414.53, and epsilon = 0.00089069.
Hyperparameter selection of the SVR model using polynomials was performed using BO, sim ilar to when using the Gaussian kernel function.Fig.12 shows the minimum objective against the number of function evaluation graphs for this model.As shown in the figure, the estimated and observed objectives converged at the three function evaluations; however, they did not converge thereafter.The discrepancy between the minimum observed objective and calculated minimum objective was substantial, indicating a poor fit.
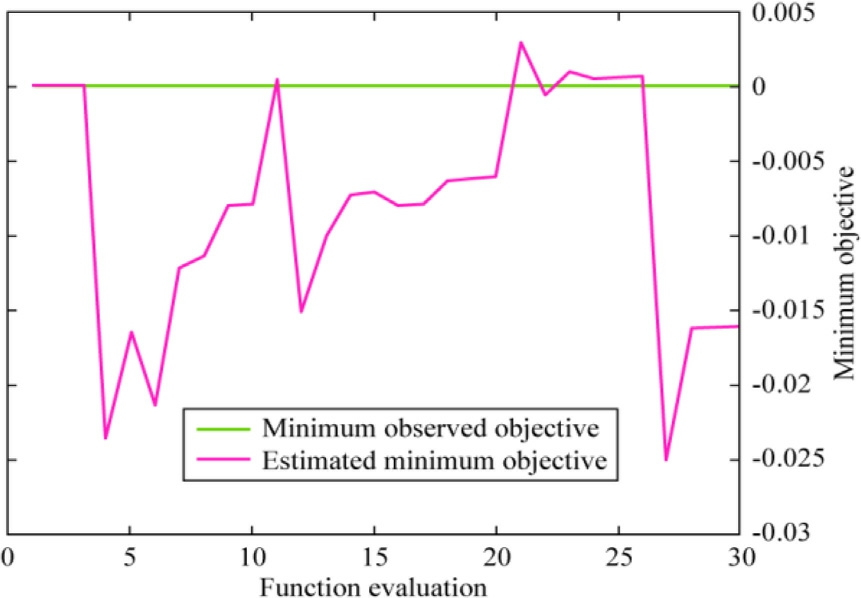
Fig.12.Minimum objective vs the number of function evaluati ons of BO-SVR with a polynomial kernel function.
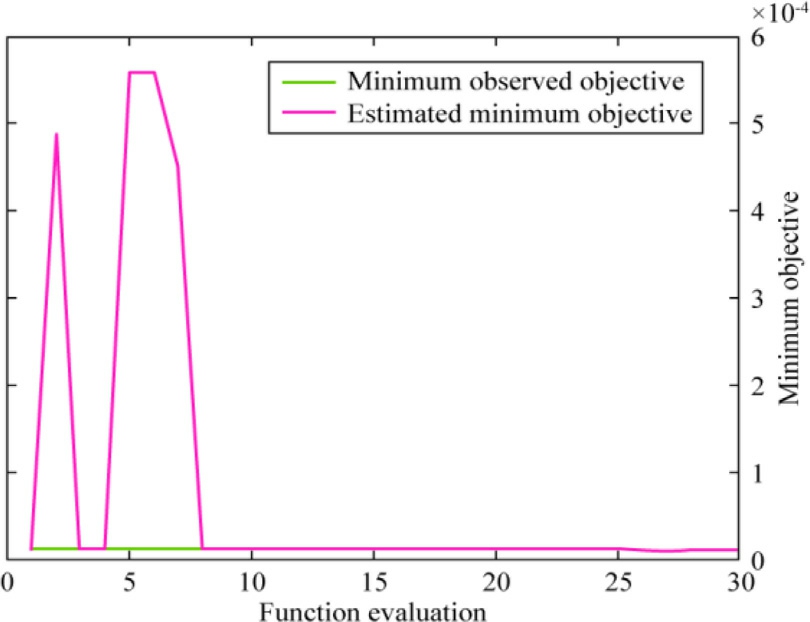
Fig.13.Minimum objective vs the number of function evalua tions of BO-SVR with the RBF kernel function.
BO was employed to select the hyperparameters for SVR using the radial basis function kernel.The resulting graph in, Fig.13, displays the minimum objective value against the number of function evaluations.Note that the estimated and observed objectives exhibited a rapid increase and decrease before converging after the 8th function evaluation.The discrepancy between the minimum observed objective and the estimated minimum objective was minimal, indicating a strong alignment.
Tables 4 and 5 list the optimum values achieved for the Gaussian, polynomial, and RBF kernel functions when training the SVR model.The ECVDI and EDVDI data were used as input parameters, and the SoH was the target parameter.The comparison entailed multiple parameters,including the box constraint, epsilon, and kernel scale, as well as the observed and predicted objective function values and their corresponding evaluation times.Based on an analysis of the tables, it can be deduced that training the SVR model using a Gaussian kernel function and BO for parameter selection yields excellent performance while also reducing the evaluation time.The additional parameters of the SVR that were considered during the training process are listed in Table 6.
The performance of the trained model was evaluated using the remaining 9 0 cycles of data, and the results are shown in Figs.14, 15, and 16.These figures demonstrate the exceptional performance of the BO-SVR model utilizing a Gaussian kernel, which exhibited a reduced estimation error.
4.2 Estimation of the SoH using BO-GPR
The BO-GPR model was constructed by considering the sigma value as a crucial hyperparameter.The model was run in MATLAB 2024a.The ECVDI and EDVDI were regarded as the input variables, whereas the SoH was regarded as the target variable.The initial 73 cycles of data from the B0005 dataset obtained from NASA’s PCoE were used for both training and validation, follow-ing an approach similar to SVR.The remaining 90 cycles were used for testing.As shown in this section, the performance of BO-GPR using various kernel functions was evaluat ed.Kernel or covariance functions encompass a range of options, such as exponential, squared exponential, rational quadratic, and Matern 3/2.
Table 4 Optimized hyperparameters of SVR with different kernels at the best observed feasible point.
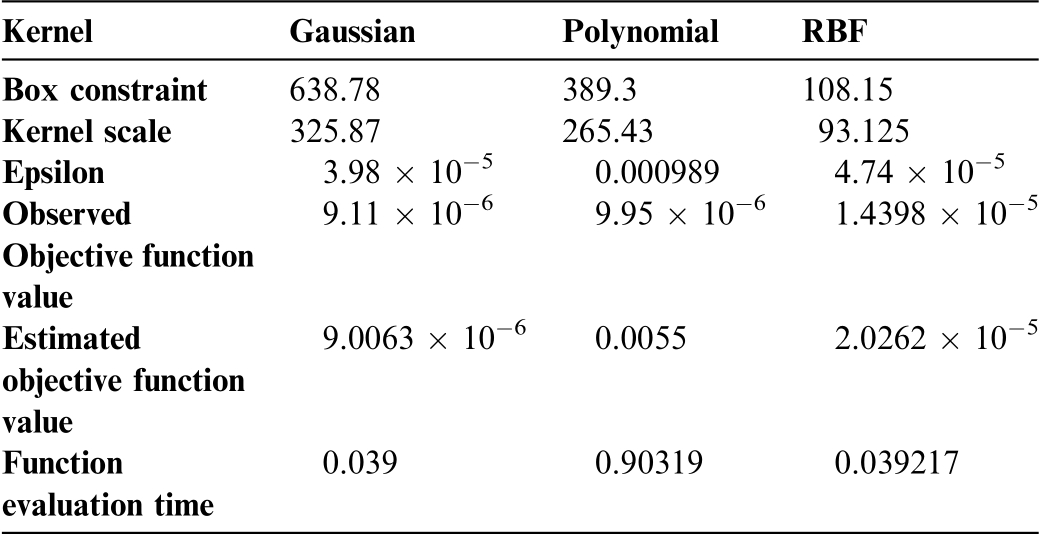
KernelGaussianPolynomialRBF Box constraint638.78389.3108.15 Kernel scale325.87265.4393.125 Epsilon3.98 10 50.0009894.74 10 5 Observed Objective function value 9.11 10 69.95 10 61.4398 10 5 Estimated objective function value 9.0063 10 60.00552.0262 10 5 Function evaluation time 0.0390.903190.039217
Table 5 Optimized hyperparameters of SVR with different kernels at the best estimated feasible point.
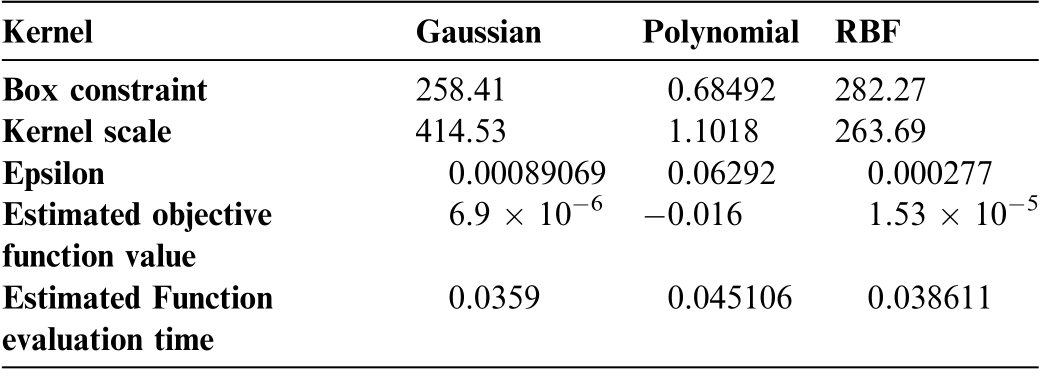
KernelGaussianPolynomial RBF Box constraint258.410.68492282.27 Kernel scale414.531.1018263.69 Epsilon0.000890690.062920.000277 Estimated objective function value 6.9 10 60.0161.53 10 5 Estimated Function evaluation time 0.03590.0451060.038611
Table 6 Hyperparameters of SVR obtained after BO.
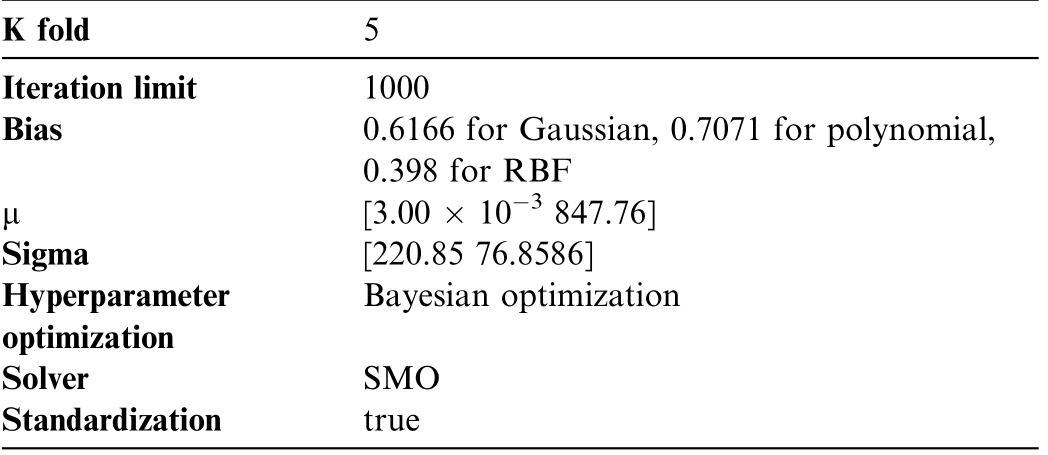
K fold5 Iteration limit1000 Bias0.6166 for Gaussian, 0.7071 for polynomial,0.398 for RBF μ[3.00 10 3 847.76]Sigma[220.85 76.8586]Hyperparameter optimization Bayesian optimizatio n SolverSMO Standardizationtrue

Fig.14.Estimation of the SoH for testing data using BO-SVR with a Gaussian kernel function.
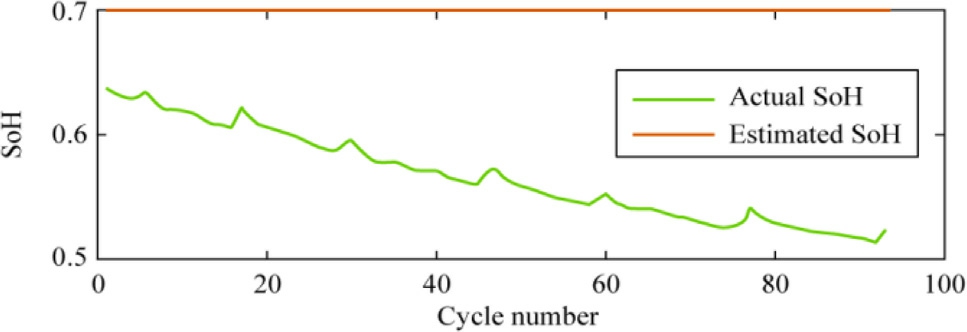
Fig.15.Estimation of the SoH for testing data using BO-SVR with a polynomial kernel function.

Fig.16.Estimation of the SoH for testing data using BO-SVR with the RBF kernel function.
The model was initially trained using the Matern 3/2 kernel function, and its training performance was evaluated by plotting the minimum objective against the function evaluation, as illustrated in Fig.17.Noted that the minimum objective and estimated values had converged by the first function evaluation and then sharply increased.Both the estimated and observed minimum targets converged with a convergence value of 3.2610 6 starting from the sixth function evaluation.The optimal sigma value for the observed minimum objective was 0.00060405, whereas, that for the estimated minimum objective was 0.0001344.
Fig.18 shows the objective function model of BO-GPR.The observed points correspond to a collection of input variables (ECVDI and EDVDI) that constitute the objective function.The model mean represents the projected output for a given input,using the current model.The next point determines the inputs chosen for the next optimization,and the next viable point is selected based on satisfying all the optimization criteria.
The BO-GPR model was trained using different covariance functions.The minimum objective versus functio n evaluation plots produced during training are shown in Figs.19, 20, and 21 corresponding to the Matern 3/2 kernel function.
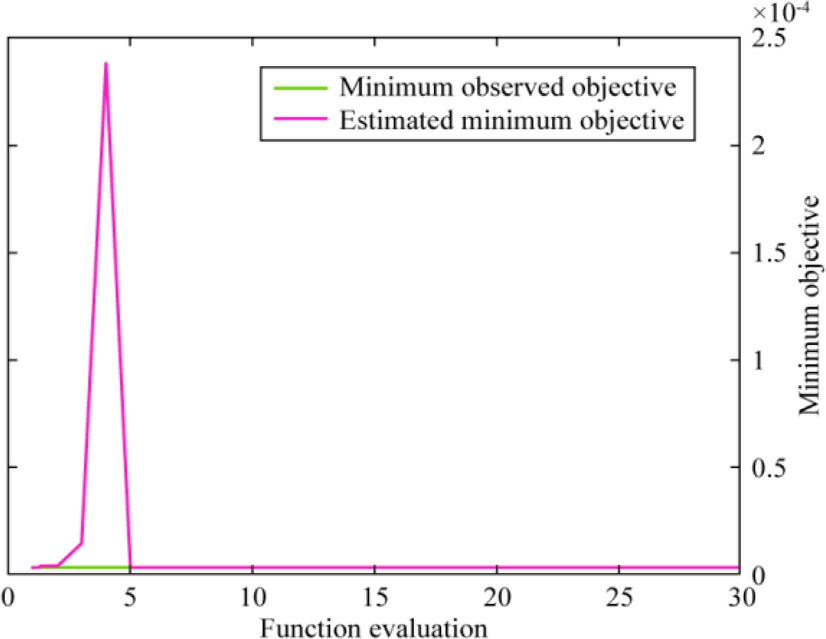
Fig.17.Minimum objective vs number of function evaluations of BOGPR with the Matern 3/2 kernel function.
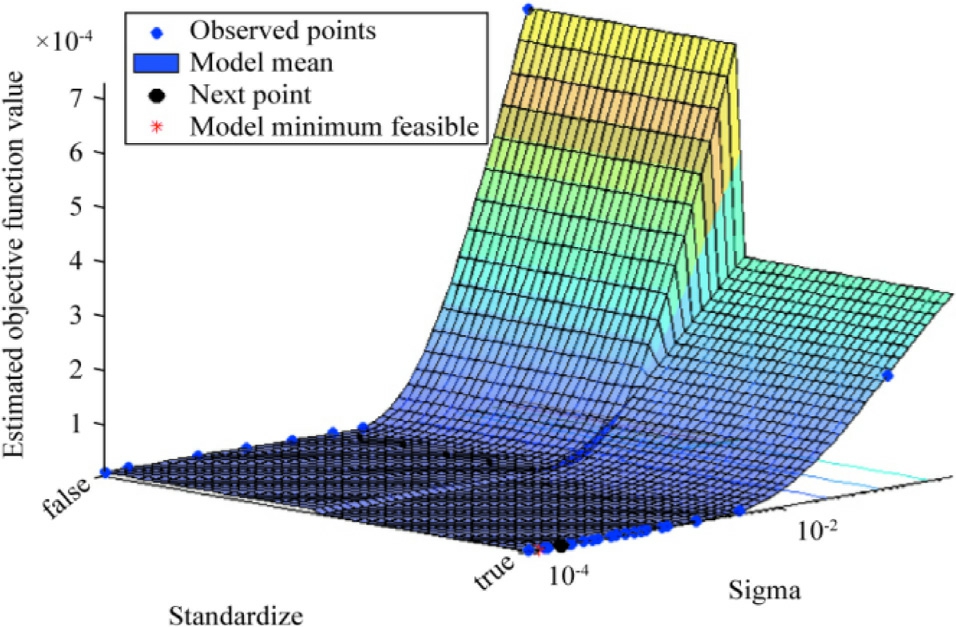
Fig.18.Objective function model of BO-GPR with the Matern 3/2 kernel function.
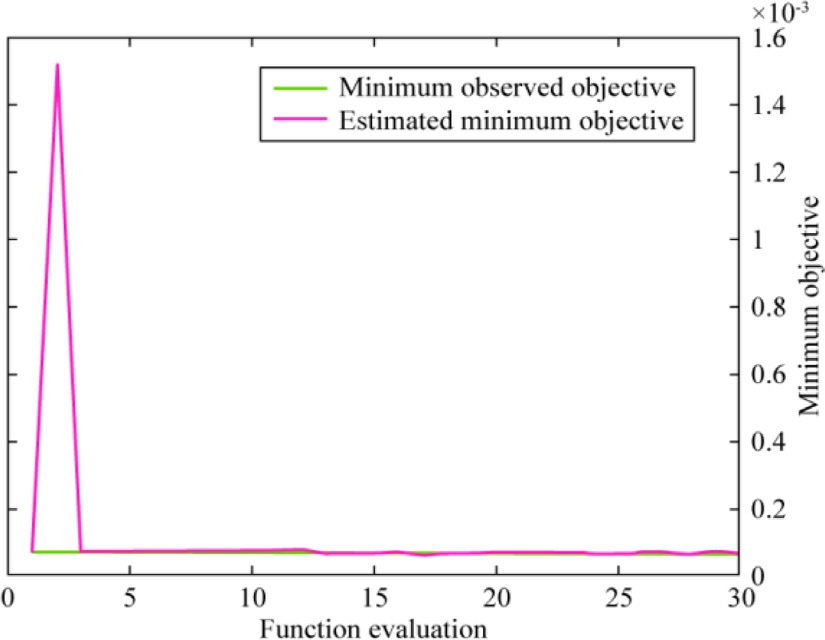
Fig.19.Minimum objective vs number of function evaluations of BOGPR with an exponential kernel function.
Tables 7 and 8 list the optimum values obtained for the different kernel functions.These values were obtained during the training of the GPR model using ECVDI and EDVDI data as input parameters and the SoH as the target parame ter.The comparison involved the parameters sigma, observed and estimated objective function values,and their respective evaluation times.Based on an analysis of the table, training the GPR model using the exponential kernel and BO for parameter selection was found to yields excellent performance while also reducing the evaluation time.
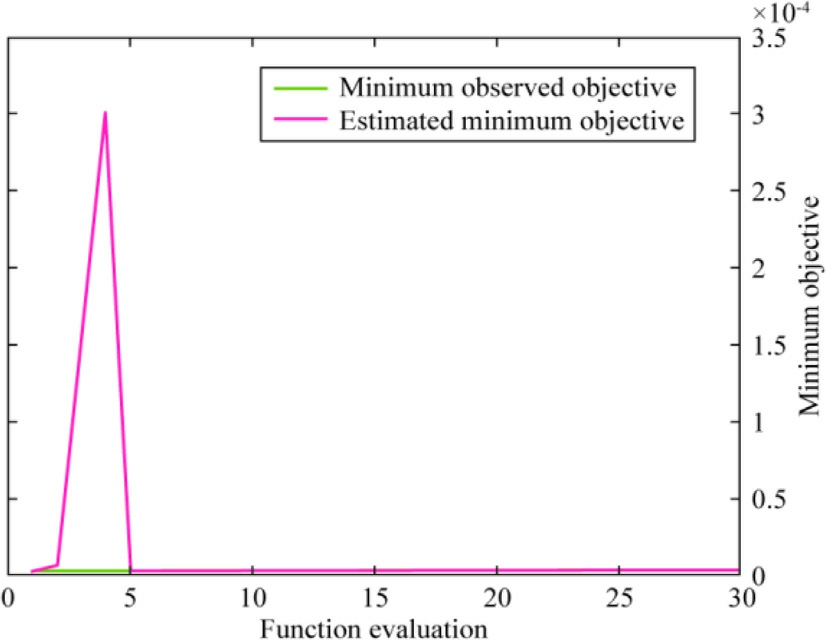
Fig.20.Minimum objective vs number of function evaluations of BOGPR with a rational quadratic function.
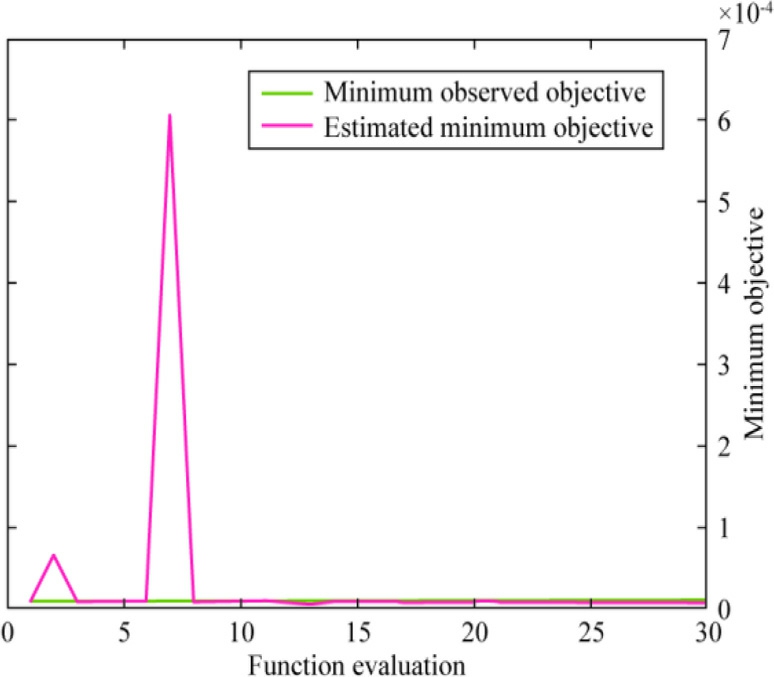
Fig.21.Minimum objective vs number of function evaluations of BOGPR with a squared exponential kernel function.
The performances of the trained BO-GPR models using various kernel functions were evaluated for the remaining 90-cycle data.The results are visualized in Figs.22-25.The figures illustrates the superior performance of the BO-GPR model with an exponential kernel, which exhibited a reduced estimation error during testing.
The testing performances of BO-SVR and BO-GPR using various kernel functions were assessed using the RMSE as the performance metric.The fin dings are visualized in Fig.2 6.The outcomes of the suggested approach were compared with those of previous studies and a re presented in Table 9.Based on the information provi ded in Fig.2 6 and Table 8, it is clear that BO-SVR with a Gaussian kernel function accurately assesses the battery SoH with a decreased prediction error.
Table 7 Optimized hyperparameters of GPR with different kernels at the best observed feasible point.

KernelMatern 3/2Squared ExponentialExponentialRational Quadratic Sigma0.000604050.000604050.000604050.00060405 Observed objective function value3.26 10 63.59 10 63.524 10 63.6 10 6 Observed function evaluation time2.08740.0766250.140250.18460
Table 8 Optimized hyperparameters of ECVDI/ EDVDI with differen t kernels at the best observed feasible point.

KernelMatern 3/2Squared ExponentialExponentialRational Quadratic Sigma0.00013440.000731010.000139780.0001352 Estimated objective function value3.25 10 63.56 10 63.49 10 63.5 10 6 Estimated function evaluation time0.163870.0718220.060680.0976684
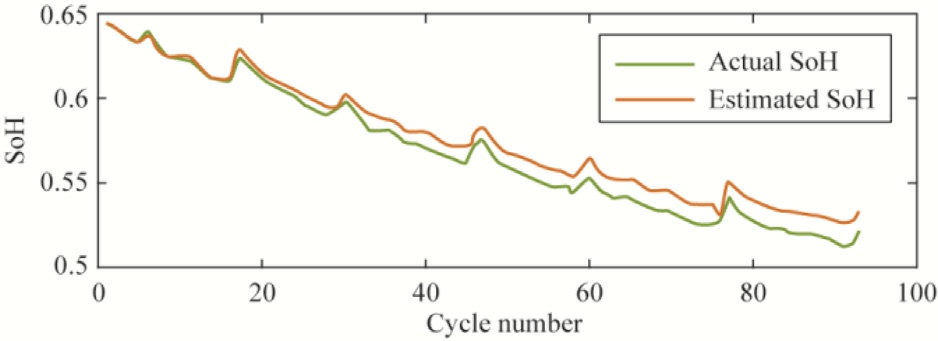
Fig.22.Estimation of the SoH for testing data using BO-GPR with the Matern 3/2 kernel function.
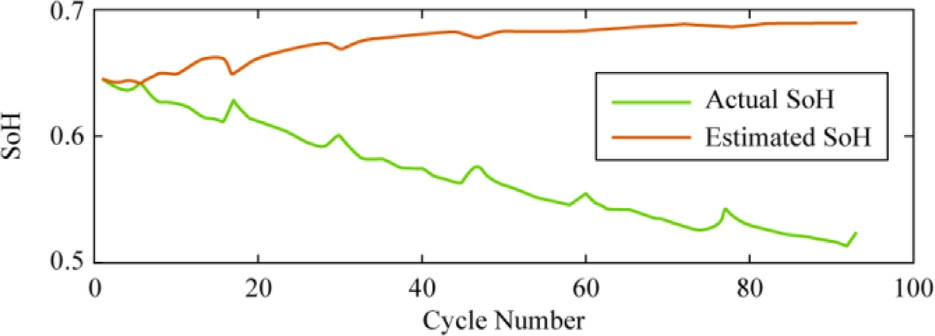
Fig.23.Estimation of the SoH for testing data using BO-GPR with an exponential kernel function.
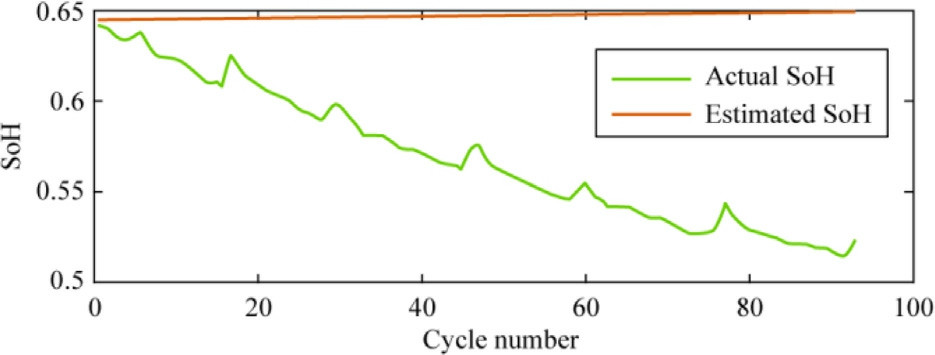
Fig.24.Estimation of the SoH for testing data using BO-GPR with a rational quadratic kernel function.
5 Conclusion
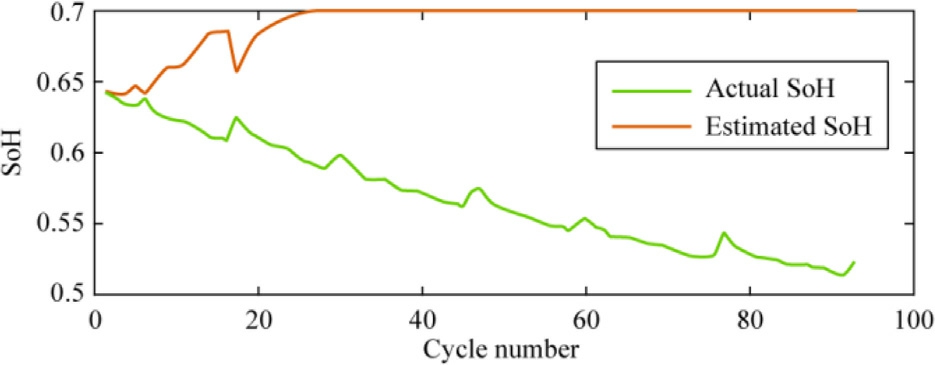
Fig.25.Estimation of the SoH for testing data using BO-GPR with a squared exponential kernel function.
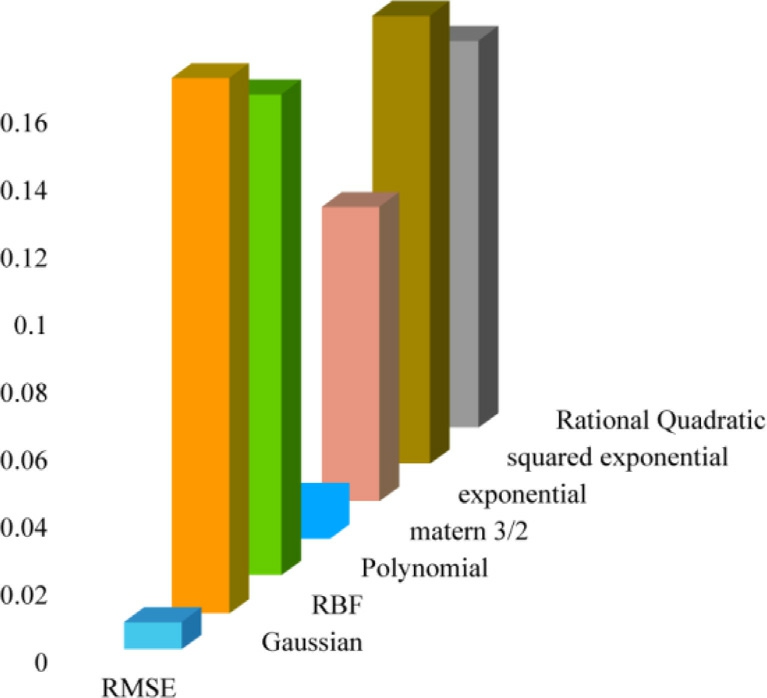
Fig.26.RMSE plot of SoH estimation using BO-SVR and BO-GPR with different kernel functions during testing.
In this study, a novel SoH estimation technique was proposed using SVR with a Gaussian kernel.The optimal hyperparameters of the algorithm were obtained using BO.The main feature of this study is EDVDI and ECDVI were used as input parameters, which effectively depicted the dynamic voltage characteristics associated with battery aging.The model was simulated in a MATLAB environment, and the obtained results indicated that SVR with a Gaussian kernel performed better than SVR with other kernels and GPR with various covariance functions,exhibiting a minimum RMSE of 0.0082.The obtained results suggest that the proposed method can estimate the SoH with better accuracy, contributing to a highly improved battery management system and reliable operation of EVs.In future, to enhance the generalizabilityand applicability of the proposed method, its performance will be validated by employing real-world test data including diverse battery chemistry and operational conditions.
Table 9 Comparison of the proposed methodolo gy with existing methods.

Ref no.MethodologyBattery typeInput parameterRMSE (%)[57]RVM combined Gray modelLi-ion battery-NASA dataset Battery capacity0.960[58]ICA-Linear regressionLi-ion battery-NASA dataset Battery capacity3.00[59]CNNLi-ion battery-NASA dataset Battery capacity1.5-3.7[60]IND RNNLi-ion battery-NASA dataset Battery capacity1.7-3.0 Proposed methodologyBO-SVR with Gaussian kernelLi-ion battery-NASA dataset ECVDI and EDVDI0.0082
CRediT authorship contribution statement
Selvaraj Vedhanayaki: Writing - original draft, Visualization, Validation, Methodology, Conceptualization.Vairavasundaram Indragandhi: Writing - original draft,Supe rvision, Project administration, Data curation,Conceptualization.
Declaration of competing interest
The authors declare that they have no known competing financial interests or personal relationships that could have appeared to influence the work reported in this paper.
Acknowledgments
The corresponding author, Indragandhi V acknowledges funding support for this research.This research was supported by the Royal Academ y of Engineering,UK, under the scheme of Distinguished International Associates (DIA-2424-5-134).
References
-
[1]
IEA, CO2 Emissions in 2023, IEA, Paris, 2024, Licence: CC BY 4.0.https://www.iea.org/reports/co2-emissions-in-2023. [百度学术]
-
[2]
K.Singh, R.S.Meena, S.Kumar, et al., India’s renewable energy research and policies to phase down coal: success after Paris agreement and possibilities post-Glasgow Climate Pact, Biomass Bioenergy 177 (2023) 106944. [百度学术]
-
[3]
S.Vedhanayaki, V.Indragandhi, A Bayesian optimized deep learning approach for accurate state of charge estimation of lithium ion batteries used for electric vehicle application, IEEE Access 12(2024) 43308-43327. [百度学术]
-
[4]
J.Zhang, M.S.Islam, M.Jambulingam, et al., Leveraging environmental corporate social responsibility to promote green purchases: the case of new energy vehicles in the era of sustainable development, J.Clean.Prod.434 (2024) 139988. [百度学术]
-
[5]
Volumes, E.V.Global EV Sales, 2023. [百度学术]
-
[6]
V.Selvaraj, I.Vairavasundaram, A comprehensive review of the state of charge estimation in lithium-ion batteries used in electric vehicles, J.Storage Mater.72 (2023) 108777. [百度学术]
-
[7]
K.Itani, A.De Bernardinis, Review on new-generation batteries technologies: trends and future directions, Energies 16 (22) (2023)7530. [百度学术]
-
[8]
M.Faraji-Niri, M.Rashid, J.Sansom, et al., Accelerated state of health estimation of second-life lithium-ion batteries via electrochemical impedance spectroscopy tests and machine learning techniques, J.Storage Mater.58 (2023) 106295. [百度学术]
-
[9]
M.M.Camboim, A.C.Moreira, N.C.Maria de Fa´tima,et al.,State of health estimation of second-life batteries through electrochemical impedance spectroscopy and dimensionality reduction, J.Storage Mater.78 (2024) 110063. [百度学术]
-
[10]
S.Yan, C.Zhang, J.Jiang, et al., Review on state-of-health of lithium-ion batteries: characterizations, estimations and applications, J.Clean.Prod.314 (2021) 128015. [百度学术]
-
[11]
X.Zhou, J.L.Stein, T.Ersal, Battery state of health monitoring by estimation of the number of cyclable Li-ions, Control Eng.Pract.66 (2017) 51-63. [百度学术]
-
[12]
X.Han, M.Ouyang, L.Lu, et al., A comparative study of commercial lithium-ion battery cycle life in the electrical vehicle:aging mechanism identification, J.Power Sources 251(2014)38-54. [百度学术]
-
[13]
A.Barre´, B.Deguilhem, S.Grolleau, et al.,A review of lithium-ion battery aging mechanisms and estimations for automotive applications, J.Power Sources 241 (2013) 680-689. [百度学术]
-
[14]
D.Chen, J.Meng, H.Huang, et al., An empirical-data hybrid driven approach for remaining useful life prediction of lithium-ion batteries considering capacity diving, Energy 245 (2022) 123222. [百度学术]
-
[15]
P.Shrivastava, T.Soon, M.Y.I.B.Idris, S.Mekhilef, Overview of model-based online state-of-charge estimation using Kalman filter family for lithium-ion batteries, Renew.Sustain.Energy Rev.113(2019) 109233. [百度学术]
-
[16]
B.Sang, Z.Wu, B.Yang, et al., Joint estimation of SOC and SOH for lithium-ion batteries based on dual adaptive central difference H-infinity filter, Energies 17 (7) (2024) 1640. [百度学术]
-
[17]
M.Ahwiadi, W.Wang, An AI-driven particle filter technology for battery system state estimation and RUL prediction, Batteries 10(12) (2024) 437. [百度学术]
-
[18]
J.Tian, X.Liu, S.Li, et al., Lithium-ion battery health estimation with real-world data for electric vehicles, Energy 270 (2023)126855. [百度学术]
-
[19]
J.Hong, K.Li, F.Liang, et al., A novel state of health prediction method for battery system in real-world vehicles based on gated recurrent unit neural networks, Energy 289 (2024) 129918. [百度学术]
-
[20]
S.Xu, F.L.Zha, B.W.Huang, et al., Research on t he state of health estimation of lithium-ion batteries for energy stora ge based on XGB-AKF method, Front.Energy Res.10 (2023) 999676. [百度学术]
-
[21]
M.Jiang, Z.Liu, Y.Zhang, et al., An integrated method for lithium-ion batteries remaining useful life prediction based on unscented particle filter and relevance vector machine,in:2021 40th Chinese Control Conference (CCC), IEEE, 2021, pp.6423-6428. [百度学术]
-
[22]
Z.Chen, M.Sun, X.Shu, et al., Online state of health estimation for lithium-ion batteries based on support vector machine, Appl.Sci.8 (6) (2018) 925. [百度学术]
-
[23]
R.R.Richardson, C.R.Birkl, M.A.Osborne, D.A.Howey,Gaussian process regression for in situ capacity estimation of lithium-ion batteries, IEEE Trans.Ind.Inf.15 (1) (2018) 127-138. [百度学术]
-
[24]
J.Wu, J.Chen, X.Feng, et al., State of health estimation of lithium-ion batteries using autoencoders and ensemble learning, J.Storage Mater.55 (2022) 105708. [百度学术]
-
[25]
Y.Fan, F.Xiao, C.Li, et al., A novel deep learning framework for state of health estimation of lithium-ion battery,J.Storage Mater.32 (2020) 101741. [百度学术]
-
[26]
S.Wang, P.Takyi-Aninakwa, S.Jin, et al., An improved feedforward-long short-term memory modeling method for the whole-life-cycle state of charge prediction of lithium-ion batteries considering current-voltage-temperature variation, Energy 254(2022) 124224. [百度学术]
-
[27]
S.Wang, Y.Fan, S.Jin, et al., Improved anti-noise adaptive long short-term memory neural network modeling for the robust remaining useful life prediction of lithium-ion batteries, Reliab.Eng.Syst.Saf.230 (2023) 108920. [百度学术]
-
[28]
B.Mao, W.Qin, X.Xiao, Z.Zheng,SOH estimation of lithium-ion batteries based on LSTM&G RU-Attention multijoint model,Energy Storage Sci.Technol.12 (11) (2023) 3519. [百度学术]
-
[29]
S.Shen, M.Sadoughi, X.Chen, et al.,A deep learning method for online capacity estimation of lithium-ion batteries, J.Storage Mater.25 (2019) 100817. [百度学术]
-
[30]
K.Kaur, A.Garg, X.Cui, et al., Deep learning networks for capacity estimation for monitoring SOH of Li-ion batteries for electric vehicles, Int.J.Energy Res.45 (2) (2021) 3113-3128. [百度学术]
-
[31]
R.S.Teixeira, R.F.Calili, M.F.Almeida,D.R.Louzada,Recurrent neural networks for estimating the state of health of lithium-ion batteries, Batteries 10 (3) (2024) 111. [百度学术]
-
[32]
N.Yang, Z.Song, H.Hofmann, J.Sun, Robust State of Health estimation of lithium-ion batteries using convolutional neural network and random forest, J.Storage Mater.48 (2022) 103857. [百度学术]
-
[33]
Z.Xue, Y.Zhang, C.Cheng, G.Ma, Remaining useful life prediction of lithium-ion batteries with adaptive unscented kalman filter and optimized support vector regression, Neurocomputing 376 (2020) 95-102. [百度学术]
-
[34]
Y.He, W.Y.Bai, L.L.Wang, et al.,SOH estimation for lithium-ion batteries: an improved GPR optimization method based on the developed feature extraction, J.Energy Storage 83 (2024) 110678. [百度学术]
-
[35]
H.Zuo, J.Liang, B.Zhang, et al., Intelligent estimation on state of health of lithium-ion power batteries based on failure feature extraction, Energy 282 (2023) 128794. [百度学术]
-
[36]
L.Chen, H.Wang, B.Liu, et al., Battery state - of - health estimation based on a metabolic extreme learning machine combining degradation state model and error compensation,Energy 215 (2021) 119078. [百度学术]
-
[37]
J.Lu, R.Xiong, J.Tian, C.Wang, F.Sun, Deep learning to estimate lithium-ion battery state of health without additional degradation experiments, Nat.Commun.14 (1) (2023) 2760. [百度学术]
-
[38]
B.Gou, Y.Xu, X.Feng, State-of-health estimation and remaininguseful-life prediction for lithium-ion battery using a hybrid datadriven method, IEEE Trans.Veh.Technol.69 (10) (2020) 10854-10867. [百度学术]
-
[39]
A.Farman, W.Waag, A.Marongiu, D.U.Sauer,Critical review of on-board capacity estimation techniques for lithium-ion batteries in electric and hybrid electric vehicles, J.Power Sources 281(2015)114-130. [百度学术]
-
[40]
N.T.Tran, A.B.Khan, W.Choi, State of charge and state of health estimation of AGM VRLA batteries by employing a dual extended Kalman filter and an ARX model for online parameter estimation,Energies 10 (1) (2017) 137. [百度学术]
-
[41]
C.M.Tan, P.Singh, C.Chen, Accurate real-time online estimation of state-of-health and remaining useful life of Li-ion batteries,Appl.Sci.10 (21) (2020) 7836. [百度学术]
-
[42]
L.Yao, S.Xu, A.Tang, et al., A review of lithium-ion battery state of health estimation and prediction methods, World Electric Veh.J.12 (3) (2021) 113. [百度学术]
-
[43]
B.Liu, X.Tang, F.Gao, Joint estimation of battery state-of-charge and state-of-health based on a simplified pseudo-two-dimensional model, Electrochim.Acta 344 (2020) 136098. [百度学术]
-
[44]
R.Rodrı´guez-Pe´rez, J.Bajorath, Evolution of support vector machine and regression modeling in chemoinformatics and drug discovery, J.Comput.Aided Mol.Des.36 (5) (2022) 355-362. [百度学术]
-
[45]
J.S.Chou, D.N.Truong, C.F.Tsai, Solving regression problems with intelligent machine learners for engineering informatics,Mathematics 9 (6) (2021) 686. [百度学术]
-
[46]
A.H.Ayati, A.Haghighi, H.R.Ghafouri, Machine learning approach to transient-based leak detection of pressurized pipelines: Classification vs regression, J.Civ.Struct.Heal.Monit.12 (3) (2022) 611-628. [百度学术]
-
[47]
K.E.Tang, C.Y.Weng, Y.C.Cheng, C.W.Liu, Typical signal anomaly monitoring and support vector regression-based surface roughness prediction with acoustic emission signals in single-point diamond turning, J.Manuf.Process.112 (2024) 126-135. [百度学术]
-
[48]
H.Papadopoulos, Guaranteed coverage prediction intervals with Gaussian process regression, IEEE Trans.Pattern Anal.Mach.Intell.(2024). [百度学术]
-
[49]
J.Li, M.Ye, Y.Wang, et al., A hybrid framework for predicting the remaining useful life of battery using Gaussian process regression, J.Storage Mater.66 (2023) 107513. [百度学术]
-
[50]
K.J.Lee, W.H.Lee, K.K.K.Kim, Battery state-of-charge estimation using data-driven Gaussian process Kalman filters, J.Storage Mater.72 (2023) 108392. [百度学术]
-
[51]
J.Zhao, L.Xuebin, Y.Daiwei, Z.Jun, Z.Wenjin, Lithium-ion battery state of health estimation using meta-heuristic optimization and Gaussian process regression, J.Storage Mater.58 (2023)106319. [百度学术]
-
[52]
E.Protopapadakis, A.Voulodimos, N.Doulamis,An investigation on multi-objective optimization of feedforwar d neural network topology, in: 2017 8th Internatio nal Conference on Information,Intelligence, Systems & Applications (IISA), IEEE, 2017, pp.1-6. [百度学术]
-
[53]
J.T.Springenberg, A.Klein, S.Falkner, F.Hutter, Bayesian optimization with robust Bayesian neural networks, Advances in Neural Information Processing Systems, 2016. [百度学术]
-
[54]
L.Hussain, A.A.Malibari, J.S.Alzahrani, et al.,Bayesian dynamic profiling and optimization of important ranked energy from graylevel co-occurrence (GLCM) feature for empirical analysis of brain MRI, Sci.Rep.12 (1) (2022) 15389. [百度学术]
-
[55]
J.Wu, X.Y.Chen, H.Zhang, et al., Hyperparameter optimization for machine learning models based on Bayesian optimization, J.Electron.Sci.Technol.17 (1) (2019) 26-40. [百度学术]
-
[56]
A.M.Elshewey, M.Y.Shams, N.El-Rashid, et al., Bayesian optimization with support vector machine model for Parkinson’s disease classification, Sensors 23 (4) (2023) 2085. [百度学术]
-
[57]
L.Zhao, Y.Wang, Cheng J (2019) A hybrid method for remaining useful life estimation of lithium-ion battery with regeneration phenomena, Appl.Sci.9 (9) (1890). [百度学术]
-
[58]
X.Li, C.Yuan, Z.Wang, State of health estimation for Li-ion battery via partial incremental capacity analysis based on support vector regression, Energy 203 (2020) 117852. [百度学术]
-
[59]
S.Shen, M.Sadoughi, M.Li, et al., Deep convolutio nal neural networks with ensemble learning and transfer learning for capacity estimation of lithium-ion batteries, Appl.Energy 260 (2020)114296. [百度学术]
-
[60]
P.Venugopal, State-of-Health estimation of Li-ion batteries in the electric vehicle using IndRNN under variable load condition,Energies 12 (22) (2019) 4338. [百度学术]
Fund Information

