Recommended articles:
-

-
Global Energy Interconnection
Volume 8, Issue 4, Aug 2025, Pages 537-553
Electrical and aging modeling of PEM water electrolyzers for sustainable hydrogen production: Insights into behavior, degradation, and reliability
Abstract
Abstract
0 Introduction
Hydrogen is expected to become a vital energy carrier in future energy systems.However, as it does not exist much naturally in elemental form, it must be produced.Among the available technologies, PEMWEs present a promising solution for hydrogen production using renewable electricity.They offer high efficiency, compactness, fast dynamic response, and operation at relatively low temperatures,making them attractive for both grid integration and off-grid applications [1].Electrolysis represents a green production method that supports decarbonization and economic growth by reducing greenhouse gas emissions.
Despite their advantages, PEMWEs face persistent challenges that limit their widespread adoption and their operational lifetime.The high cost of critical materials,including platinum and iridium catalysts and perfluorinated membranes, presents a significant economic barrier.To address these cost concerns, substantial efforts have been made in develop ing advanced materials and innovative cell designs [2,3].Beyond economic challenges, PEM electrolyzers also face durability issues that directly impact their operational lifetime.Mechanical stress, thermal cycling, and chemical breakdown of membrane materials contribute to performance degradation over time [4-6].These degradation mechanisms result in lifetimes that are typically shorter than desired for industrial applications,limiting the technology’s commercial viability and longterm economic attractiveness.
To address durability issues and extend electrolyzer lifespan, robust diagnosis methods are essential for estimating aging and degradation rates.These diagnosis tools enable the development of preventive maintenance strategies, which can significantly enhance system durability and optimize operational performance.By accurately monitoring degradation patterns, operators can plan targeted interventions before critical failures occur, ultimately improving the long-term reliability and economic viability of PEM electrolyzer systems.Effective diagno sis approaches fundamentally rely on accurate mathematical modeling to understand and predict system behavior.Mathematical modeling has emerged as a crucial tool for understanding PEMWE behavior, optimizing design parameters,enabling advanced control strategies,and supporting real-time fault detection and diagnosis [1].While experimental studies provide essential insights into electrolyzer principles [7-9], computational modeling offers a cost-effective and flexible alternative that facilitates exploration across a wide range of operating conditions without the constraints and expenses of physical testing.
The development of PEMWE modeling has evolved significantly over recent decades.Although electrolysis has been industrialized for decades, particularly in alkal ine systems, dedicated modeling efforts for PEMWE technology began primarily in the 1990s[8].These early efforts initially focused on fuel cell applications and were later adapted for electrolyzer systems in the early 2000s [9].Today, PEMWE modeling has matured into a robust research area, with numerous studies employing thermodynamic principles and Butler-Volmer kinetics to simulate electrochemical behavior under diverse operating conditions [10-17].
Within this mature modeling landscape, electrical models have emerged as particularly valuable for system analysis due to their computational efficiency and their ability to capture key electrochemical phenomena.The behavior of electrolyzer systems can be characterized using two main model categories: static or dynamic models.Static models rely on algebraic equations to describe steadystate relationshi ps, while dynamic models use differential equations to capture transient system responses to input variations such as temperature, flow rate, pressure, and current.Dynamic models are essential for applications requiring real-time control and accurate performance prediction.
In [11], for example, a static model was combined with a thermal model to support fault detection and identification algorithms.This model-based diagnosis approach effectively isolates faults in sensors,actuators,and system components.However, it lacks the capability to estimate critical aging parame ters such as membrane and catalyst layer degradation.
In [12,13], large-signal dynamic models for PEMWE have been proposed.The model in [12] incorporates nondissociated electrodes, proton transfer mechanisms, and a dual-layer structure for the diffusion layer—comprising an activation layer (AL) a nd a gas diffusion layer (GDL)—along with parasitic phenomena.In contrast, [13] includes both dissociated and non-dissociated electrode models,although it omits proton transfer dynamics.Due to the complexity of large-signal models, small-signal (or impedance) models are often used as a n approximation around operating points.A small-signal model derived from the dynamic behavior of the system is presented in[12].
Equivalent circuit models, such as those based on the Randles-Warburg framework [13], represent the physical processes of a PEMWE using electrical components.These include resistors for membrane and charge transfer losses,capacitors for double-layer effects, and Warburg elements accounts for the concentration losses in the system.Other models have simplified this further by using RC branches to represent activation dynamics at both electrodes, a membrane resistance, and a DC source for the reversible potential [14].
While these electrical modeling approaches have significantly advanced our understanding of PEMWE operational behavior and control strategies, a critical gap remains in addressing long-term performance prediction and degradation analysis.Most existing models focus on capturing electrochemical phenomena during normal operation, with limited consideration of the gradual deterioration processes that ultimately determ ine system lifetime.This limitation becomes particularly significant when considering the practical implementation of PEMWEs in industrial applications, where accurate lifetime estimation and predictive maintenance strategies are essential for economic viability.
Recent advances have demonstrated the strong potential of PEMWE technology, with continuous eff orts aimed at reducing costs while enhancing durability [1].However,accurately estimating the Remaining Useful Life (RUL) of PEMWEs remains a significant challenge due to the slow and complex nature of degradation processes.While long-term experimental studies are essential for understanding system lifetime, they are tim e-consuming and resource-intensive.As a result, modeling degradation mechanisms has become increasingly important for enabling reliable performance prediction over extended periods [1].Despite the substantial body of research on control strategies and dynamic modeling of electrolyzers,relatively few studies have focused specifically on the degradation behavior of PEMWEs.
Despite many studies having focused on degradation modeling of PEM fuel cells, degradation modeling and studies for PEM electrolyzers remain rare and limited.Degradation modeling in PEM fuel cells has been extensively studied, with researchers developing comprehensive approaches [15-22].These studies have established methodologies for modeling various degradation mechanisms such as membrane thinning, catalyst dissolution,carbon support corrosion, and mechanical stress effects.In contrast, degradation modeling specifically for PEM electrolyzers remains significantly underdeveloped.Only a limited number of studies have addressed this critical area [23,24].This disparity highlights a substantial research gap that needs to be addressed to enab le reliable lifetime prediction and maintenance optimization for PEMWE systems.
Given this critical research gap and the urgent need for comprehensive degradation modeling frameworks for PEMWEs, it becomes essential to examine the limited but valuable contributions that have begun to address this challenge.The few existing studies in this area provide important foundational insights into specific degradation mechanisms and modeling approaches that can inform future research directions and practical implementation strategies.In the following section, a selection of key works addressing PEMWE degradation is reviewed.
Degradation mechanisms in PEMWEs, particularly membrane degradation, have been widely studied, with fluoride relea se used as a key indicator.A notable contribution in [23] presents a model that simulates membrane aging by capturing oxygen crossover, hydrogen peroxide formation, and radical generation via the Fenton reaction.The model also tracks membrane thinning over time through fluoride release.It analyzes the effects of current density and temperature (40 °C, 60 °C, and 80 °C), showing that higher temperatures significantly accelerate degradation, while the impact of current density is smaller and nonlinear—rising to a point before declining.
In [24] the authors present a detailed physicochemical model to simulate the electrochemical dissolution of iridium in the anode catalyst layer of polymer electrolyte membrane (PEM) water electrolyzers.The model incorporates mass and charge transfer processes, moisturedependent proton conductivity, and overpotential distributions to evaluate the degradation behavior of the electrolysis cell (EC).The model shows that highperformance ECs, while more efficient initially, suffer from greater iridium dissolution and thus faster degradation.The dissoluti on rate is modeled as an exponential function of the anodic overpotential, and is dependent on catalyst layer properties such as thickness, iridium content, and active surface area.The study concludes that optimizing the specific consumption of iridium is essential for the techno-economic viability of hydrogen production via PEM electrolysis.
While these modeling efforts represent important theoretical a dvances in understanding PEMWE degradation mechanisms, their practical implementation in industrial settings faces significant challenges related to real-time monitoring and diagnosis capabilities.A critical challenge in PEMWE deployment is the scarcity of model-based diagnosis methods that can operate in real-time, nonintrusively, and without requiring specialized equipment.Although several diagnosis approaches exist for monitoring PEMWE performance and degradation, most are limited to offline applications or depend on specific instrumentation that restricts their practical utility.
The existing diagnosis strategies for PEMWE systems can be broadly categorized into electrical and nonelectrical methods, each with distinct advantages and limitations [25,26].Electrical diagnosis techniques encompass polarization analysis, electrochemical impedance spectroscopy(EIS),and current distribution evaluation[27,28].
These methods leverage the electrochemical characteristics of the system to assess performance and identify degradation patterns.Complementing these electrical approaches, non-electrical diagnosis techniques include visual inspection,thermal imaging,nuclear magnetic resonance, and beam interrogation methods [26,29,30].While these diagnosis methods can provide valuable insights into microscopic degradation phenomena, they face significant implementation constraints.For instance, AC-impedance spectroscopy studies have successfully identified specific degradation locations within PEMWE systems, such as demonstrating that the anode side experiences more severe degradation, with polarization resistance increasing dramatically after 1000 h of operation [28].However, the practical application of these techniques is severely limited by their requirement for specialized equipment and complex protocols.Most importantly, these methods typically necessitate physical modifications to the system, stack disassembly, or operational interruption, making continuous online diagnosis impractical for industrial applications where uninterrupted operation is essential.
In contrast, some researchers have explored alternative approaches that can potentially enable real-time monitoring capabilities.These include micro sensors integrated through MEMS technology for monitoring localized temperature, fluid flow, voltage, and current density [31,32],acoustic emission analysis for detecting ox ygen bubble formation [25], acoustic time-of-flight imaging for inspecting reactant distribution [33], and automated ion chromatography for tracking fluoride ion concentration as a membrane degradation indicator [34].However, despite their real-time capabilities, these methods still require specialized equipment and remain limited in their ability to isolate specific faults, highlighting the ongoing challenge of developing truly practical, non-intrusive diagnosis solutions for industrial PEMWE applications.
The limitations identified in existing diagnosis approaches, combined with the separate treatment of electrical and aging modeling in current literature, reveal a fundamental gap in PEMWE research methodology.A comprehensive review of the literature reveals that existing studies typically address the electrical modeling and aging modeling of PEMWEs as separate domains.To date, no published work has demonstrated their integration.Mo reover,research focused on model-based diagnosis that relies on mathematical relations and physical laws of the system remains relatively limited for health management of PEMWEs.
This study aims to bridge this gap by integrating electrical and aging models to develop a unified framework that incorporates two critical degradation parameters: the surface degradation ratio and the membrane degradation ratio.This integration makes a novel diagnosis approach possible with real-time operation without the need for specialized tools.As a second contribution, this study introduces a linear polarization-based modeling approach that facilitates the extraction and interpretation of degradation ratios, offering a quan titative assessment of the system’s health.This approach allows for real-time monitoring of performance degradation,thereby improving the accuracy and timeliness of predictive maintenance strategies.The developed model in this study leads to a novel diagnosis approach that uses only the current and voltage measurements of the system, eliminating the need for additional equipment.
This article is organized into several distinct sections to provide a clear and comprehensive understanding of the topics addressed.Section 1 examines electrical and aging models, introducing dynamic electrical models and aging models including catalyst degradation and membrane degradation models.This section also presents electrical models that incorporate aging effects,steady-state models,and linear polarization curve models.Section 2 presents an important technical analysis of sensitivity of the offset and slope of linear model with respect to aging ratios, while Section 3 presents mathematical proof of the linear model’s invertibility.Section 4 describes the experimental test bench and presents both experimental and simulation results, interpreting model outputs and highlighting the implications of the results.Section 5 concludes the article by summarizing the key points and principal outcomes.Additionally, the appendices detail supplem entary information, and list all the parameters used in this work.
1 Electrical and aging models
The electrical model, which includes dynamic and nonlinear components, is formulated based on electrochemical and physical principles.Beyond the standard equations,enhancements have been implemented to ensure an accurate and fast simulation of the system, since the model dynamics are of first-order.This improved accuracy is achieved by considering the membrane permeability to hydrogen and the interaction between activation and diffusion.Unlike most PEMWE models [12], which often decouple these phenomena to simplify the system and use two separate coefficients to adjust disparities, our approach integrates these factors into a unified model.Experimental observations confirm that the polarization curve can still be divided into three distinct regions, each dominated by activation, diffusion, or ohmic phenomena.Since the operating temperature is supposed to be controlled, no thermal model is required.
1.1 Dynamic electrical model
For simulation purposes, the electrical circuit shown in Fig.1 has been used.
V cell is de scribed by
where V cel l is the cell voltage [V], V e the overvoltage in electrodes [V], Relz the cell resistance [Ω] , Icell the cell current[A], T th e cell temperature [K] and V re vthe reversible voltage [V], which is the minimum potential required to induce the water dissociation reaction between the two electrodes of an electrolysis cell [35], given by

where pH2 is hydrogen pressure [bar], p O2the oxygen pressure [bar], p0 the reference pressure [bar], an dΔ the Gibbs free energy at standard conditions [J/mol].
Applying the standard format of the Butler-Volmer equation, assuming equal co ncentrations of oxygen and hydrogen[36], (both set to 1), and accounting for the presence of hydrogen crossover current [35], we obtain
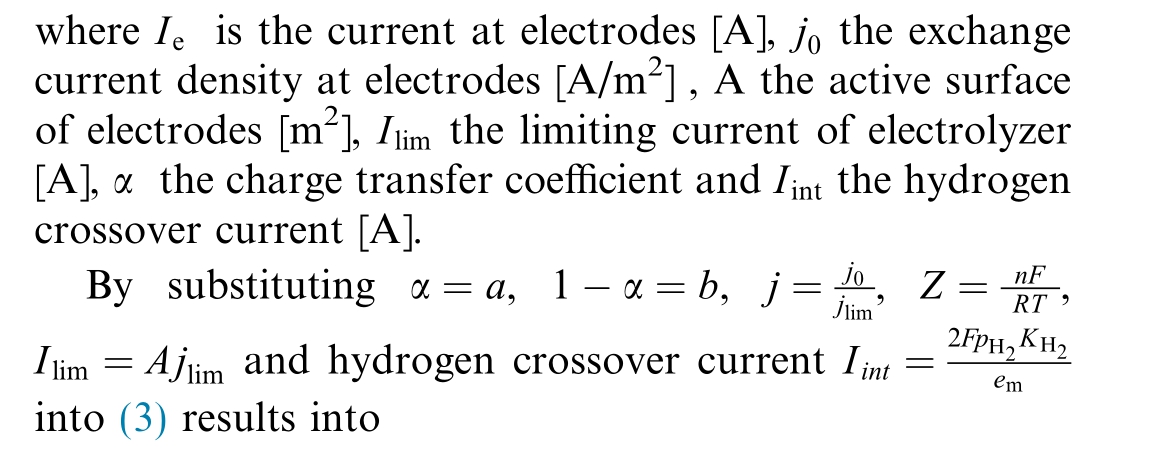
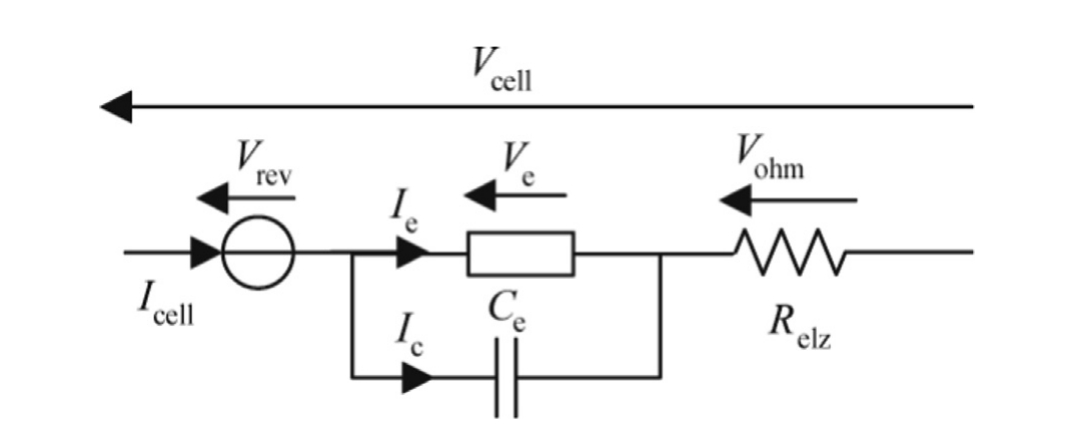
Fig.1.Dynamic electrical model.

where KH2 is the hydrogen permeability in Nafion [mol m![]() and emthe membrane thickness [m].
and emthe membrane thickness [m].
In order to consider the contribution of both electrodes,the equivalent charge transfer coefficient has been calculated by [36],
where αa is the charge transfer coefficient for anode, and αc is the charge transfer coefficient for cathode.
The exchange current densities for both electrodes,j0κ[A/m2], are modeled by [23],
where κ is either a (anode) or c (cathode), E0κ the activation energy [J/mol], r 0κ the rate parameter [mol/Ksm2 ].The exchange current density for the model can be obtained by [36]
The overvoltage in electrodes can be expressed by

where C eis the diffusion capacitance [F], l the length of diffusion [m], D the diffusion coeffici ent[m2/s],and R e the diffusion resistance [Ω].
To define the electrolyzer’s capacitance, both diffusion and activation capacitances must be considered.However,due to the dependency of activation capacitance on various operating parameters and the associated uncertainties,the analysis is limited to diffusion capacitance.The model incorporates two diffusion layers: the activation layer and the gas diffusion layer.These layers are neither configured in series nor in parallel, as outlined in the dynamic electrical model of an electrolyzer[36].To capture the characteristics of both layers, a hypothesis is prop osed, and an average is calculated using the following approach:

where lgdl is the gas diffusion layer (GDL) length [m], l al the activation layer (AL) length [m], D gdlthe diffusion coefficient in the GDL [m2/s] and Dalthe activation coefficient in the AL [m2/s].
In addressing the electrolyzer’s resistance, the cathode,anode, and membrane resistances are considered.However, the model specifically focuses on membrane resistance, recognizing it as the most influential factor.This resistance is calculated according to the method presented in [36]
where σmem is conductivity of the membrane [S/m] which can be defined as
1.2 Aging models
Several factors responsible for the degradation phenomenon in PEMWEs encompass a range of environmental and operational influences.The harsh environment,characterized by strong acidity and oxidative conditions,contri butes to component degradation, including catalyst dissolution, membrane thinning, and passivation of bipolar plates [21,22].Additionally, operating conditions such as temperature, pressure cycles, current density, and power generation cycles play significant roles.Material selection also impacts degradation rates.Commonly identified degradation indices include electrocatalyst and catalyst layer degradat ion, membrane degradation, bipolar plate degradation, and current collectors’ degradation.Our focus lies particularly on catalyst dissolution and membrane degradation [23,24].
1.2.1 Catalyst degradation model
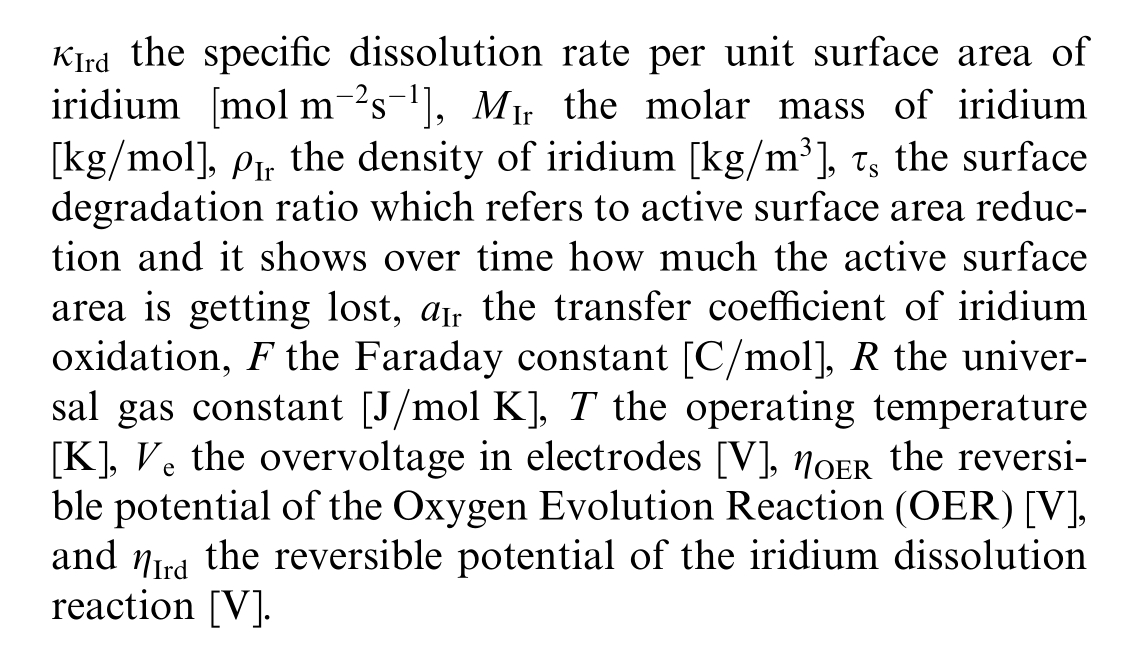
Catalyst degradation in PEMWEs, particularly the anode catalyst, occurs gradually due to the harsh electrochemical environm ent, meaning that it does not typically cause sudden failure [37].The stability of the anode electrocatalyst is particularly crucial because the anode operates at high potentials (>1.5 V).Iridium, commonly used as an anode catalyst, is known for its natural stability and resistance to chemical attack.However, during prolonged operation, iridium dissolution has been observed,especially under high current densities (4 A/cm2) [38].Shaun et al.[39] demonstrated that iridium nanoparticles experience significant dissolution and migration under such conditions.Long-term tests revealed that a considerable portion of the iridium particles diffuses into the membrane, leading to a reduction in the electrochemical surface area(ECSA)and an increase of the activation of the overpotential, which is indicative of surface degradation [40].
Despite its inherent stability, iridium can dissolve over thousands of hours of operation when exposed to radical attack and high potentials [24].The Iridium dissolution degradation defined in[24] is modified to define the surface degradation ratio![]() as the solution of the following ODE
as the solution of the following ODE

1.2.2 Membrane degradation model
It has been widely accepted that hydrogen peroxide( H2O2) and related radical species such as hydroperoxyl( HO2) and hydroxyl (HO) are generated by the crossover gases on the catalytic surface.These oxidizing species will attack the ionomer, leading to chain scission, unzipping,and loss of functional groups [37].Subsequently, the perfluorosulfonic acid backbone of the membrane degrades with a resulting fluoride and sulfur release, membrane thinning, and degradation.
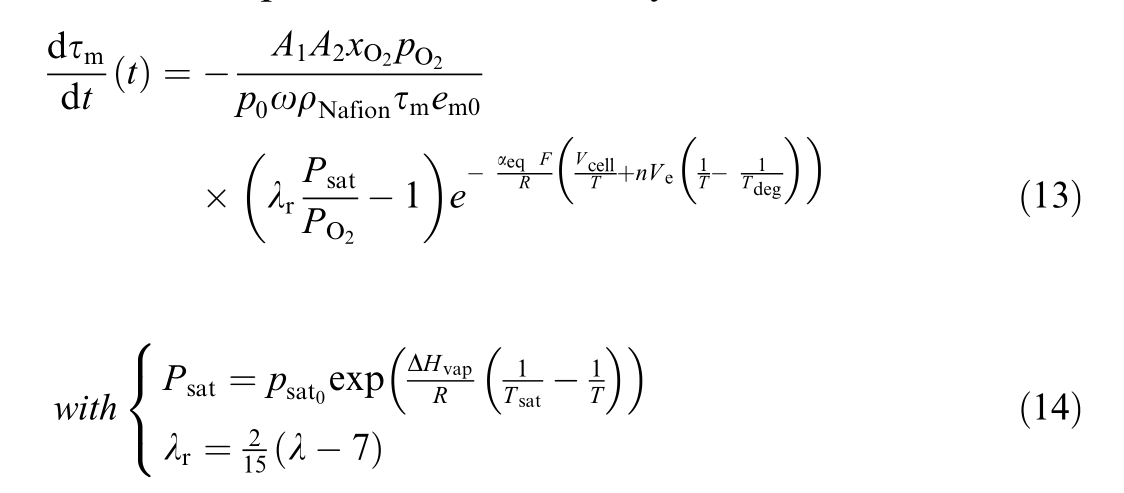
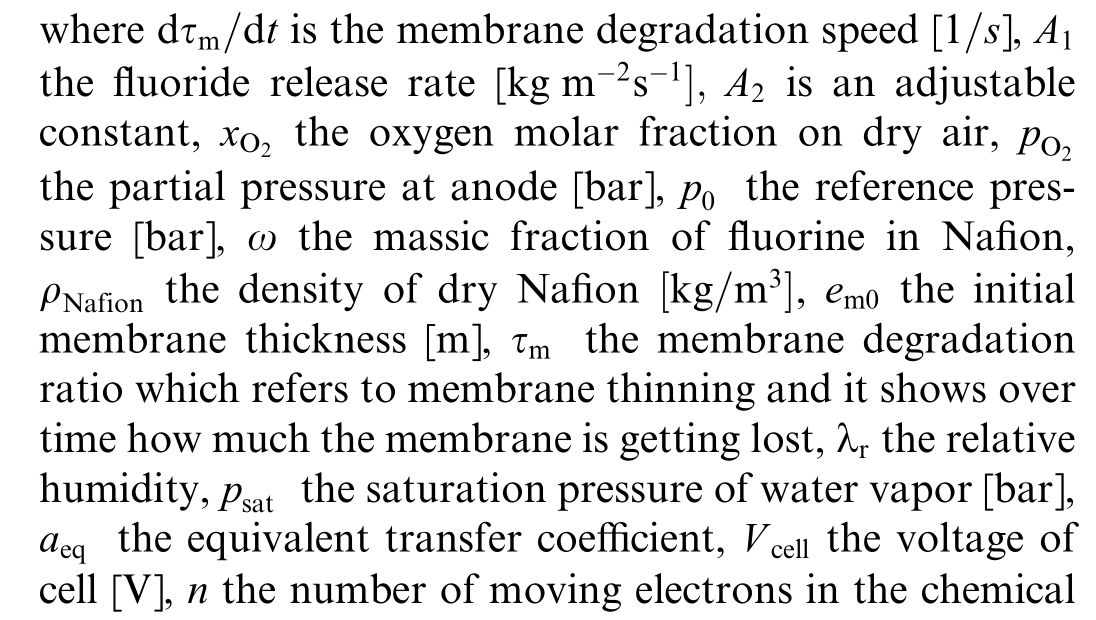
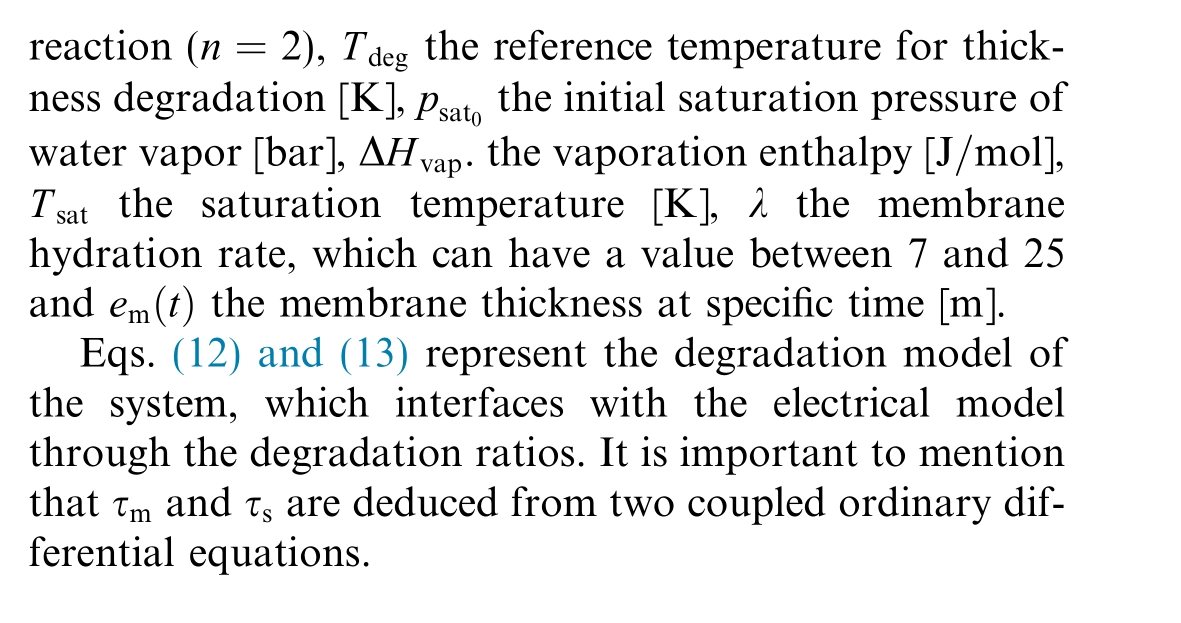
In this section, a model for membrane degradation is presented.While the foundational aspects of this model are based on the semi-empirical membrane degradation model described in [23], the specific development of the rate of membrane thickness degradation, denoted as![]() with
with![]() provides a quantitative assessment of membrane degradation.This degradation is prim arily due to oxygen crossover,which leads to hydrogen peroxide production and fluoride release.The evolution of this process is described by:
provides a quantitative assessment of membrane degradation.This degradation is prim arily due to oxygen crossover,which leads to hydrogen peroxide production and fluoride release.The evolution of this process is described by:
1.3 Electrical model including aging models


Finally, the resistance of electrolyzer can be obtained by

where τr is resistance degradation ratio.
1.4 Steady state model
The mathematical models used to describe the polarization curve of an electrolysis cell are based on physical laws and empirical equations and involv e parameters with physical meaning.The steady-state model is obtained by removing the capacitor of Fig.1.This steady state electrical model can be simplified by neglecting the second term of the Butler-Volmer equation, which represents the reverse redox chemical reaction.
In fact, the dynamic electrical model which has been presented in the previous section is simplified by removing the dynamic part, so (15) is simplified and becomes:
Overvoltage in electrolyzer![]() is calculated by simplifying (18) and substituting the simplified express ion into Eq.(1), yielding the cell voltage (20).
is calculated by simplifying (18) and substituting the simplified express ion into Eq.(1), yielding the cell voltage (20).

1.5 Linear polarisation curve model
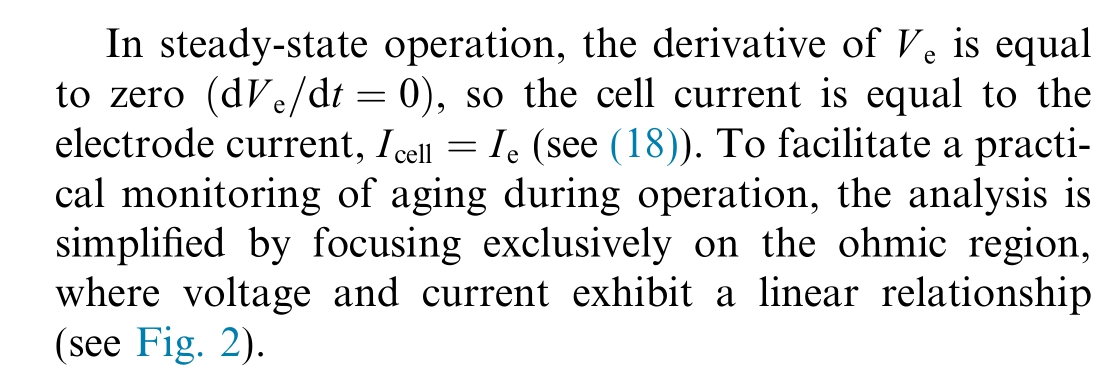
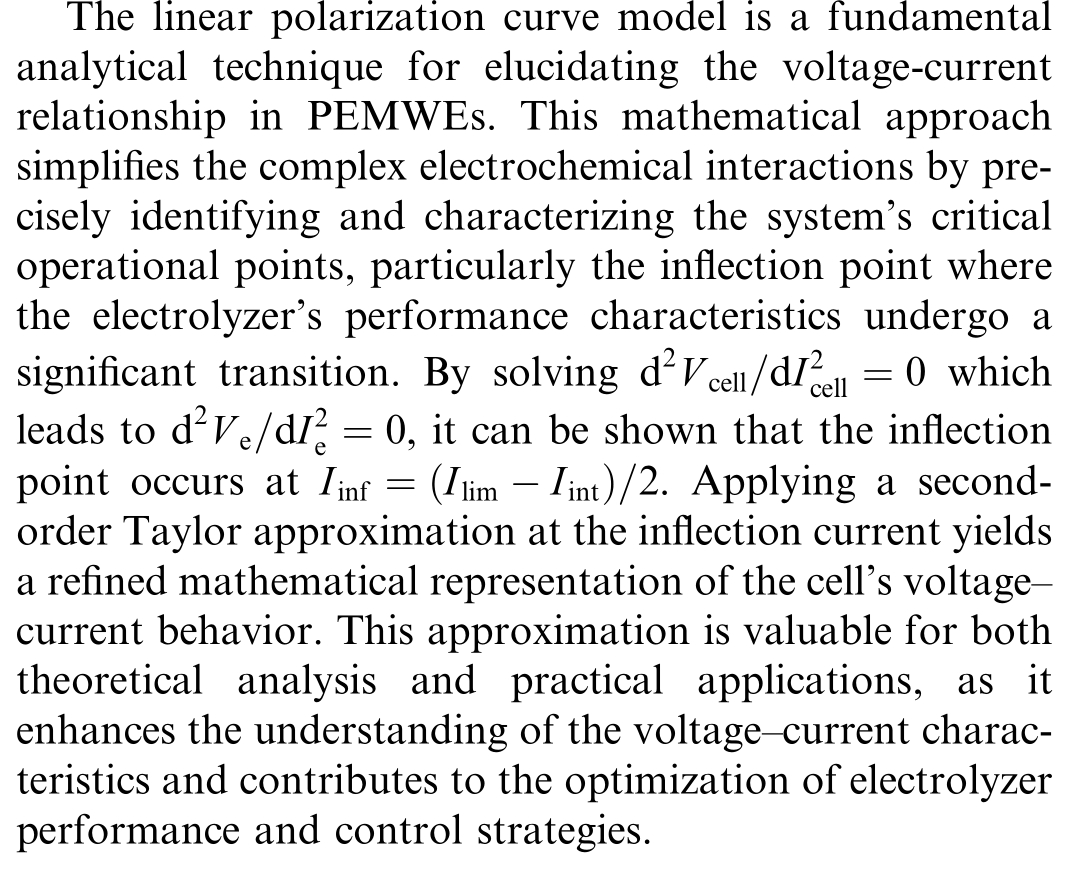

with


Fig.2.Linear model for PEMWE.
2 Sensitivity analysis study
Sensitivity analysis helps to evaluate the model’s response to changes in key parameters, identifying those with the greatest impact.In this study, sensitivity analysis focused on parameters affecting the system’s slope and off-set.By deriving partial derivatives of these variables with respect to aging parameters, this approach quantifies how parameter changes influence the system’s response.These insights are vital for refining the identification method and ensuring robust performance under varying conditions.
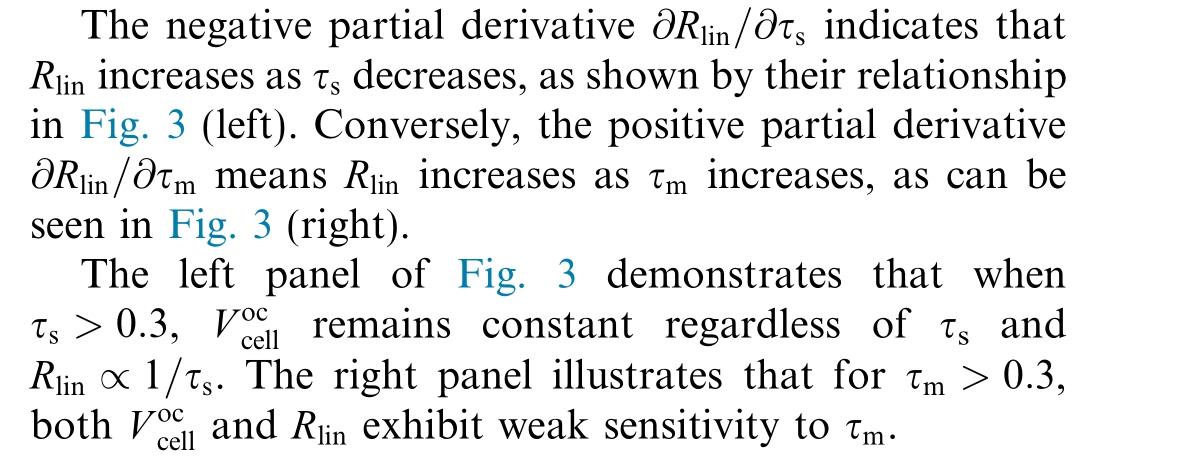

In a similar manner, the sensitivity of![]() with respect to τs and τmcan be expressed as
with respect to τs and τmcan be expressed as

Based on the sign of the partial derivatives of the offset with respect to τs an d τm,the offset increases as both aging parameters decrease, which is consistent with Fig.3.
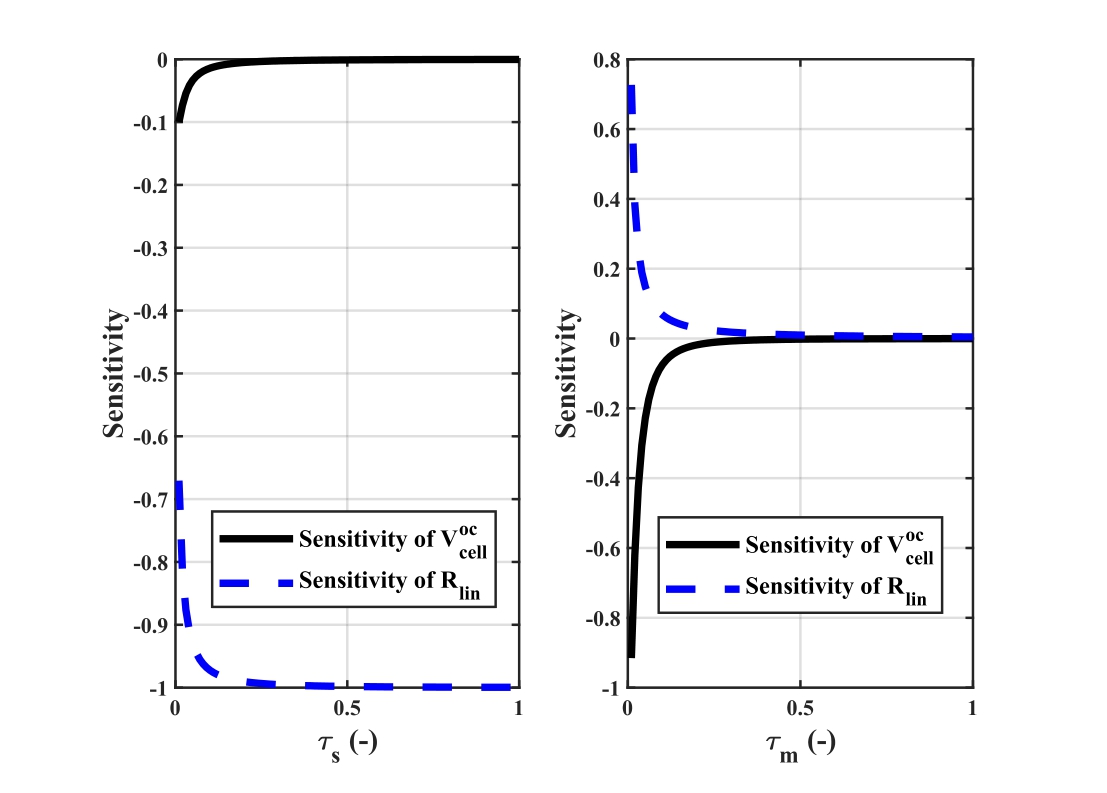
Fig.3.Slope and offset sensitivity response for aging parameters between zero to one.
Based on the sensitivity study and the provided figure,the negligible influence of τmand the minor variations in offset support the conclusions that τmcan be assumed as 1 to simplify the model and the offset![]() is less significant comparedto the slopeRli n,whichshould be the primary focus foraccurate analysisandpractical application.
is less significant comparedto the slopeRli n,whichshould be the primary focus foraccurate analysisandpractical application.
3 Invertibility analysis study
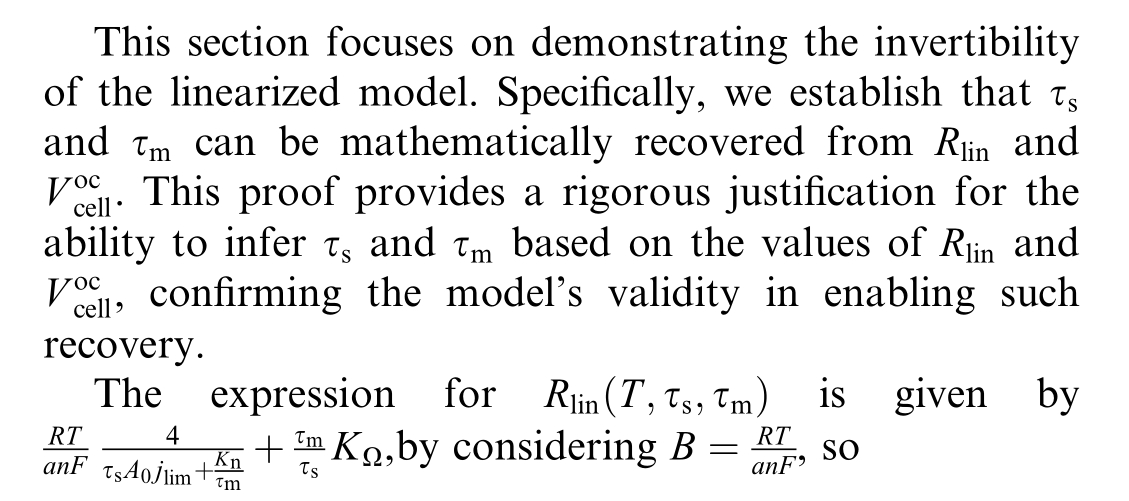

According toEqn 21 and 22, the following expression can be deduced
Defining![]() the expression becomes
the expression becomes

From the following equation, τscan be calculated based on τm
By substituting Eqn 30 into Eqn 27 we reach the following second-order pol ynomial equation

Once τm is found, τs can be calculated using![]()
4 Results and discussion
4.1 Experimental results
In this study, four identical electrolyzers connected in series were tested under identical conditions using an experimental test bench.Fig.4 presents the general schematic of the experimental test bench.The PEM electrolyzer cells investigated in this study were dual-cell electrolyzers from H-Tec Education (College Station,TX,USA).IrOx blend is used at the anode,while the cathode is loaded with 60% Pt/C.A titanium mesh was used as a flow-field and current collector for both electrodes.A DC voltage generator was employed to apply a stable and adjustable voltage to the electrolyzers.This series configuration ensures that all four electrolyzers share the same current,making it easier to study the performance of each cell under identical electrical conditions.A current sensor,represented as ‘A’ in Fig.4, was installed in the circuit to continuously monitor the current flowing through the system.To ensure precise monitoring of the voltage and current across each electrolyzer, the data acquisition and control system was interfaced with a LabVIEW software.LabVIEW was used to collect real-time data on both current and voltage during the experiments.By utilizing this platform, we were able to monitor, record, and analyze data dynamically, ensuring the accuracy of the measurements and real-time control during the testing.Throughout the process, the temperature was maintained constant.A stair-step current profile for obtaining the polarization curve is introduced, mathematically defined as![]() where n represents the step index,allowing for controlled and incremental current increases.Each step is maintained for 30 seconds to ensure the system reaches a steady-state condition, minimizing transient effects and capturing representative electrochemical behavior.
where n represents the step index,allowing for controlled and incremental current increases.Each step is maintained for 30 seconds to ensure the system reaches a steady-state condition, minimizing transient effects and capturing representative electrochemical behavior.
Fig.5 effectively demonstrates the polarization curve model and experimental polarization curve for one of the electrolyzer, as evidenced by the close alignment with experimental data.The polarization curve model ( blue line with circular markers) closely follows the experimental data (black line with circular markers), demonstrating the model’s effectiveness in capturing the real electrochemical behavior of the PEMWE.Minor deviations at some current densities may be due to experimental uncertainties or unmodeled phenomena, but overall, the agreement is strong.The inflection point (red circle) around 8.6 A marks that the concavity of polarization curve has changed.Identifying this point is crucial for optimizing the operating conditions of the electrolyzer to avoid efficiency losses due to mass transport limitations.
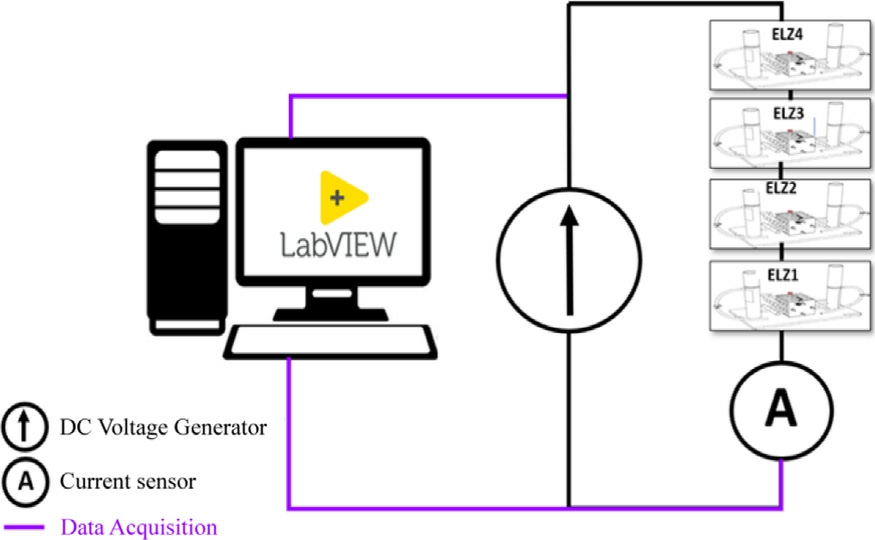
Fig.4.Experimental test bench setup schematic.
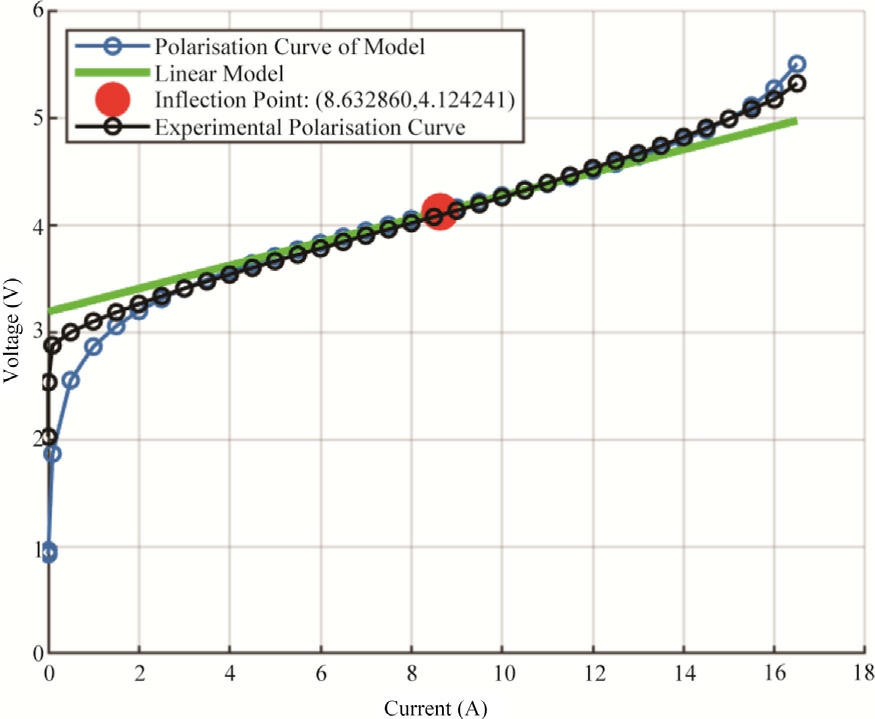
Fig.5.Polarization curve of two cells of PEMWE in series, Models and Experimental Results.
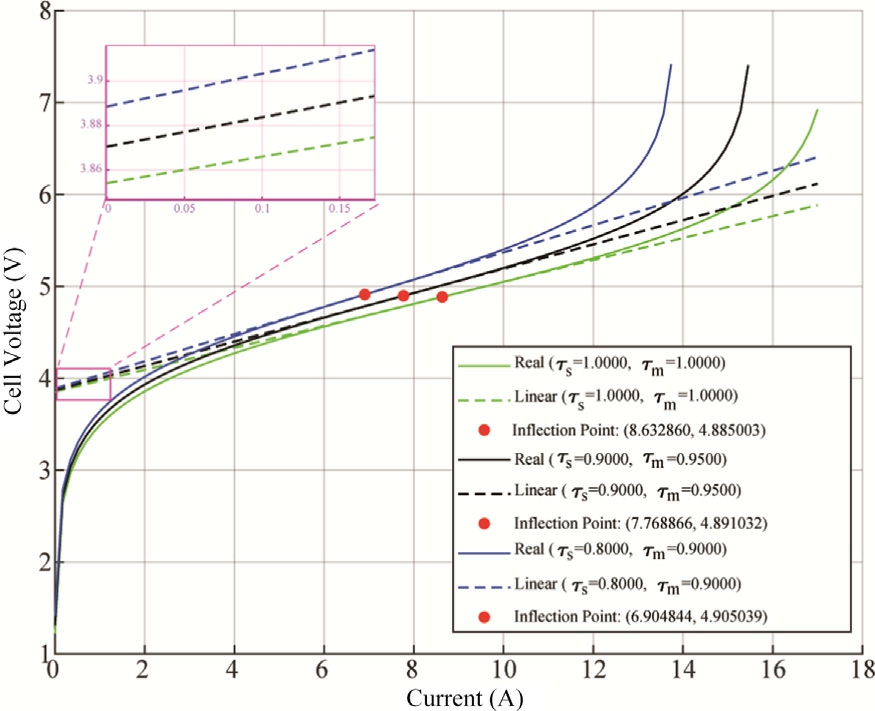
Fig.6.Polarization curve of two cells of PEMWE in series,obtained for three distinct degradation ratios.
4.2 Simulation results
The polarization curve shown in Fig.6 illustrates the relationship between the cell voltage (V) and the cell current (A) for a PEMWE under various surface and membrane degradation ratios.The curves are plotted for three sets of degradation parameters.Each pair of solid and dashed lines represents the real and linear approximations of the electrolyzer performance, respectively.As the degradation increases, the cell voltage at a given current increases thus the power increases.This indicates higher overpotentials due to degradation, manifesting as additional resistive and activation losses within the cell.The real model (solid lines) captures the true performance of the electrolyzer,including nonlinearities and detailed overpotential contributions.The linear model (dashed lines)provides an approximation that is more accurate in the ohmic region of the polarization curve,where the relationship between voltage and current is approximately linear.This region typically occurs at intermediate current densities.At lower and higher current densities, deviations between the real and linear models become more pronounced.The linear model underestimates the activation losses at low currents and the voltage at high currents due to mass transport limitations.
A significant feature confirmed by this analysis is the presence of inflection points (marked with red dots) that indicate the transition between different operating regimes.As electrolyzer aging progresses (decreasing τs and τmvalues), the current at which these inflection points occur systematically decreases from 8.6 A (τs = 1, τm= 1) to 7.7 A( τs = 0.9, τm = 0.95) and further to 6.9A (τs=0.8,τm= 0.9).Notably, while the inflection point currents decrease substantially with aging, the corresponding voltages remain nearly constant at approximately 4.9 V across all degradation states.This consistency in inflection point voltage provides a valuable diagnosis indica tor.It suggests that while aging affects the current at which the transition between operating regimes occurs,the voltage requirement for this transition remains stable.This phenomenon could potentially be used as a benchmark for condition monitoring and state-of-health assessment of the electrolyzer during its operational lifetime.This phenomenon can be described mathematically through the following relationship, which defines the voltage at the inflection point:

The heatmap visualization, derived from the mathematical model(32), confirms that despite significant variations in both τs (0.5 to 1.0) and τm(0.7 to 1.0), representing different stages of electrolyzer aging, the cell voltage at the inflect ion point remains within a narrow band of approximately 2.044-2.053 V.This restricted voltage range is less than 0.5%.
This finding has significant implications for practical implementation of electrolyzer diagnosis systems, as it provides a consistent benchmark against which performance degradation can be measured.By monitoring deviations from this expected inflection point current, operators could potentially detect anomalous behavior indicative of accele rated degradation or component failure requiring intervention.Experimental validation of this theoretical finding would be valuable future work to confirm its practical utility in real-world electrolyzer systems.
Similar to the polarization curve, Fig.8 shows the power curves for three degradation conditions.As degradation increases, the maximum achievable powerdecreases.This is due to the combined effect of increased cell voltage and reduced current capacity (limiting current).With an increased degradation, the peak power point shifts to lower currents, and the maximum power output decreases.This shift highlights the need for careful monitoring and mitigation of degradation to maintain optimal performance.
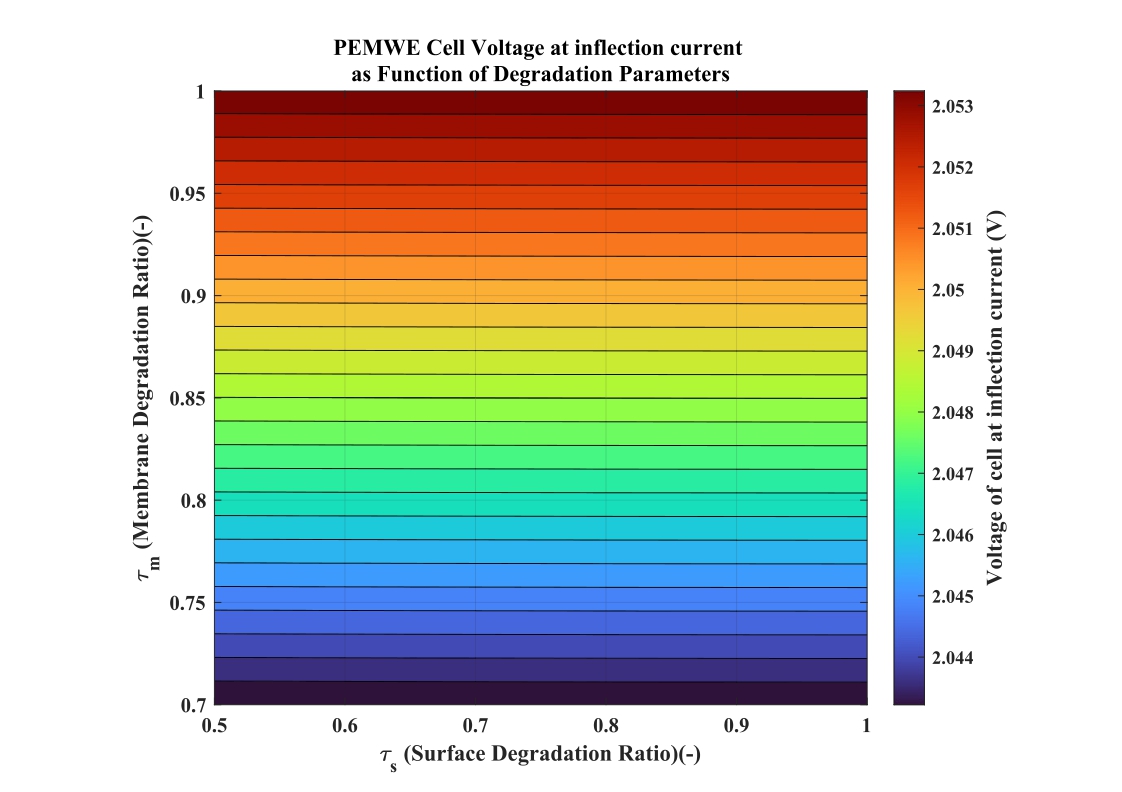
Fig.7.Voltage of cell at inflection current for different values of τs & τm.
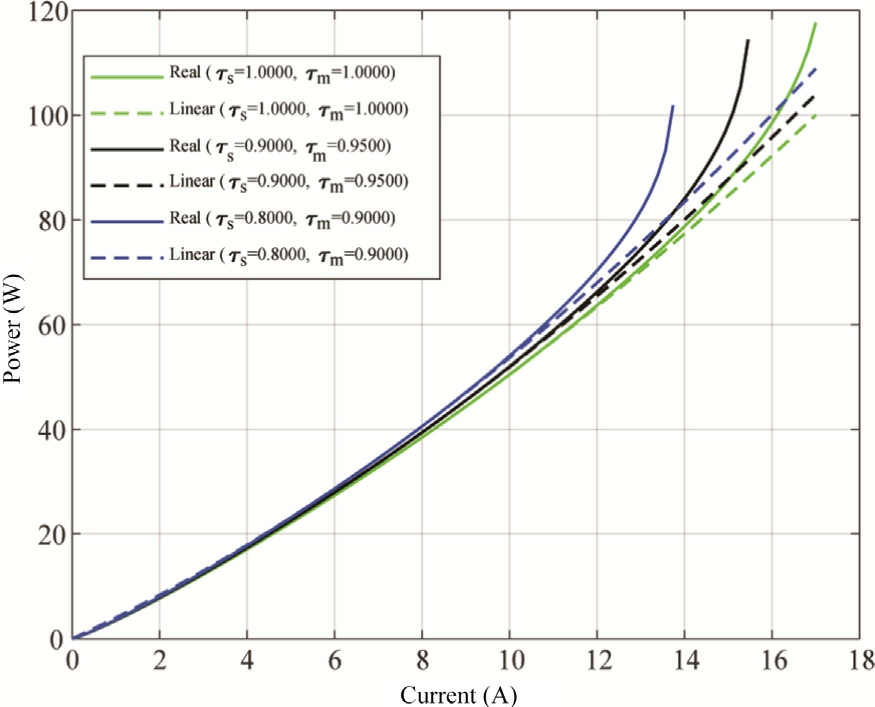
Fig.8.Power curve of two cells of PEMWE in series,obtained for several degradation ratios.
Given that the nominal current of the investigated electrolyzer is 4.5 A, it is expected to operate continuously at this current for approximately 4.5 years.Over this operational period, it is hypothesized that surface degradation will reduce performance to approximately 70% of its initial value, whi le membrane degradation will result in a smaller decline,to about 95%of its original state.This assumption is based on the relatively low variation observed in the membrane degradation ratio τm.
This hypothesis is supported by several established studies on electrochemical degradation mechanisms.It is well documented that surface degradation progresses much faster than membrane degradation (i.e., τs < <τ m),indicating that membrane thinning is a more gradual process [41].Surface degradation processes, such as catalyst layer deterioration, fouling, and the loss of active sites,occur more rapidly because they are directly in contact with the electrochemical reaction.Since these processes happen right at the reaction site, they quickly reduce the effective surface area, leading to a more immediate impact on the cell’s performance.These processes can lead to a significant and relatively quick reduction in the functional surface area available for electrochemical reaction.However, if we consider the inverse scenario ![]() where membrane thinning becomes the dominant degradation,the membrane’s role as a separator could be compromised.This could lead to a dangerous mixture of oxygen and hydrogen, potentially resulting in catastrophic consequences, such as severe system failure or even explosions,rendering the electrolyzer useless [37].
where membrane thinning becomes the dominant degradation,the membrane’s role as a separator could be compromised.This could lead to a dangerous mixture of oxygen and hydrogen, potentially resulting in catastrophic consequences, such as severe system failure or even explosions,rendering the electrolyzer useless [37].
Figs.9 and 10 illustrate the degradation behavior of both the surface and the membrane over a period of five years for constant current profile (I = 4.5 A).As shown in Fig.9, the surface degradation progresses gradually,with the surface degradation ratio (τs)decreasing steadily over time.By approximately 4.5 years, this ratio reaches a value near 0.7, which indicates that around 30% of the surface’s initial active area has been lost due to degradation.The marked red point highlights this significant threshold, emphasizing a key moment in the degradation process.Despite this loss, the degradation remains relatively slow and stable for most of the operational period,only accelerating closer to the end.
Similarly, Fig.10 presents the membrane degradation ratio ( τ m), which exhibits an even slower rate of deterioration.Over the same period, the membrane retains approximately 95% of its original structural integrity,experiencing only about a 5% decline.
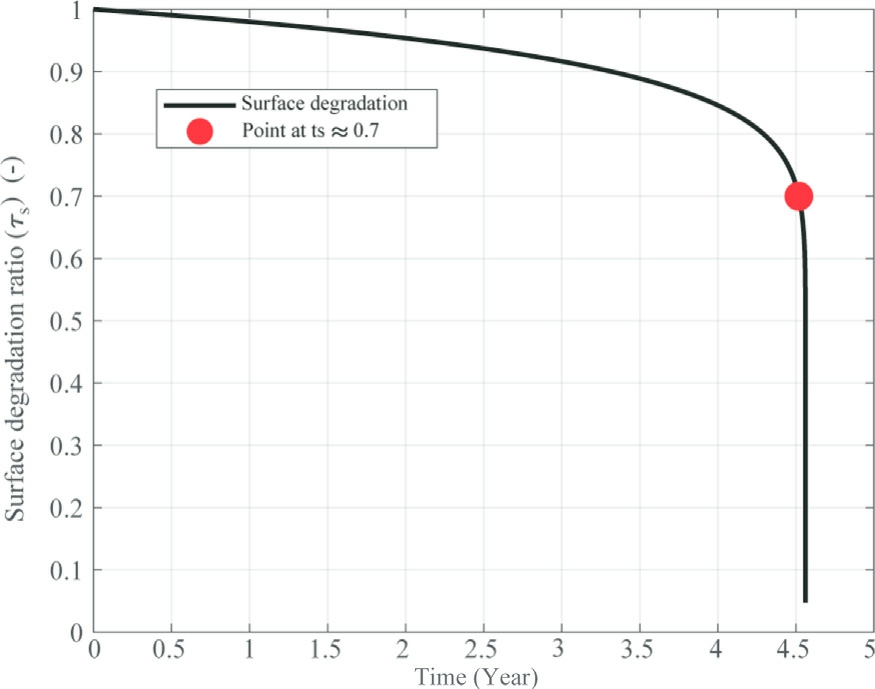
Fig.9.Evolution of surface degradation ratio over time for constant curent profile.
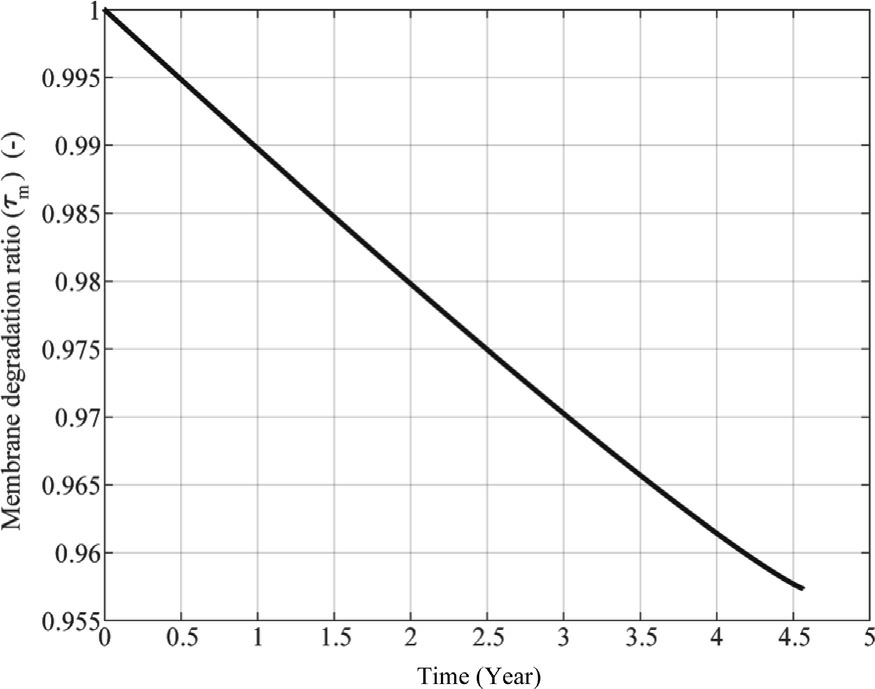
Fig.10.Evolution of membrane degradation ratio over time for constant curent profile.
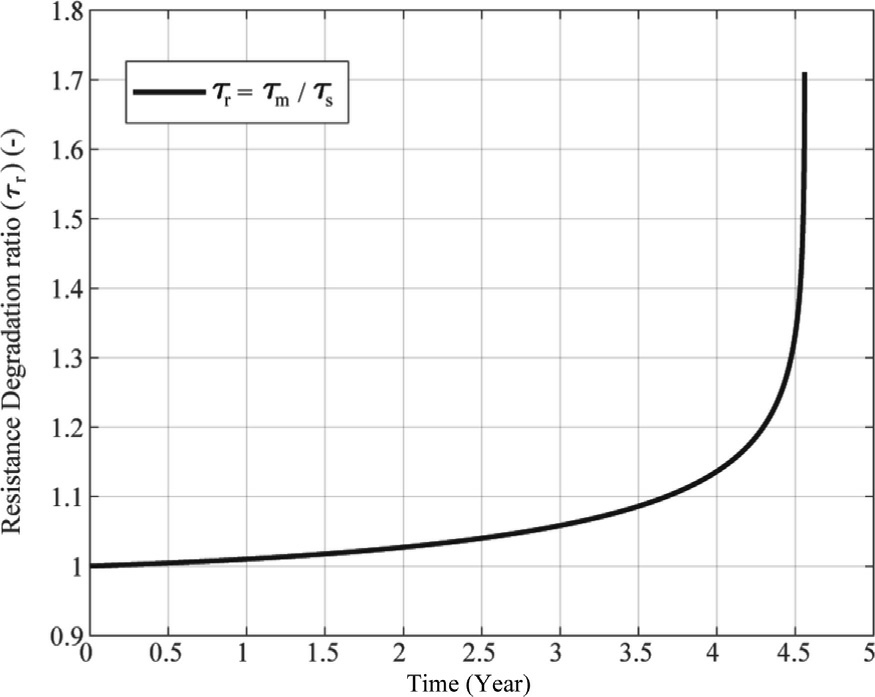
Fig.11.Evolution of resistance degradation ratio over time for constant curent profile.
Fig.11 illustrates how the resistance of the electrolyzer evolves with aging.The resistance degradation ratio increases gradually over time and shows an accelerated rise after around 4 years.This suggests that the aging process is initially slow but becomes more severe later in the electrolyzer’s life cycle.The sharp rise near the end of the 5-year period could signal the need for maintenance or replacement before efficiency drops drastically.
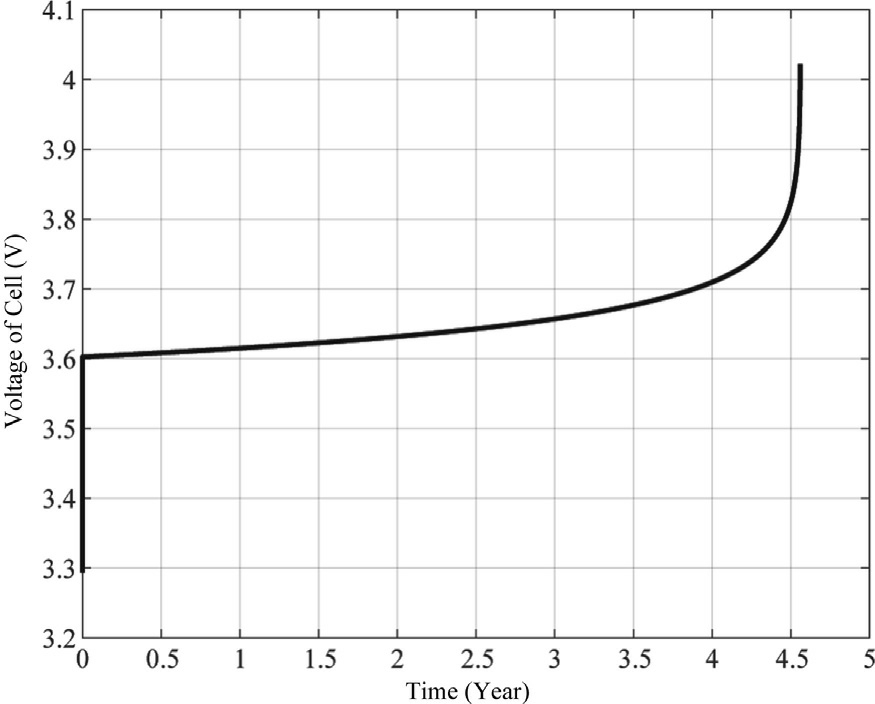
Fig.12.Cell voltage of PEMWE for constant current profile.
The voltage behavior of the electrolyzer over time is illustrated in Fig.12.The profile demonstrates a multiphase degradation pattern characteristic of PEM electrolysis systems under extended operation.Initially, the cell voltage exhibits a rapid stabilization from 3.3 V to approximately 3.6 V, representing the conditioning phase as electrochemical interfaces are established.Subsequently, a gradual and nearly-linear voltage increase is observed over the first four years of operation, with voltage rising from 3.6 V to approximately 3.7 V,corresponding to a degradation rate of approximately 25 mV/year during this steadystate phase.This moderate increase is consistent with typical degradation mechanisms including catalyst particle agglomeration, membrane thinning, and gradual accumulation of contaminants at reaction sites.The most significant finding is the pronounced exponential acceleration in voltage degradation observed after the 4-year mark,where cell voltage rapidly increases from 3.7 V to over 4.0 V within a span of less than one year.This terminal degradation phase indicates critical failure mechanisms becoming dominant, likely involving irreversible catalyst layer delamination, severe membrane chemical degradation, or catastrophic loss of interfacial contact between components.The sharp voltage increase serves as a definitive indicator of stack end-of-life,as operation beyond this point would result in prohibitively high energy consumption and potential system damage.This degradation profile provides valuable insights for developing predictive maintenance protocols and improving electrolyzer stack longevity for industrial hydrogen production applications.
Fig.13 demonstrates the effect of different current application protocols on the longevity of an electrolyzer using the dynamic model.Two distinct protocols were used: one with a constant current of 4.5 A and another with a square wave current averaging 4.5 A, peaking at 4.9 A, dipping to 4.1 A, and having a period of 10 s.As shown in Fig.13, the electrolyzer’s lifespan decreases when subjected to the square wave current signal.The blue curve corresponds to the square wave current, while the black curve represents the constant current.
The surface degradation ratio τs,shown on the vertical axis, decreases more rapidly under the square wave protocol, indicating accelerated material degradation.Notably,the system reaches the critical degradation threshold of τs= 0.7 significantly earlier under the square wave condition—around 3.4 years—compared to approximately 4.5 years with constant current.These critical points are highlighted with green and red markers, respectively.This stark contrast emphasizes the detrimental impact of current fluctuations on the electrolyzer’s surface durability,even when the average current remains the same.The results underscore the importance of current profile optimization in prolonging electrolyzer service life.
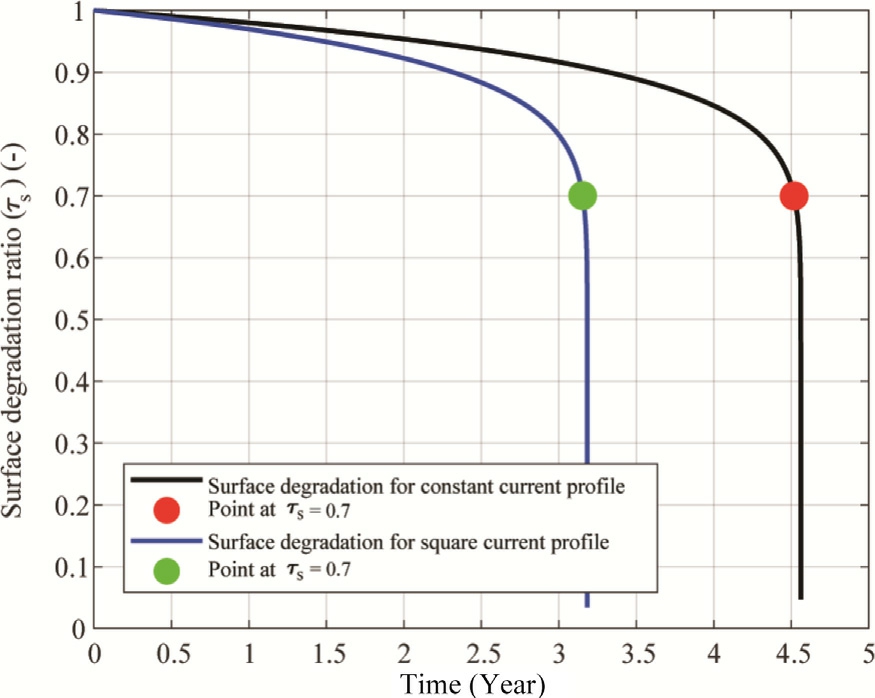
Fig.13.Surface degradation ratio evolution for two different current profiles.
According to the Faraday’s law, hydrogen production rate of an electrolyzer with n cell(number of cell)cells in series can be estimated by the given equation:
Fig.14 illustrates the variation of the hydrogen production rate as a function of current input.This figure shows a linear dependence between hydrogen production rate and current input of PEMWE cell.Production rate increases linearly with the current intensity from 0.0335 cm3 /min at low current input of 0.0024 A to up to 229.9817 cm3/min at high current input of 16.5 A.The ratio of average hydrogen production rate to the average current input is 13.9382 cm3/min/A.
The Cell power versus the hydrogen production rate for different degradation rates is shown in Fig.15.There is a non-linear, positive relationship between power and hydrogen flow rate, indicating diminishing returns at higher power levels.As power increases, the hydrogen production rate also increases for all degradation rates.However, higher degradation (represented by lower values of τs and τm)result in a reduced hydrogen production rate.This indicates that degradation negatively impacts the efficiency of hydrogen production, highlighting the importance of maintaining system integrity to achieve optimal performance.
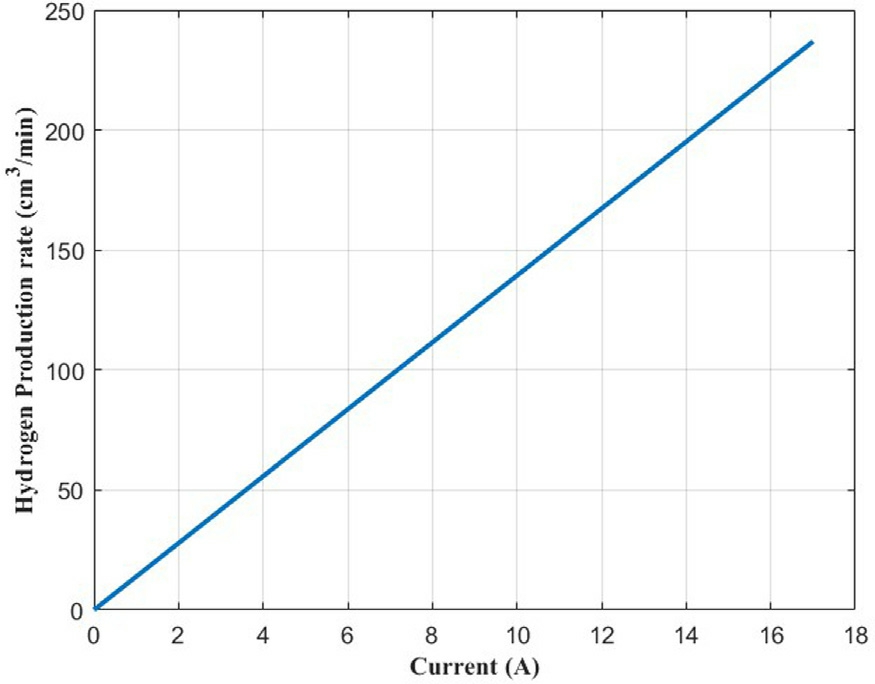
Fig.14.Production rate of hydrogen as a function of current.
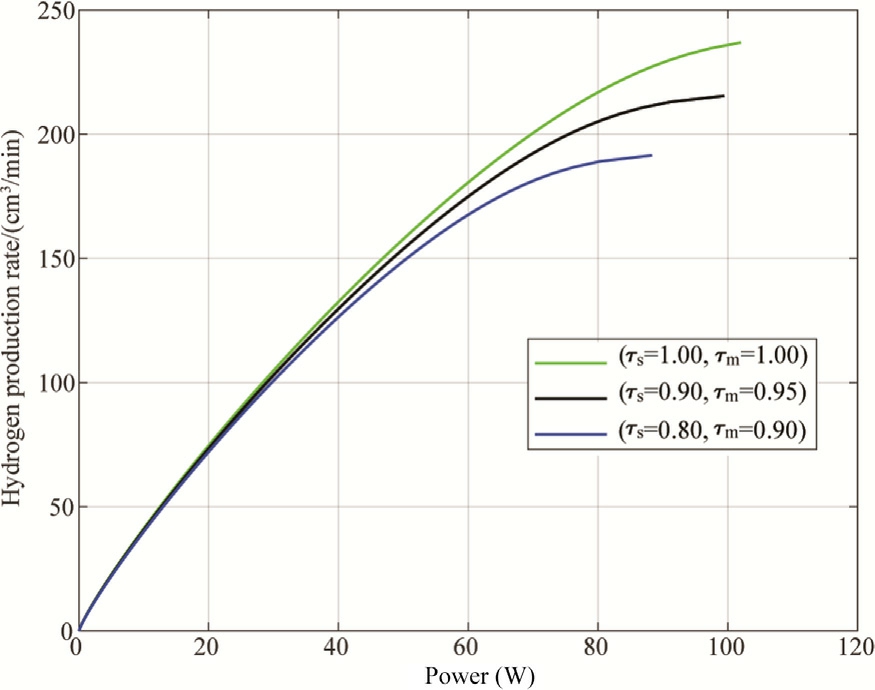
Fig.15.Hydrogen production rate as a function of power for different degradation ratios.
Fig.16 illustrates the relationship between hydrogen production rate and total hydrogen volume output over an electrolyzer’s complete operational lifetime, incorporating degradation effects.The electrolyzer under study has a nominal operating current of 4.5 A with an expected lifetime of 4.5 years under constant applied current.However,by systematically testing currents ranging from 0 to approximately 16 A (almost four times the nominal current), this study reveals a counterintuitive optimization point where moderate operation significantly outperforms both nominal and maximum-capacity operation.
The optimization curve was generated using a systematic simulation strategy that models electrolyzer behavior across different input current, testing the electrolyzer far beyond its design specifications.The methodology follows a four-step process where each simulation uses an effectively infinite time span to allow the electrolyzer to operate until natural degradation causes failure.Different current values are applied systematically across the range currents = 0:0.1:16, extending from zero up to approximately four times the nominal current (4.5 A), representing various production intensities from shutdown to extreme overload conditions.
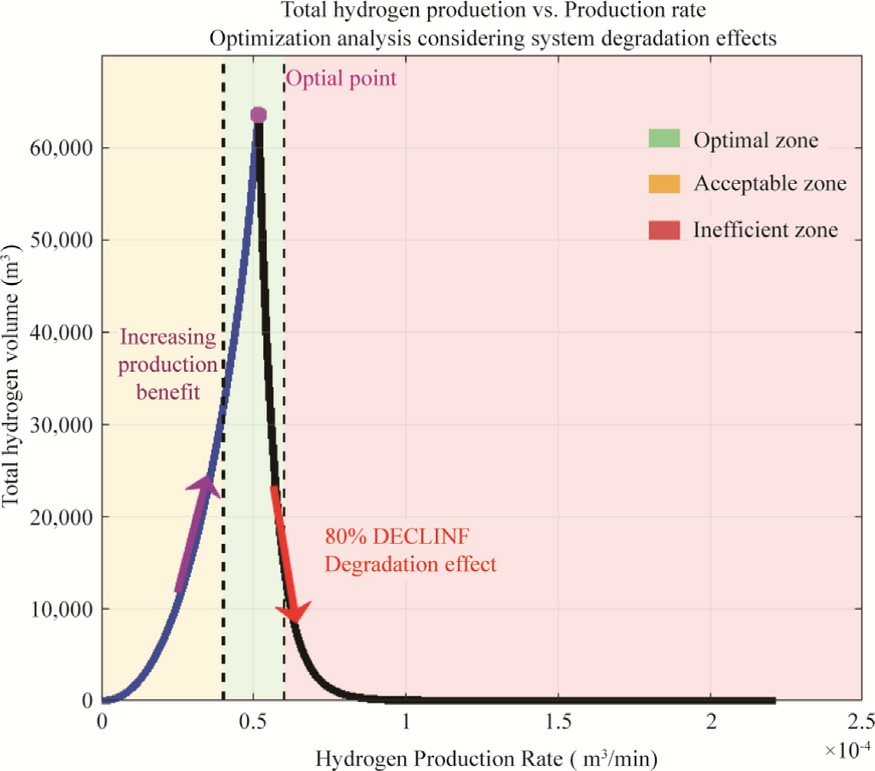
Fig.16.Volume of hydrogen produced as a function of production rate.
The simulation incorporates real-time degradation effects that progressively reduce electrolyzer performance over time.For each current level, the simulation runs until the electrolyzer can no longer maintain operation due to degradation, automatically determining the operational lifetime.This process creates data points that map production rate to total lifetime hydrogen output, accounting for the trade-offbetween production speed and operational longevity.
This figure demonstrates three distinct operational zones that characterize electrolyzer performance across the tested current range.The data points form a pronounced peak around a production speed of 5.15 10-5 m3 /min, corresponding to an optimal operating current of 3.7 A, where the hydrogen production volume reaches its maximum of approximately 6.3 104 m3.This peak represents the critical balance point where the electrolyzer achieves its maximum possible operational lifetime while maintaining sufficient hydrogen production rate to maximize total output over the system’s complete lifecycle.
The optimal zone (green region) encompasses operating conditions near 3.7 A, where the electrolyzer operates at 82% of its nominal capacity but delivers superior lifetime performance compared to nominal operation at 4.5 A.In this range, the system runs longer, which makes up for the slightly slower production speed—leading to the highest overall hydrogen output.The acceptable zone (yellow region) represents operating conditions that provide reasonable performance with some efficiency loss compared to optimal conditions, while the insufficient zone (red region) indicates significant underperformance where either production rates are too low to effectively use the extended lifetime, or currents are too high, causing rapid degradation that severely limits total output.
Beyond the optimal point, the curve exhibits a dramatic decline in performance, with hydrogen production falling by approximately 80% when the operating current changes from 3.7 to 4.4 A.This sharp decrease occurs because higher operating currents accelerate degradation mechanisms within the electrolyzer stack exponentially rather than linearly, significantly shortening operational lifetime while the increased production rate cannot compensate for the reduced operational period.At operating currents below the optimal point, the system produces hydrogen too slowly to effectively use the extended ope rational lifetime, while currents above the optimal point sacrifice lifetime for minimal production gains, resulting in substantially lower total hydrogen output over the system’s complete operational cycle.
This graph highlights the importance of optimizing production speed to achieve maximum efficiency in hydrogen production processes.The counterintuitive finding that moderate operation outperforms maximum-capacity operation has significant implications for industrial applications, suggesting that electrolyzer systems should b e deliberately operated below their maximum capacity to optimize economic returns and total hydrogen yield over their service life.
5 Conclusion
In this study, we investigate the complex electrical behavior of PEMWEs, which are pivotal for sustainable hydrogen production.By analyzing both static and dynamic electrical models, we gain insights into the steady-state and transient responses of these electrolyzers.The static models explain voltage-current characteristics,polarization phenomena, and overall efficiency, while dynamic models offer a deeper understanding of timedependent performance and system reactions to various inputs.The modeling approach integrates membrane permeability to hydrogen and the interaction between activation and diffusion in a unified framework, rather than decoupling these phenomena as often seen in conventional models.This integration allows for improved accuracy while maintaining the representation of three distinct regions in the polarization curve: activation-dominated,ohmic-dominated, and diffusion-dominated.
The study also explores the crucial factors contributing to electrolyzer degradation, including electrode corrosion,membrane thinning and catalyst dissolution.Two specific aging parameters are defined in the model which are the reduction in active surface area and the reduction in membrane thickness.Integrating these parameters into the electrical framework provides valuable knowledge about how degradation processes evolve over time and affect electrolyzer efficiency and durability.These two parameters serve as a powerful tool for developing non-intrusive diagnosis methods for monitoring the state of hea lth of electrolyzers in real-time simulation.The integrated modeling approach enables more accurate lifetime predictions and facilitates the development of mitigation strategies.
Additionally, a linear polarization curve is presented as a simplified model, which serves as a practical tool for diagnosis development and aging parameter estimation in further research.Building on this foundation, a novel non-intrusive diagnosis algorithm has been developed based on slope, offset, and inflection point analysis, which plays an important role in estimating the state of health of the electrolyzer.In future work, the comprehensive diagnosis methodology based on this de veloped model will be presented and validated by experimental data.The streamlined approach maintains sufficient accuracy while reducing computational complexity, making it suitable for real-time monitoring applications and control systems.
The integrated modeling approach described in this study paves the way for creating methods to improve electrolyzer reliability.These advancements represent critical steps toward fulfilling the full potential of electrolysis technology for sustainable hydrogen production in various applications, from grid-scale energy storage to decentralized hydrogen generation.
From an economic perspective, our analysis reveals a counterintuitive yet critical finding: moderate operation outperforms maximum-capacity operation in terms of overall hydrogen yield and economic returns.This optimization of production speed to achieve maximum efficiency highlights that electrolyzer systems should be deliberately operated below their maximum capacity to optimize economic performance over their service life.The economic implications are substantial for industrial applications, as this operational strategy can significantly improve the total cost of ownership while extending system durability and maximizing long-term hydrogen production output.
Moreover, our experimental polarization curve measurements align closely with the theoretical polarization curve,validating the accuracy and applicability of our model.
CRediT authorship contribution statement
Haniyeh Marefat: Writing - review & editing, Writing -original draft, Investigation, Formal analysis, Conceptualization.Francois Auger: Validation, Supervision, Formal analysis, Concept ualization. Jean-Christophe Olivier: Validation, Supervision. Mohammed Rharda: Software.
Declaration of competing interest
The authors declare the following financial interests/personal relationships which may be considered as potential competing interests: Haniyeh Marefat reports financial support was provided by Comeca France.If there are other authors, they declare that they have no known competing financial interests or personal relationships that could have appeared to influence the work reported in this paper.\
Acknowledgments
This research was supported by COMECA France.We grate fully acknowledge their funding and partnership.Many thanks for the experimental mate rials in IREENA laboratory.
Appendix A
This appendix presents the methodology for calculating the inflection point, a critical step in deriving the linearized polarization curve.To apply the second-order Taylor series approximation around the inflection point, it is necessary to compute the first and second derivatives of both V cel l and V e with respect to Icell.
The second-order Taylor series approximati on is given by:

The first-order derivative of V cell and V e with respect to Icell is:

The second-order deriva tive is:


Appendix B
For the sake of clarity, all parameters employed in our model and experiments are summarized in the following tables.These parameters are classified into four distinct categories: (1) general simulation parameters (Table 1);(2) fundamental physical constants (Table 2); (3) operating condition parameters that were tuned through curve fitting and genetic algorithms (Table 3); and (4) parameters obtained from existing literature (Table 4).Importantly,the parameters of the aging model have been adjusted based on the assumption that our electrolyzer operates for approximately 4.5 years.After this period, surface degradation ratio is expected to reach a value of 0.7, and membrane degradation ratio a value of 0.95.In other words, the surface loses 30% of its initial active surface area, while the membrane thickness decreases by only 5%.
Table 1 Used parameters in the simulation.
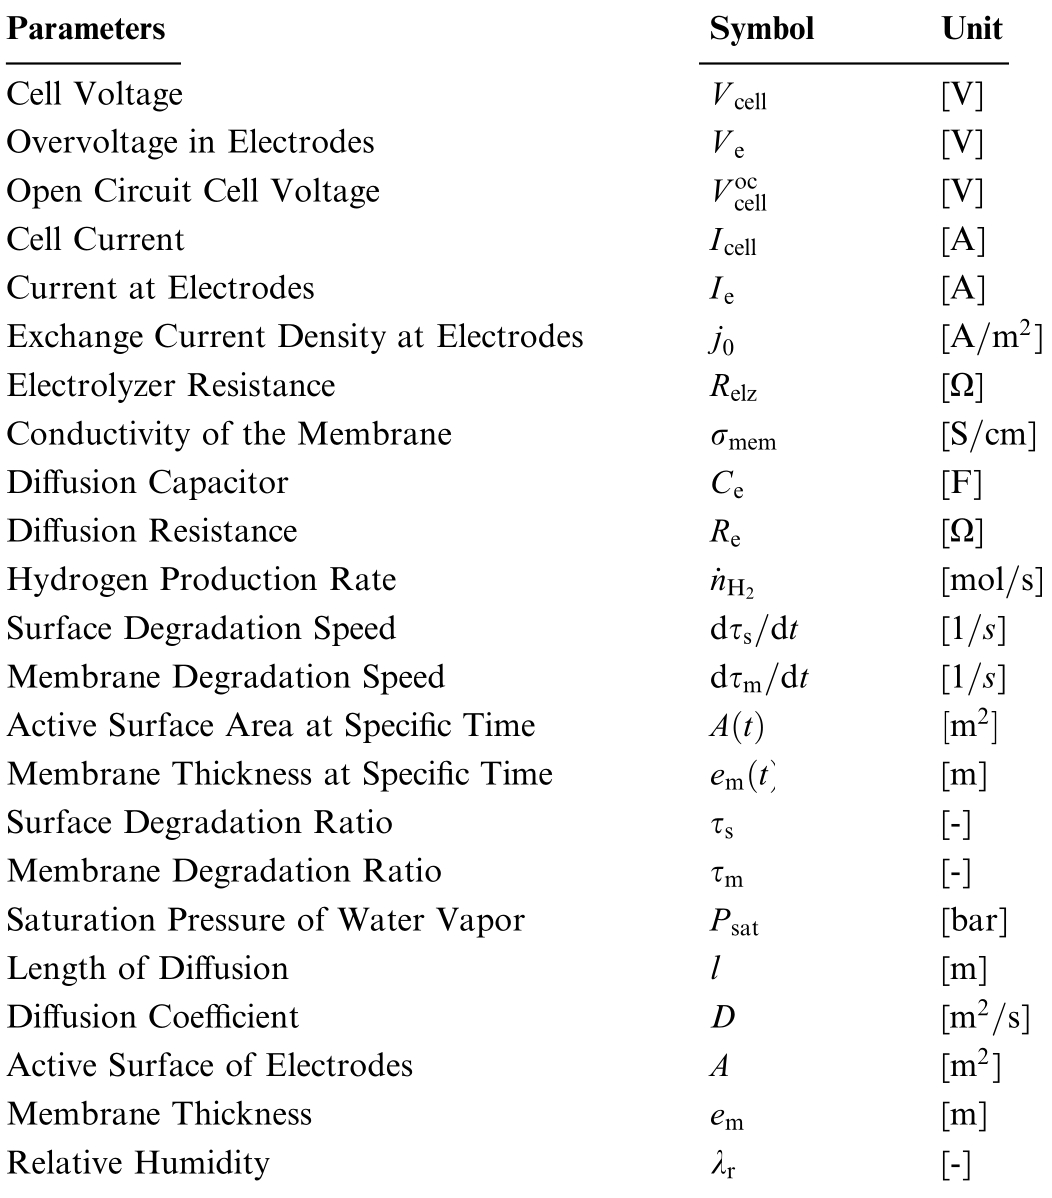
Parameters Symbol Unit Cell Voltage V cell [V]Overvoltage in Electrodes V e [V]Open Circuit Cell Voltage V occell [V]Cell Current Icell [A]Current at Electrodes Ie [A]Exchange Current Density at Electrodes j0 [A m2 ]Electrolyzer Resistance Relz [Ω]Conductivity of the Membrane σmem [S cm]Diffusion Capacitor Ce [F]Diffusion Resistance Re [Ω]Hydrogen Production Rate nH2 [mol s]Surface Degradation Speed dτs dt [1 s]Membrane Degradation Speed dτm dt [1 s]Active Surface Area at Specific Time A t m2 Membrane Thickness at Specific Time em t [m]Surface Degradation Ratio τs [-]Membrane Degradation Ratio τm [-]Saturation Pressure of Water Vapor Psat [bar]Length of Diffusion l [m]Diffusion Coefficient D [m2 s]Active Surface of Electrodes A [m2 ]Membrane Thickness em [m]Relative Humidity λr [-]
Table 2 Physical constants parameters.
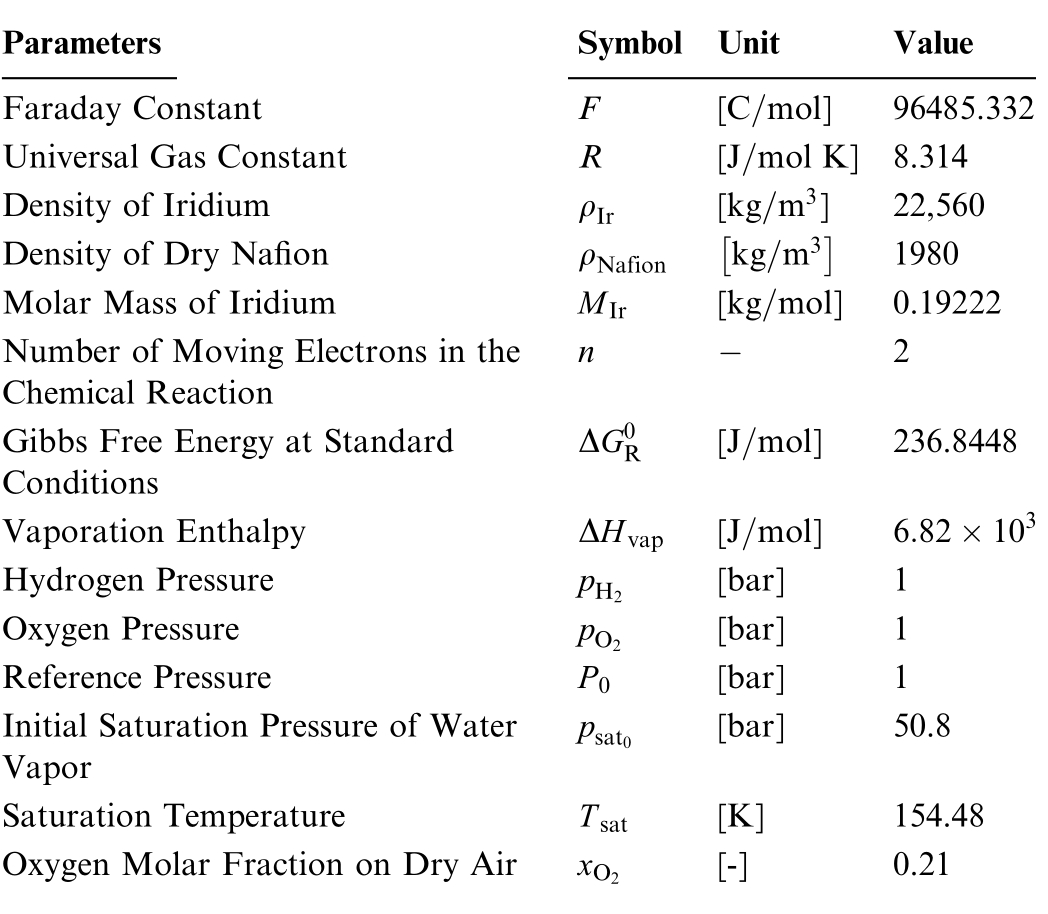
Parameters Symbol Unit Value Faraday Constant F [C mol] 96485.332 Universal Gas Constant R [J mol K] 8.314 Density of Iridium ρIr [kg m3 ] 22,560 Density of Dry Nafion ρNafion kg m3 1980 Molar Mass of Iridium MIr [kg mol] 0.19222 Number of Moving Electrons in the Chemical Reaction 2 Gibbs Free Energy at Standard Conditions n ΔG0 R [J mol] 236.8448 Vaporation Enthalpy ΔHvap [J mol] 6 82 10 3 Hydrogen Pressure pH2 [bar] 1 Oxygen Pressure pO2 [bar] 1 Reference Pressure P0 [bar] 1 Initial Saturation Pressure of Water Vapor psat0 [bar] 50.8 Saturation Temperature Tsat [K] 154.48 Oxygen Molar Fraction on Dry Air xO [-] 0.21 2
Table 3 Operating condition parameters: (Tuned).
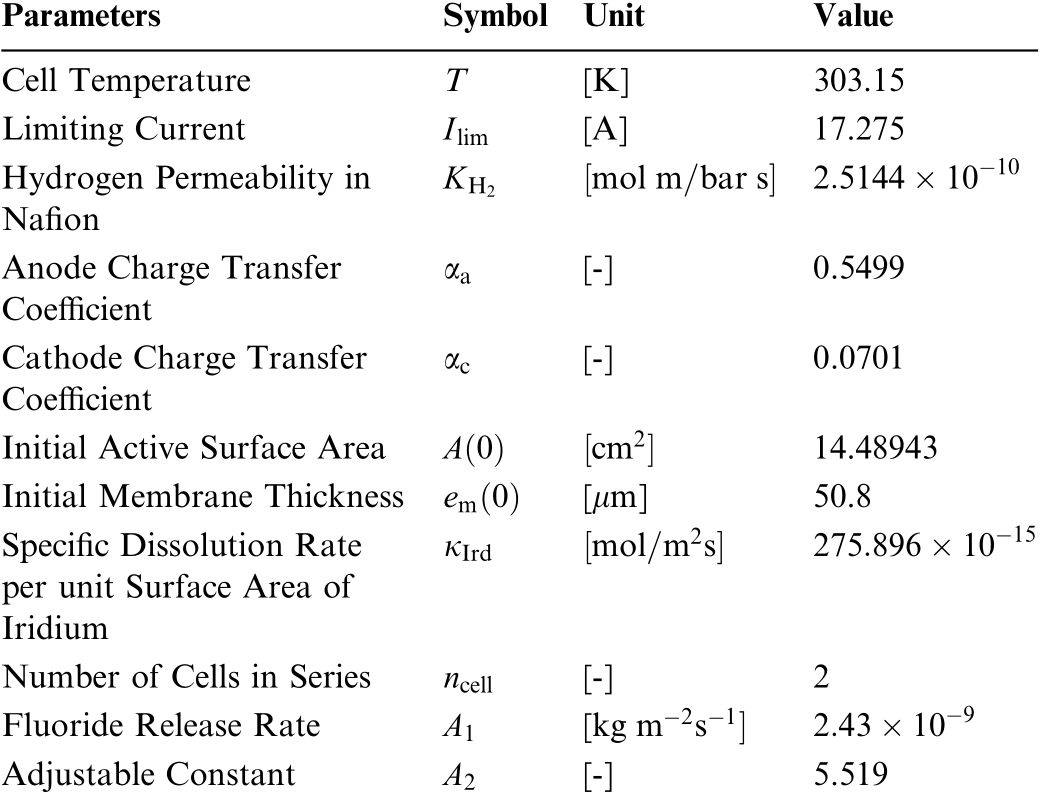
Parameters Symbol Unit Value Cell Temperature T [K] 303.15 Limiting Current Ilim [A] 17.275 Hydrogen Permeability in Nafion KH2 mol m bar s 2 5144 10 10 αa [-] 0.5499 Cathode Charge Transfer Coefficient Anode Charge Transfer Coefficient αc [-] 0.0701 Initial Active Surface Area A 0 cm2 14.48943 Initial Membrane Thickness em 0 [μm] 50.8 Specific Dissolution Rate per unit Surface Area of Iridium κIrd mol m2 s 275 896 10 15 Number of Cells in Series ncell [-] 2 Fluoride Release Rate A1 [kg m 2 s 1 2 43 10 9 Adjustable Constant A2 [-] 5.519
Table 4 Parameters taken from Literature
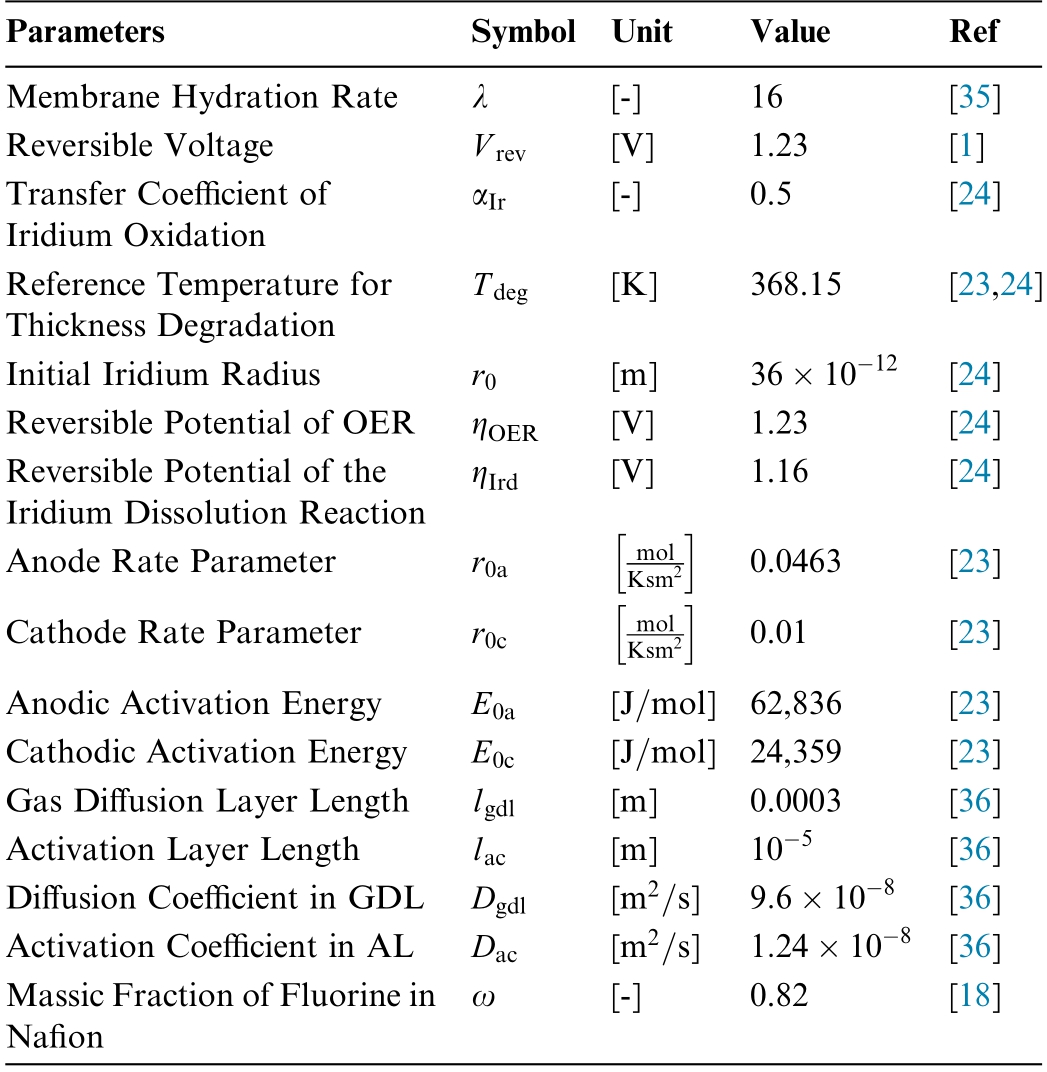
?
References
-
[1]
S.Sood, Multiphysics modelling for online diagnosis and efficiency tracking: application to green H2 production.PhD thesis,Universite´ de Lille, 2021.Available https://theses.hal.science/tel-03675228.(Accessed 17 June 2023). [百度学术]
-
[2]
M.Carmo, D.L.Fritz, J.Mergel, D.Stolten, A comprehensive review on PEM water electrolysis,Int.J.Hydrogen Energy 38(12)(2013) 4901-4934, https://doi.org/10.1016/j.ijhydene.2013.01.151. [百度学术]
-
[3]
F.J.Wirkert, J.Roth, S.Jagalski, P.Neuhaus, U.Rost, M.Brodmann, A modular design approach for PEM electrolyser systems with homogeneous operation conditions and highly efficient heat management, Int.J.Hydrogen Energy 45 (2) (2020)1226-1235, https://doi.org/10.1016/j.ijhydene.2019.03.185. [百度学术]
-
[4]
Z.Su, J.Liu, P.Li, C.Liang, Study of the durability of membrane electrode assemblies in various accelerated stress tests for protonexchange membrane water electrolysis, Materials 17 (6) (2024)1331, https://doi.org/10.3390/ma17061331. [百度学术]
-
[5]
E.Kuhnert, M.Heidinger, D.Sandu, V.Hacker, M.Bodner,Analysis of PEM water electrolyzer failure due to induced hydrogen crossover in catalyst-coated PFSA membranes,Membranes 13 (3) (2023) 348, https://doi.org/10.3390/membranes13030348. [百度学术]
-
[6]
B.Kimmel et al., Investigation of the degradation phenomena of a proton exchange membrane electrolyzer stack by successive replacement of aged components in single cells, ACS Sustain.Chem.Eng.13 (11) (2025) 4330-4340, https://doi.org/10.1021/acssuschemeng.4c07358. [百度学术]
-
[7]
J.Nie, Y.Chen, S.Cohen, B.D.Carter, R.F.Boehm, Numerical and experimental study of three-dimensional fluid flow in the bipolar plate of a PEM electrolysis cell, Int.J.Therm.Sci.48 (10)(2009) 1914-1922, https://doi.org/10.1016/j.ijthermalsci.2009.02.017. [百度学术]
-
[8]
W.Hug, H.Bussmann, A.Brinner, Intermittent operation and operation modeling of aalkaline electrolyzer, Int.J.Hydrogen Energy 18 (12) (1993) 973-977, https://doi.org/10.1016/0360-3199(93)90078-O. [百度学术]
-
[9]
S.A.Grigor’ev, M.M.Khaliullin, N.V.Kuleshov, V.N.Fateev,Electrolysis of water in a system with a solid polymer electrolyte at elevated pressure, Russ.J.Electrochem.37 (8) (2001) 819-822,https://doi.org/10.1023/A:1016735003101. [百度学术]
-
[10]
C.Rozain, De´veloppement de nouveaux mate´riaux d’e´lectrodes pour la production d’hydroge`ne par e´lectrolyse de l’eau, PhD thesis, Universite´ Paris Sud - Paris XI, 2013.Available: https://theses.hal.science/tel-00923169.(Accessed 13 March 2023). [百度学术]
-
[11]
M.E.Lebbal, S.Lecœuche, Identification and monitoring of a PEM electrolyser based on dynamical modelling, Int.J.Hydrogen Energy 34 (14) (2009) 5992-5999, https://doi.org/10.1016/j.ijhydene.2009.02.003. [百度学术]
-
[12]
O.Rallie`res, Mode´lisation et caracte´risation de Piles A Combustible et Electrolyseurs PEM, These de doctorat,Toulouse, INPT, 2011.Available: https://www.theses.fr/2011INPT0128.(Accessed 13 March 2023). [百度学术]
-
[13]
C.A.Martinson, G.van Schoor, K.R.Uren, D.Bessarabov,Characterisation of a PEM electrolyser using the current interrupt method, Int.J.Hydrogen Energy 39 (36) (2014) 20865-20878,https://doi.org/10.1016/j.ijhydene.2014.09.153. [百度学术]
-
[14]
F.da Costa Lopes, E.H.Watanabe, Experimental and theoretical development of a PEM electrolyzer model applied to energy storage systems, in: 2009 Brazilian Power Electronics Conference,Bonito-Mato Grosso do Sul, Brazil, IEEE, 2009, pp.775-782,https://doi.org/10.1109/COBEP.2009.5347619. [百度学术]
-
[15]
H.Liu, J.Chen, D.Hissel, M.Hou, Z.Shao, A multi-scale hybrid degradati on index for proton exchange membrane fuel cells, J.Power Sources 437 (2019), https://doi.org/10.1016/j.jpowsour.2019.226916 226916. [百度学术]
-
[16]
M.Chandesris, R.Vincent, L.Guetaz, J.-S.Roch, D.Thoby, M.Quinaud, Membrane degradation in PEM fuel cells: from experimental results to semi-empirical degradation laws, Int.J.Hydrogen Energy 42 (12) (2017) 8139-8149, https://doi.org/10.1016/j.ijhydene.2017.02.116. [百度学术]
-
[17]
C.Robin, M.Ge´rard, M.Quinaud, J.d’Arbigny, Y.Bultel, Proton exchange membrane fuel cell model for aging predictions:simulated equivalent active surface area loss and comparisons with durability tests,J.Power Sources 326(2016)417-427,https://doi.org/10.1016/j.jpowsour.2016.07.018. [百度学术]
-
[18]
A.Jacome, D.Hissel, V.Heiries, M.Gerard, S.Rosini, PEMFC state-of-health estimation using a model-based state Bayesian observer under an automotive load profile, in: 2020 IEEE Vehicle Power and Propulsion Conference (VPPC), Gijon, Spain, IEEE,2020, pp.1-4, https://doi.org/10.1109/VPPC49601.2020.9330963. [百度学术]
-
[19]
X.Zhang, P.Pisu, Prognostic-oriented fuel cell catalyst aging modeling and its application to health-monitori ng and prognostics of a PEM fuel cell, IJPHM 5 (1) (2020) Nov, https://doi.org/10.36001/ijphm.2014.v5i1.2203. [百度学术]
-
[20]
M.Robert, Impact of Degradation and Aging on Properties of PFSA Membranes for Fuel Cells,Doctoral dissertation,Universite´de Lorraine. [百度学术]
-
[21]
M.Jouin, R.Gouriveau, D.Hissel, M.C.Pera, N.Zerhouni,PEMFC aging modeling for prognostics and health assessment,IFAC-PapersOnLine (2015). [百度学术]
-
[22]
K.Chen, S.Laghrouche, A.Djerdir, Aging prognosis model of proton exchange membrane fuel cell in different operating conditions, Int.J.Hydrogen Energy 45 (20) (2020) 11761-11772,https://doi.org/10.1016/j.ijhydene.2020.02.085. [百度学术]
-
[23]
M.Chandesris, V.Me´deau, N.Guillet, S.Chelghoum, D.Thoby,F.Fouda-Onana, Membrane degradation in PEM water electrolyzer: numerical modeling and experimental evidence of the influence of temperature and current density, Int.J.Hydrogen Energy 40 (3) (2015) 1353-1366, https://doi.org/10.1016/j.ijhydene.2014.11.111. [百度学术]
-
[24]
A.A.Kalinnikov, S.A.Grigoriev, D.G.Bessarabov, Numerical analysis of the electrochemical dissolution of iridium catalyst and evaluation of its effect on the performance of polymer electrolyte membrane water electrolyzers, Int.J.Hydrogen Energy 48 (59)(2023) 22342-22365, https://doi.org/10.1016/j.ijhydene.2023.03.136. [百度学术]
-
[25]
M.Maier et al., Operando flow regime diagnosis using acoustic emission in a polymer electrolyte membrane water electrolyser, J.Power Sources 424 (2019) 138-149, https://doi.org/10.1016/j.jpowsour.2019.03.061. [百度学术]
-
[26]
I.U.Dedigama, Diagnostics and Modeling of Polymer Electrolyte Membrane Water Electrolysers, Doctoral dissertation, UCL(University College London). [百度学术]
-
[27]
S.A.Grigoriev, V.I.Porembskiy, S.V.Korobtsev, V.N.Fateev, F.Aupreˆtre, P.Millet, High-pressure PEM water electrolysis and corresponding safety issues, Int.J.Hydrogen Energy 36 (3) (2011)2721-2728, https://doi.org/10.1016/j.ijhydene.2010.03.058. [百度学术]
-
[28]
S.Siracusano, S.Trocino, N.Briguglio, V.Baglio, A.Arico`,Electrochemical impedance spectroscopy as a diagnostic tool in polymer electrolyte membrane electrolysis, Materials 11 (8) (2018)1368, https://doi.org/10.3390/ma11081368. [百度学术]
-
[29]
Z.Kang, S.M.Alia, M.Carmo, G.Bender, In-situ and inoperando analysis of voltage losses using sense wires for proton exchange membrane water electrolyzers, J.Power Sources 481(2021), https://doi.org/10.1016/j.jpowsour.2020.229012 229012. [百度学术]
-
[30]
U.Babic, M.Tarik, T.J.Schmidt, L.Gubler, Understanding the effects of material properties and operating conditions on component aging in polymer electrolyte water electrolyzers, J.Power Sources 451 (2020), https://doi.org/10.1016/j.jpowsour.2020.227778 227778. [百度学术]
-
[31]
C.-Y.Lee, C.-H.Chen, S.-C.Li, Y.-S.Wang, Development and application of flexible integrated microsensor as real-time monitoring tool in proton exchange membrane water electrolyzer,Renew.Energy 143 (2019) 906-914, https://doi.org/10.1016/j.renene.2019.05.071. [百度学术]
-
[32]
C.-Y.Lee, C.-H.Chen, G.-B.Jung, S.-C.Li, Y.-Z.Zeng, Internal microscopic diagnosis of accelerated aging of proton exchange membrane water electrolysis cell stack, Micromachines 11 (12)(2020) 1078, https://doi.org/10.3390/mi11121078. [百度学术]
-
[33]
M.Maier et al., Acoustic time-of-flight imaging of polymer electrolyte membrane water electrolysers to probe internal structure and flow characteristics, Int.J.Hydrogen Energy 46 (21) (2021) 11523-11535, https://doi.org/10.1016/j.ijhydene.2021.01.077. [百度学术]
-
[34]
P.Marocco et al., Online measurements of fluoride ions in proton exchange membrane water electrolysis through ion chromatography, J.Power Sources 483 (2021), https://doi.org/10.1016/j.jpowsour.2020.229179 229179. [百度学术]
-
[35]
D.G.Bessarabov, H.H.Wang, H.Li, N.Zhao (Eds.), PEM Electrolysis for Hydrogen Production:Principles and Applications,CRC Press, Boca Raton; London, 2016. [百度学术]
-
[36]
G.Fontes, Mode´lisation et caracte´risation de la pile PEM pour l’e´tude des interactio ns avec les convertisseurs statiques, Doctoral dissertation, Institut National Polytechnique. [百度学术]
-
[37]
Q.Feng et al., A review of proton exchange membrane water electrolysis on degradation mechanisms and mitigation strategies,J.Power Sources 366 (2017) 33-55, https://doi.org/10.1016/j.jpowsour.2017.09.006. [百度学术]
-
[38]
H.-S.Oh et al., Electrochemical catalyst-support effects and their stabilizing role for IrOx nanoparticle catalysts during the oxygen evolution reaction, J.Am.Chem.Soc.138 (38) (2016) 12552-12563, https://doi.org/10.1021/jacs.6b07199. [百度学术]
-
[39]
S.M.Alia et al., Activity and durability of iridium nanoparticles in the oxygen evolution reaction,J.Electrochem.Soc.163(11)(2016)F3105-F3112, https://doi.org/10.1149/2.0151611jes. [百度学术]
-
[40]
P.Lettenmeier et al., Durable membrane electrode assemblies for proton exchange membrane electrolyzer systems operating at high current densities, Electrochim.Acta 210 (2016) 502-511, https://doi.org/10.1016/j.electacta.2016.04.164. [百度学术]
-
[41]
S.A.Grigoriev, K.A.Dzhus, D.G.Bessarabov, P.Millet, Failure of PEM water electrolysis cells: case study involving anode dissolution and membrane thinning, Int.J.Hydrogen Energy 39 (35) (2014)20440-20446, https://doi.org/10.1016/j.ijhydene.2014.05.043. [百度学术]
Fund Information

