Recommended articles:
-

-
Global Energy Interconnection
Volume 8, Issue 4, Aug 2025, Pages 554-571
Performance assessment of meta-heuristic MPPT strategies for solar panels under complex partial shading conditions and load variation
Abstract
Abstract
0 Introduction
Solar energy is a major renewable energy resource for electricity generation, and photovoltaic (PV) modules are crucial for capturing and converting the solar energy.Meteorological parameters, particularly the temperature and solar irradiance, significantly affect the performance and efficiency of the PV modules.When compared with conventional energy sources, renewables, such as solar energy,contribute significantly to the fight against climate change owing to their advantages, such as reduced greenhouse gas emissions and air pollution.The widespread and abundant nature of solar energy makes it a preferable power generation solution,facilitated by various technologies such as PV systems and solar thermal applications,which accommodate a wide spectrum of energy requirements[1-3].The performance of solar panel systems is significantly affected by environmental conditions,particularly partial shadowing situations (PSCs), which can cause significantly reduce their power production.
Consequently, the voltage-power characteristics of these systems exhibit various curves, and become increasingly complicated.The GMPP is typically assumed to be represented only by the greatest peaks on these curves[4].PV systems employ the maximum power point tracking (MPPT) technique to mitigate the effects of PSCs and optimize their performance, which is crucial for enhancing the overall efficiency of the system [5].MPPT is an essential method used in PV systems to continuously modify the operational parameters of solar panels to maximize their efficiency and produce the highest possible power output.Therefore,extensive research has been conducted in this field, leading to the development of various MPPT techniques [6].
Conventional techniques, such as perturb and observe(P&O) [7], incremental conductance (INC) [8], and hillclimbing (HC) [9], are typically used to efficiently monitor and optimize the maximum power output.However, the current-voltage (I-V) characteristics of PV systems are assumed to be unimodal; this presents limitations in precisely calculating the GMPPT under PSCs.Furthermore,the performance of these conventional methods may be adversely affected by the inherent variations that occur during MPPT, which can cause power loss and decrease the overall efficiency.
Extensive research has been conducted on developing alternative optimization strategies based on soft computing to overcome the limitations of the conventional MPPT methods.Advanced algorithms that use artificial intelligence (AI) methods have been developed to improve the MPPT performance in PV solar cells(PSCs).Artificial neural networks(ANN)[10]and fuzzy logic control(FLC)are two of the most commonly used methods in this field[11].These approaches can enhance the performance and accuracy under certain conditions.However, training these AI models requires a large amount of data,specialized knowledge of solar systems,and considerable memory resources.
After determining the GMPP, metaheuristic methods are employed to stabilize the solar power systems by focusing on the most advantageous locations for monitoring them.Adopting this strategic approach enhances the effi-ciency of the MPPT algorithms,thereby reducing the computing resource demands and increasing the stability and responsiveness [12].Therefore, these methods ensure the best possible operating performance and efficiently reduce oscillations.The most widely used metaheuristic methods include salp swarm optimization (SSO) [13], (ARMO)[14], squirrel search algorithm (SSA) [15], modified coot optimization algorithm (MCOA) [16], and improved rat swarm optimizer (IRSO) [17].
Metaheuristic algorithms typically require comprehensive adjustment of several parameters, which can be an intricate and time-consuming process.The number of parameters to be modified is determined based on the size of the solar array.Three parameters must be adjusted for particle swarm optimization (PSO): C1, C2, and W, as shown in [18].Conversely, five parameters were used in the firework algorithm [19]: A, a, b, m, and £.Three parameters are required for the cuckoo search (CS) [20];Pa, β, and α.Random number generators also present an element of unpredictability that facilitates the exhaustive exploration of the search space.Excessive dependence on randomness presents various difficulties, such as the tendency of algorithms like the grey wolf optimizer(GWO) [21] to converge on the LMPP, rather than the intended GMPP.Therefore, it is crucial to achieve a suitable balance between random and deterministic parameter updates to enhance the efficiency of these algorithms for the precise identification of the GMPP.
Several MPPT systems have been developed in recent years,including the bat algorithm(BA)[22],modified butterfly optimization algorithm(MBOA)[23],improved coot optimizer algorithm (ICOA) [24], and artificial bee colony(ABC) [25].Innovative MPPT tracking methods have emerged to identify the GMPP, such as the social ski driver algorithm (SSD) [26], search and rescue (SRA) [27],manta ray foraging optimization (MRFO) [28], and team game algorithm (TGA) [29].
Additionally, several methods have been developed to differentiate between changes in the irradiance and variations in the load, thereby enabling algorithms to prevent re-initialization during load fluctuations.An adaptive tracking method that effectively returns to the maximum power point (MPP) without requiring re-initialization by using an adaptive step-size perturbation (ΔD) was developed in references [23,24].Decreasing the step size increases, the tracking time, which may cause oscillations.In particular, an impedance conversion equation was developed for the DC-DC converter By using the improved differential evolution (IDE) approach [30].This enables the converter to trace back to the GMPP [9],thereby eliminating the requirement for particle reinitialization during the load changes.However, this approach requires adjustment of the equations when the converter design is changed.
We have selected and evaluated several approaches with various behaviors in this study.The simplicity of implementation,low number of tuning parameters,and random number are the most crucial considerations in the selection of a method.The MPPT techniques based on metaheuristic algorithms exhibit enhanced efficiency, accuracy, and faster responses in tracking the GMPP under PSCs when compared with conventional methods.This improvement can be attributed to the stochastic search processes inherent in metaheuristic optimization, thereby presenting a straightforward and interpretable framework [31].Although swarm-based algorithms can also achieve rapid tracking,they vary significantly in other aspects,primarily due to the distinct mechanisms employed by each swarm population.These methods typically employ a single update strategy within the search space (PSO, GWO, CS,SSD, TGA, and IDE).For example, algorithms such as PSO, GWO, TGA, DE, and SSD incorporate random numbers between 0 and 1 in their update formulas,whereas CS employs a probabilistic switching parameter and random relocation via Le´vy flights, which enhances the exploratory capability of the algorithm.Such mechanisms significantly enhance the exploration potential of the metaheuristic algorithms,making them highly effective for locating the GMPP under complex,shaded conditions.
The MPPT algorithms discussed thus far have not been evaluated under standardized testing conditions, such as consistent shading patterns.This lack of uniformity makes it difficult to establish a reliable ranking based on the specific benchmarking indicators.However,it is still essential to evaluate their performance using the common and objective criteria, such as complexity, steady-state oscillation levels, tracking capability under partial shading conditions (PSC), cost, applications, and PV module dependency.Table 1 presents a comparative overview of these performance metrics across the various configurations and system setups.
The primary contributions of this study can be summarized as follows:
1.We implemented an experimental framework and performed statistical analysis for a PV system equipped with an MPPT mechanism to achieve a comparative analysis of its performance using seven established benchmark MPPT algorithms.
2.We analyzed the effect of load variations on the performance of the three MPPT algorithms (TGA, SSD, and IDE), highlighting their adaptability to dynamic environmental conditions and varying load demands.
The rest of this manuscript is organized as follows.Section 2 presents a detailed discussion on the modeling of partially shaded PV systems.Section 3 presents an analysis of the controllers that employ metaheuristic approaches.Section 4 presents the experimental results.Lastly, Section 5 concludes the paper, and presents a summary and the key concluding remarks.
1 Modeling photovoltaic systems under PSCs
1.1 Photovoltaic-based model
PV modules convert solar energy into electrical energy using the PV effect in semiconductor materials.A PV module comprises an extensive PN junction.When sunlight reaches the surface of the PV module, it energizes the free charge carriers within the semiconductor, prompting their movement.This movement creates varying potential differences across the different areas of the module,thereby generating an electric current.We applied the principles of electronic circuit theory to derive an equivalent circuit model and formulate the output characteristic equationsfor the PV modules.Fig.1 depicts the corresponding circuit representation.
Table 1 A comprehensive comparison between Swarm Intelligence Algorithms MPPT Techniques.
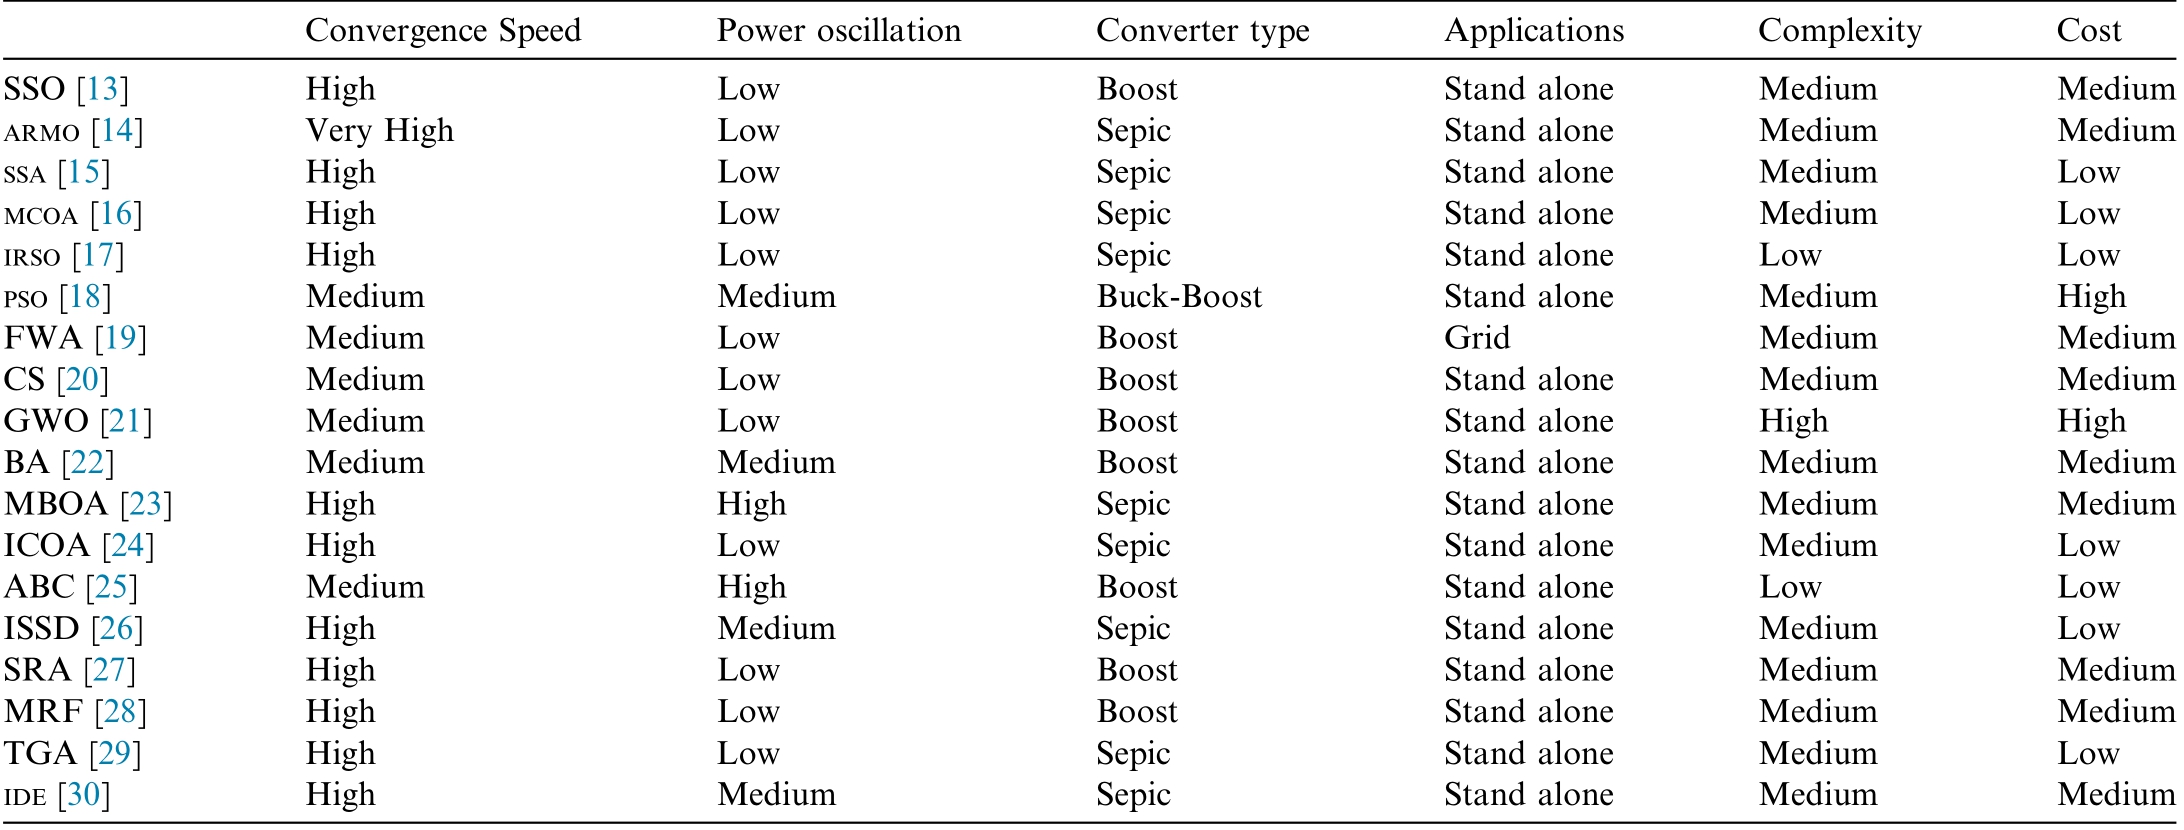
Convergence Speed Power oscillation Converter type Applications Complexity Cost SSO [13] High Low Boost Stand alone Medium Medium ARMO [14] Very High Low Sepic Stand alone Medium Medium SSA [15] High Low Sepic Stand alone Medium Low MCOA [16] High Low Sepic Stand alone Medium Low IRSO [17] High Low Sepic Stand alone Low Low PSO [18] Medium Medium Buck-Boost Stand alone Medium High FWA [19] Medium Low Boost Grid Medium Medium CS [20] Medium Low Boost Stand alone Medium Medium GWO [21] Medium Low Boost Stand alone High High BA [22] Medium Medium Boost Stand alone Medium Medium MBOA [23]ICOA [24]Medium Low ABC [25] Medium High Boost Stand alone Low Low ISSD [26] High Medium Sepic Stand alone Medium Low SRA [27] High Low Boost Stand alone Medium Medium MRF [28] High Low Boost Stand alone Medium Medium TGA [29] High Low Sepic Stand alone Medium Low IDE [30] High Medium Sepic Stand alone Medium Medium High High High Low Sepic Sepic Stand alone Stand alone Medium Medium
The PV module produced a consistent photocurrent under constant external sunlight.Under such conditions,the PV module can be characterized as a source of steady current.The theoretical depiction of the PV cell is based on a single-diode model that describes this structure.The current produced by the PV cell is given as follows:

Here Iph denotes the current source, an d Ipv and V pv denote the current and voltage outputs of the photovoltaic system, respectively.
The photocurrent, Iphof a solar cell is influenced by several material characteristics.Rs and Rsh denote the ohmic values of the series and parallel resistors, respectively.A relatively accurate estimate of, Iphcan be obtained by considering it as a linear function, as shown below:
Here, Isc ref represents the reference short-circuit current of the solar cell.Gref denotes the reference irradiance, which is set to 1000![]() and Tre f denotes the temperature in degrees Celsius.Gdenotes the actual irradiance intensity,expressed in W/m2, and μscdenotes the short-circuit current coefficient.
and Tre f denotes the temperature in degrees Celsius.Gdenotes the actual irradiance intensity,expressed in W/m2, and μscdenotes the short-circuit current coefficient.
The diode saturation currents are approximated as follows:

Where Iodenotes the reverse saturation current of the cell,q is the elementary charge, n de notes the ideality factor,k denotes the Boltzmann’s constant,and T denotes the absolute temperature in Kelvin.
The current value of Io ref when it is fully saturated can be obtained as follows:

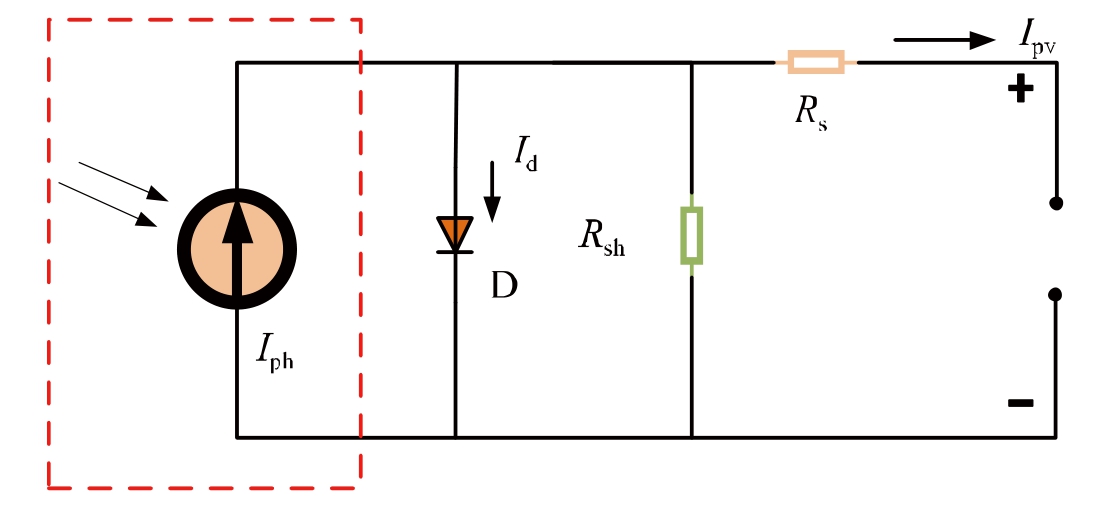
Fig.1.Model of a PV cell.
where the V oc ref denotes the open circuit voltage for the reference and V tdenotes the thermal voltage of the cell.
1.2 Impact of PSCs on MPPT
In typical PV systems, multiple solar cells are linked in series or parallel to form modules and arrays.However,partial shading can adversely affect these systems since PV modules may suffer from a decrease in the voltage and current output when they are shaded.The decrease in the power production can cause the shaded modules to act more like loads rather than producing power,which would reduce the overall power output of the string.This is the standard procedure for installing bypass diodes in parallel with each PV module to offset this decline in performance.Even when one or more modules are shaded,this arrangement ensures that energy will continue to flow through the string.[32].Furthermore, blocking diodes are included to prevent the reversal of the current flow caused by the voltage differentials between the strings linked in parallel.
The impact of the bypass diodes must be evaluated when using MPPT methods to determine the overall effi-ciency of a PV system.In addition to detecting the MPPT in the presence of partial shading, these algorithms must be able to adapt to the changing local maxima caused by different shading patterns.Figs.2 and 3 depict the setup of the PV system with bypass diodes along with the (PV)and(I-V)curves,which depict the performance characteristics of system under uniform and partial shading,respectively [33-35].
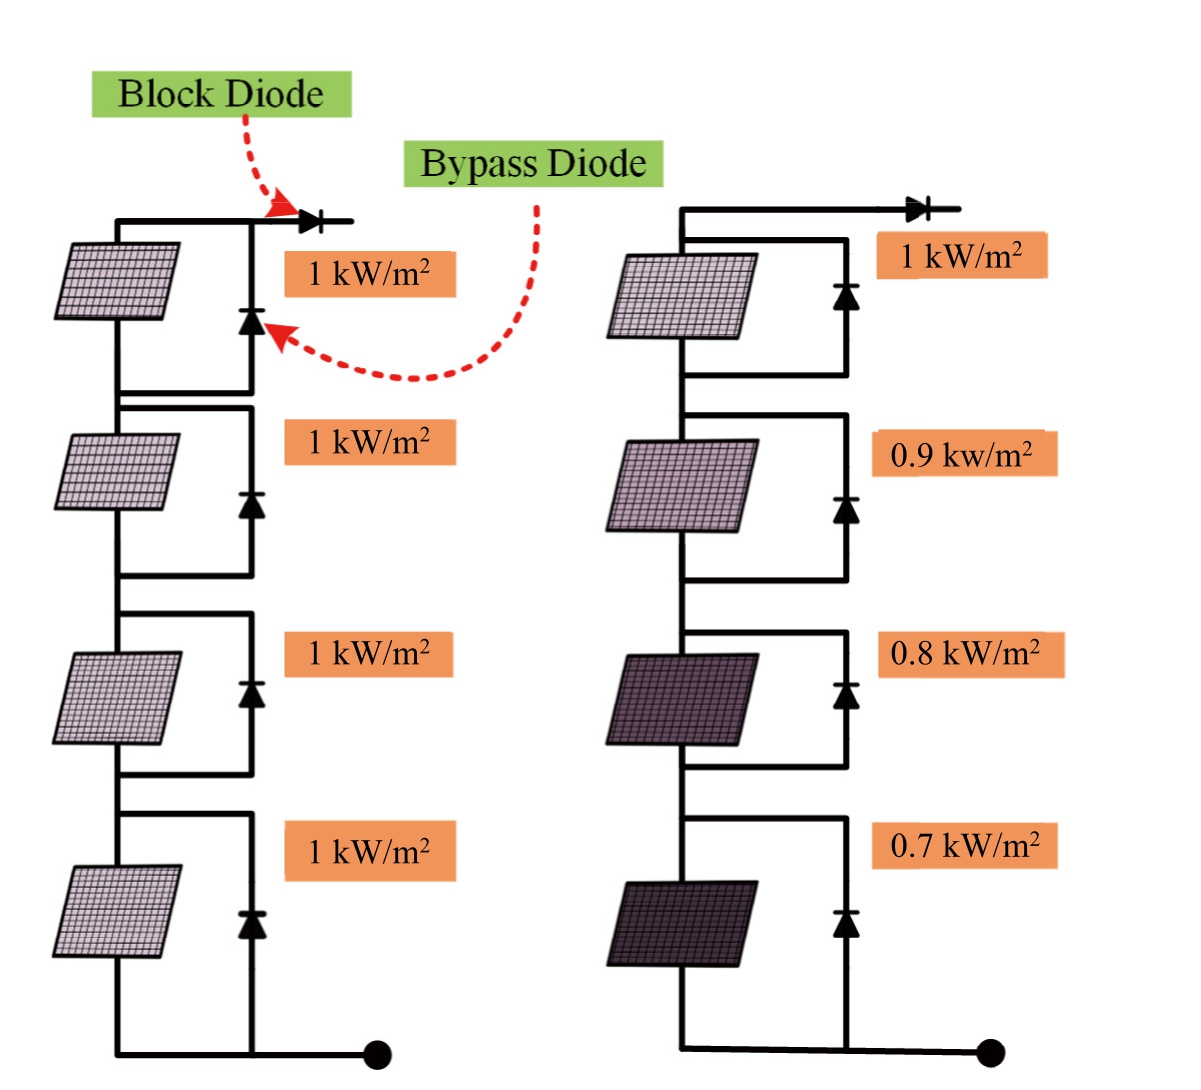
Fig.2.Conditions of Irradiance for USCs (a) and PSCs (b).
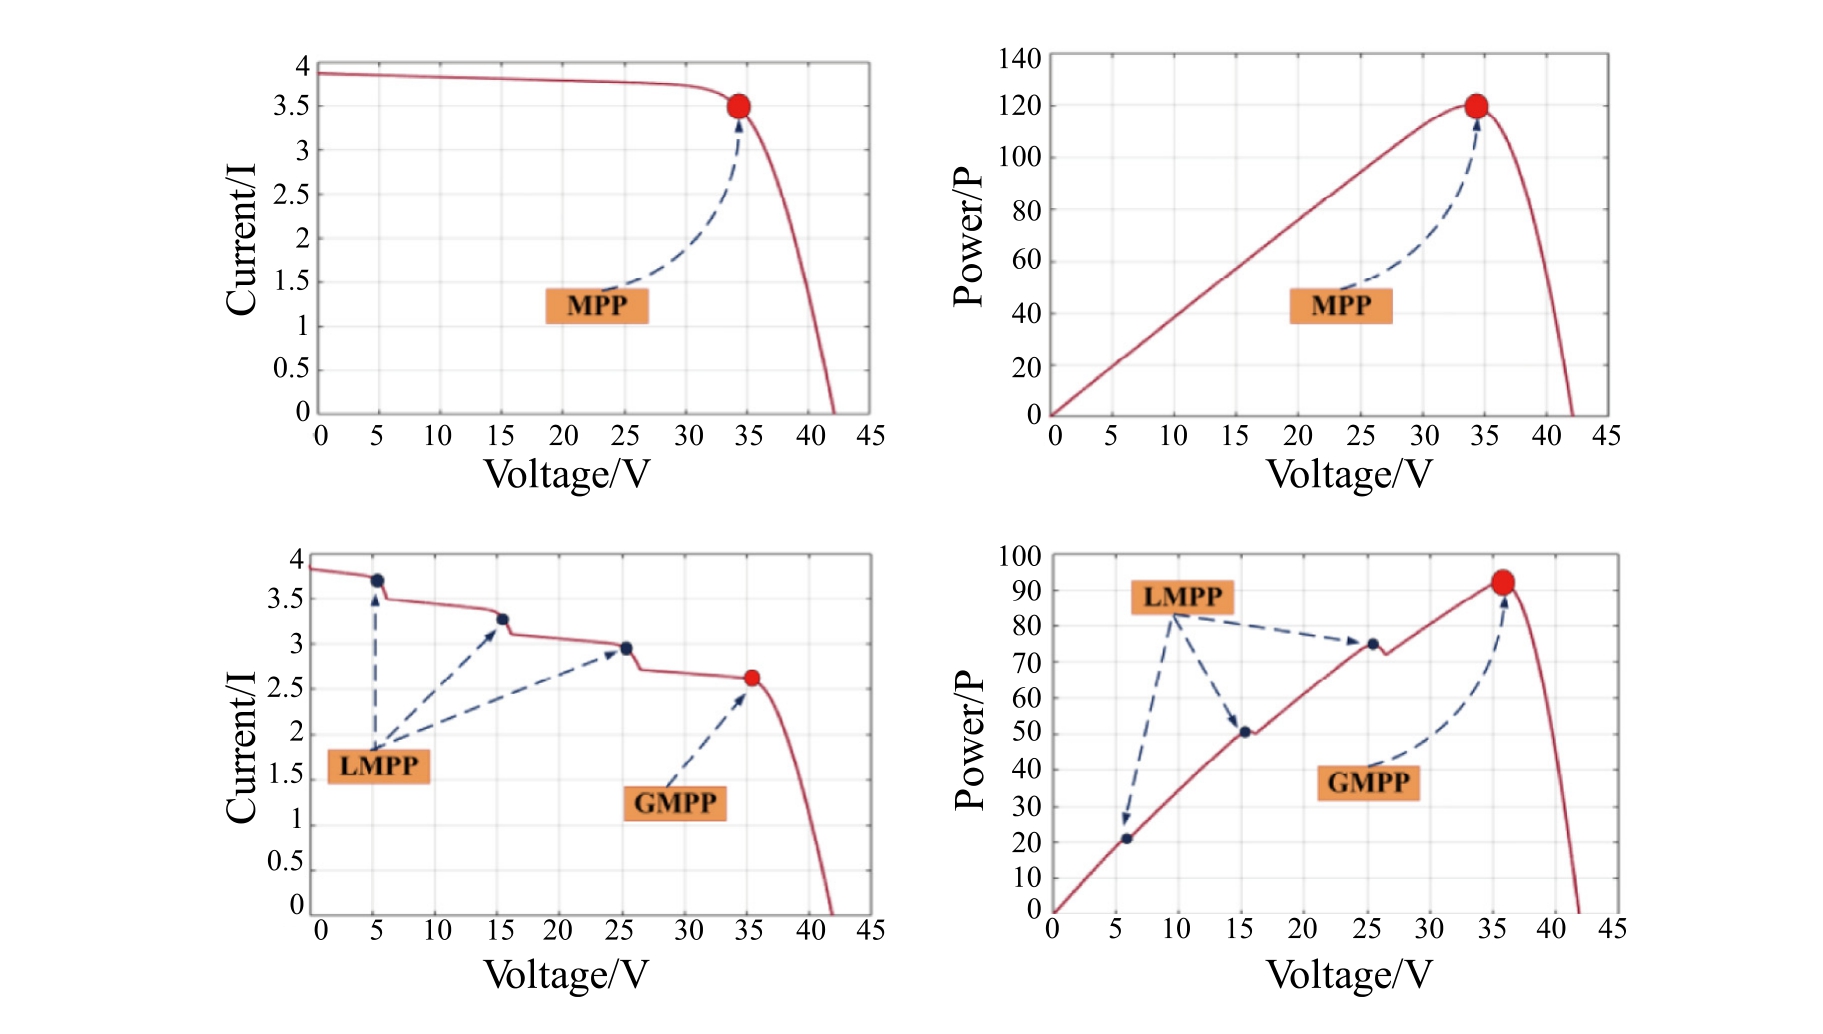
Fig.3.I-V and P-V curves for USCs (a) and PSCs (b).
1.3 Distinguishing between changes in irradiance and load
In PV solar cells, the I-V curve depicts the relationship between the output voltage and current of the cell under specific solar irradiance conditions.Changes in the solar irradiance alter the I-V curve, causing the operating point of the cell to shift along the curve.Fig.4 depicts the I-V curves for the three PV strings, PSC-A, PSC-B, and PSC-C,under the varying solar irradiance levels,as generated using MATLAB Simulink based on the developed model.Initially, for PSC-A, the MPP is located on the load line, with a voltage, Vmpp, of 38.96 V and a current,Impp of 1.36 A.When the shading pattern shifts from PSC-A to PSC-B, higher voltage and current values of28.15 V and 1.16 A, respectively, are obtained when compared with the tracked values under PSC-A.This behavior concurs with that shown in Eq.(5), which demonstrates that variations in the solar irradiance directly affect the voltage (VPV) and current (IPV) levels within the PV system.

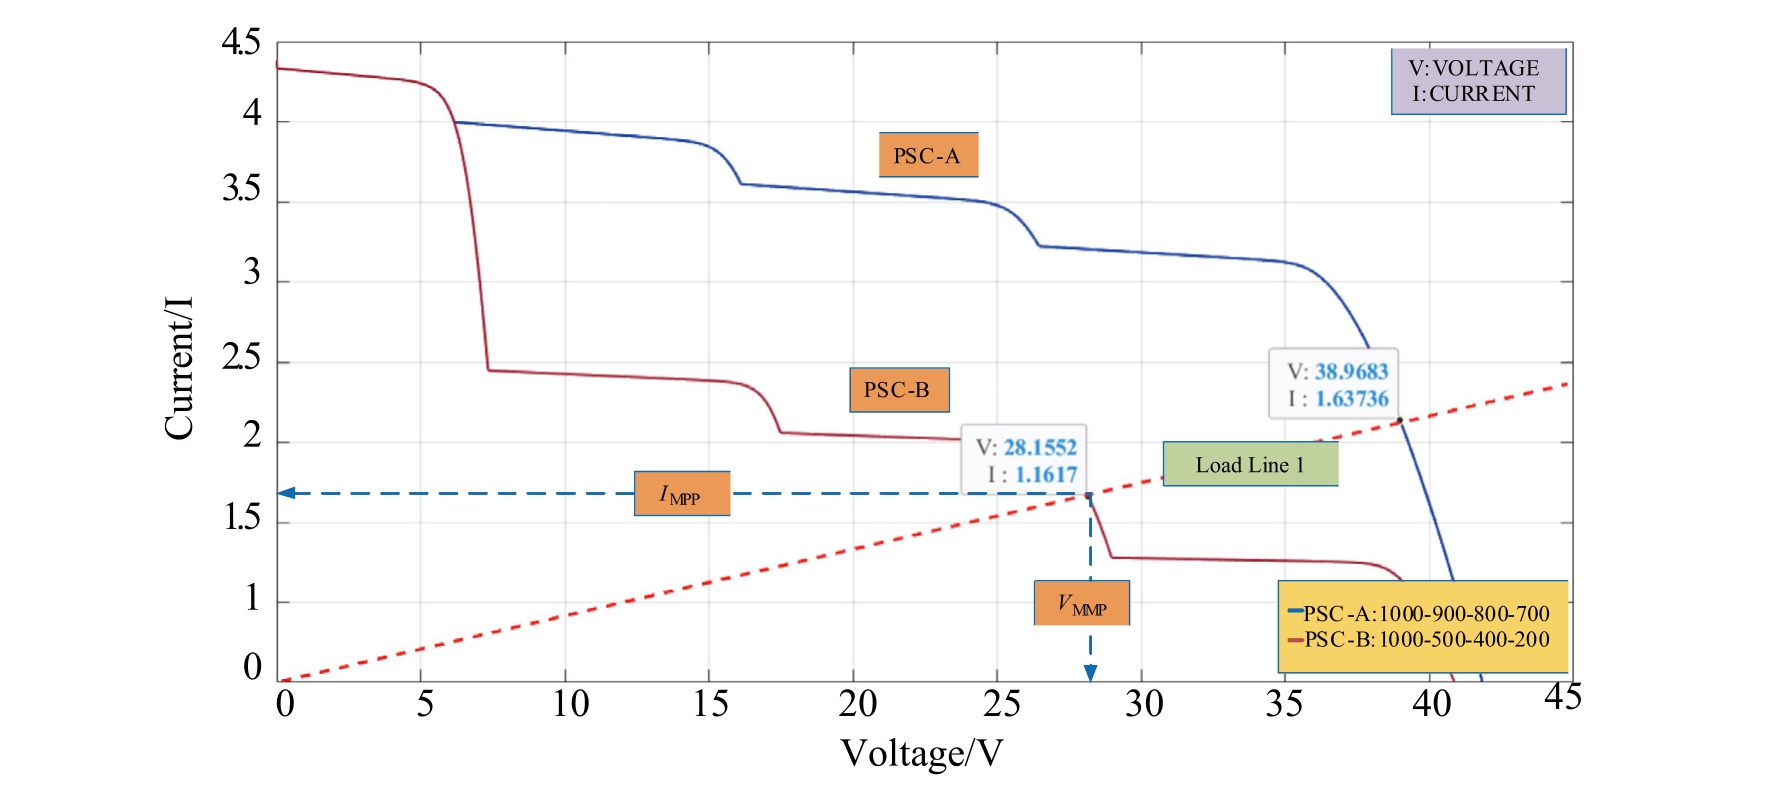
Fig.4.I-V characteristics of PV for dynamic shading variation.
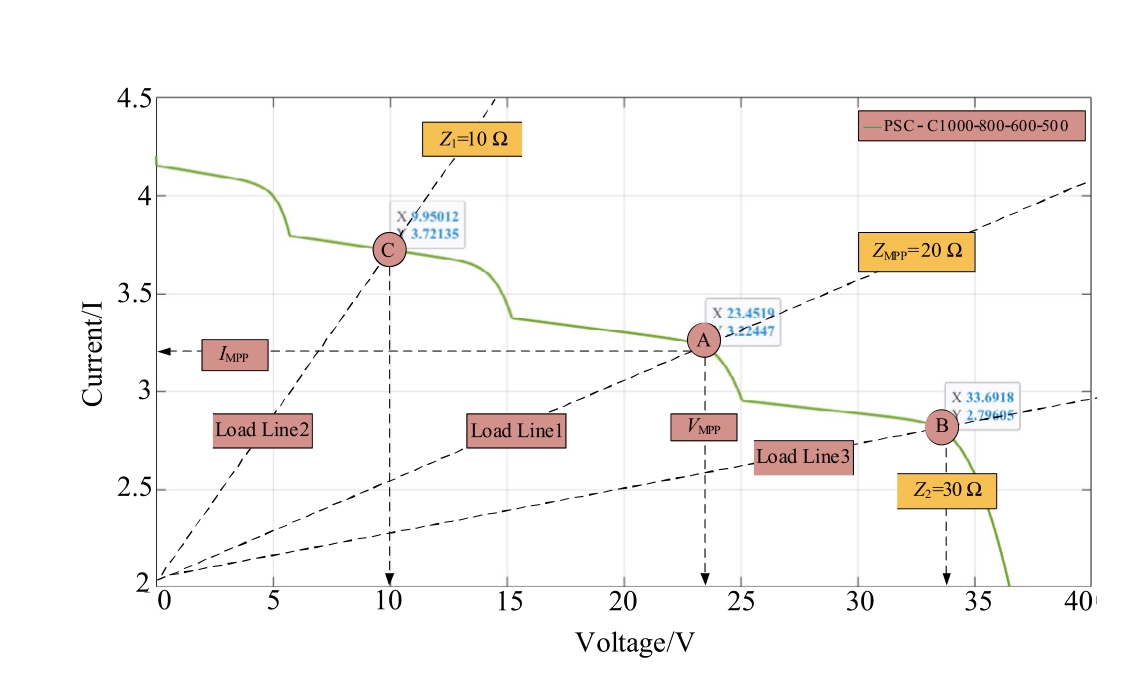
Fig.5.The I-V curve response to different load conditions.
Once the global maximum power was tracked,the algorithm continuously monitored the system based on Eq.(6).The algorithm continues its operation if the specified condition is not satisfied.Conversely, if the condition in Eq.(6) is fulfilled, it indicates that the system has encountered either a change in the irradiance or a variation in the load.
Changes in the load satisfy the requirement in(6)if the condition in(5)is not satisfied.Fig.5 depicts the variation in the I-V curve based on to load fluctuations in the system.It can be observed that the operating point shifts from A to C or from load line 1 to load line 2 as the load decreases after the MPP is achieved at point A.This transition caused a decrease in the voltage and an increase in current.Conversely, the operating point moves from A to B when the load is increased from load line 1 to load line 3, causing a decrease in the current and an increase in the voltage.
2 Controllers utilizing metaheuristic approaches
This section presents an overview of the selected metaheuristic algorithms.The objective of the survey was to gain insights into the functioning of each algorithm and analyze its foundational principles, flowchart representation, and corresponding mathematical models.
2.1 Team game algorithm (TGA)
Mahmoodabadi et al.proposed the TGA in 2018 [36],which is an algorithm used for evolutionary analysis.TGA presents various benefits in terms of the simplicity and ease of application, and is based on team behavior in ball sports.It exhibits considerable potential for effi-ciently solving continuous optimization challenges.The TGA gradually enhanced the quality of the solution by repeatedly performing these steps.In the team-based game TGA,players are divided into two teams.Within the TGA framework, individuals were represented as particles, and their performance was evaluated based on their stamina.Similar to an actual game, the TGA involves three activities that the particles can perform: passing the ball, committing errors, and replacing.These activities promote interactions between particles and exchange of information, imitating the dynamic character of a team game.The TGA method improves the particle performance by systematically employing these principles to optimize the solution.
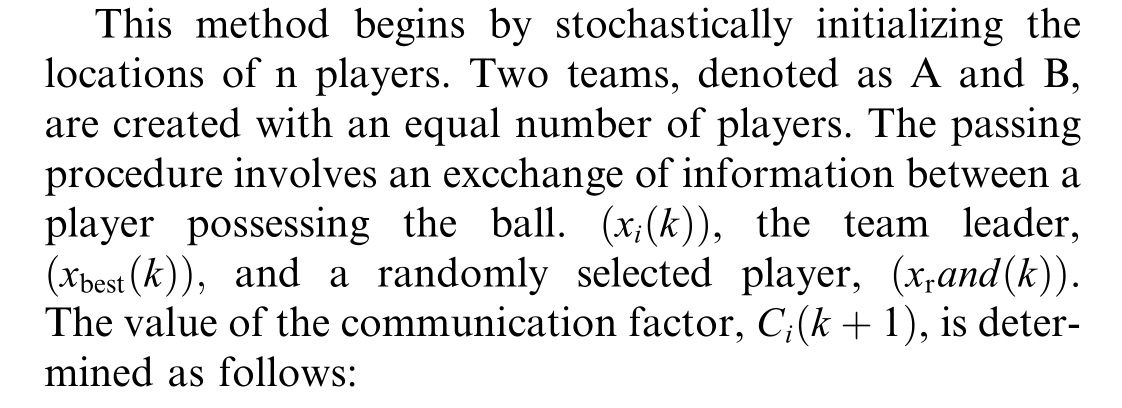
The player’s location,![]() is updated as follows:
is updated as follows:
An erroneous operation occurs when the specified probability criterion is fulfilled,prompting the player to possess the ball and randomly alter the dimensions, as described below:
Here,![]() represents the position of the i-th player in the team that possesses the ball, and
represents the position of the i-th player in the team that possesses the ball, and![]() represents the position of a player from the opposing team.Additionally,zdenotes a random value generated within the interval
represents the position of a player from the opposing team.Additionally,zdenotes a random value generated within the interval![]() The substitution process evaluates the player performance at the end of each iteration by replacing a player whose profile remains constant or does not improve.TGA was used to optimize power extraction from the PV array,as shown in Fig.6.
The substitution process evaluates the player performance at the end of each iteration by replacing a player whose profile remains constant or does not improve.TGA was used to optimize power extraction from the PV array,as shown in Fig.6.
2.2 Social ski-driver optimization algorithm
This method is an innovative optimization approach that is based on the downward motion of skiers,as described in reference [37].It efficiently addresses non-linear functions and can optimize the power by comprehensively analyzing the P-V curve.The algorithm operates in four sequential phases:first,it randomly selects positions for agents within a specified search area; second, it determines the fitness of each agent using an objective function; third, it determines the best agent by comparing its fitness to that of previous iterations; lastly, it computes a global average from the top three agents,guiding all the agents to move towards this average point.This procedure was continued until the termination requirements were satisfied.
The mean global,![]() is calculated based on the average of the top three agents, with each agent converging towards the mean global point.It is given as follows:
is calculated based on the average of the top three agents, with each agent converging towards the mean global point.It is given as follows:
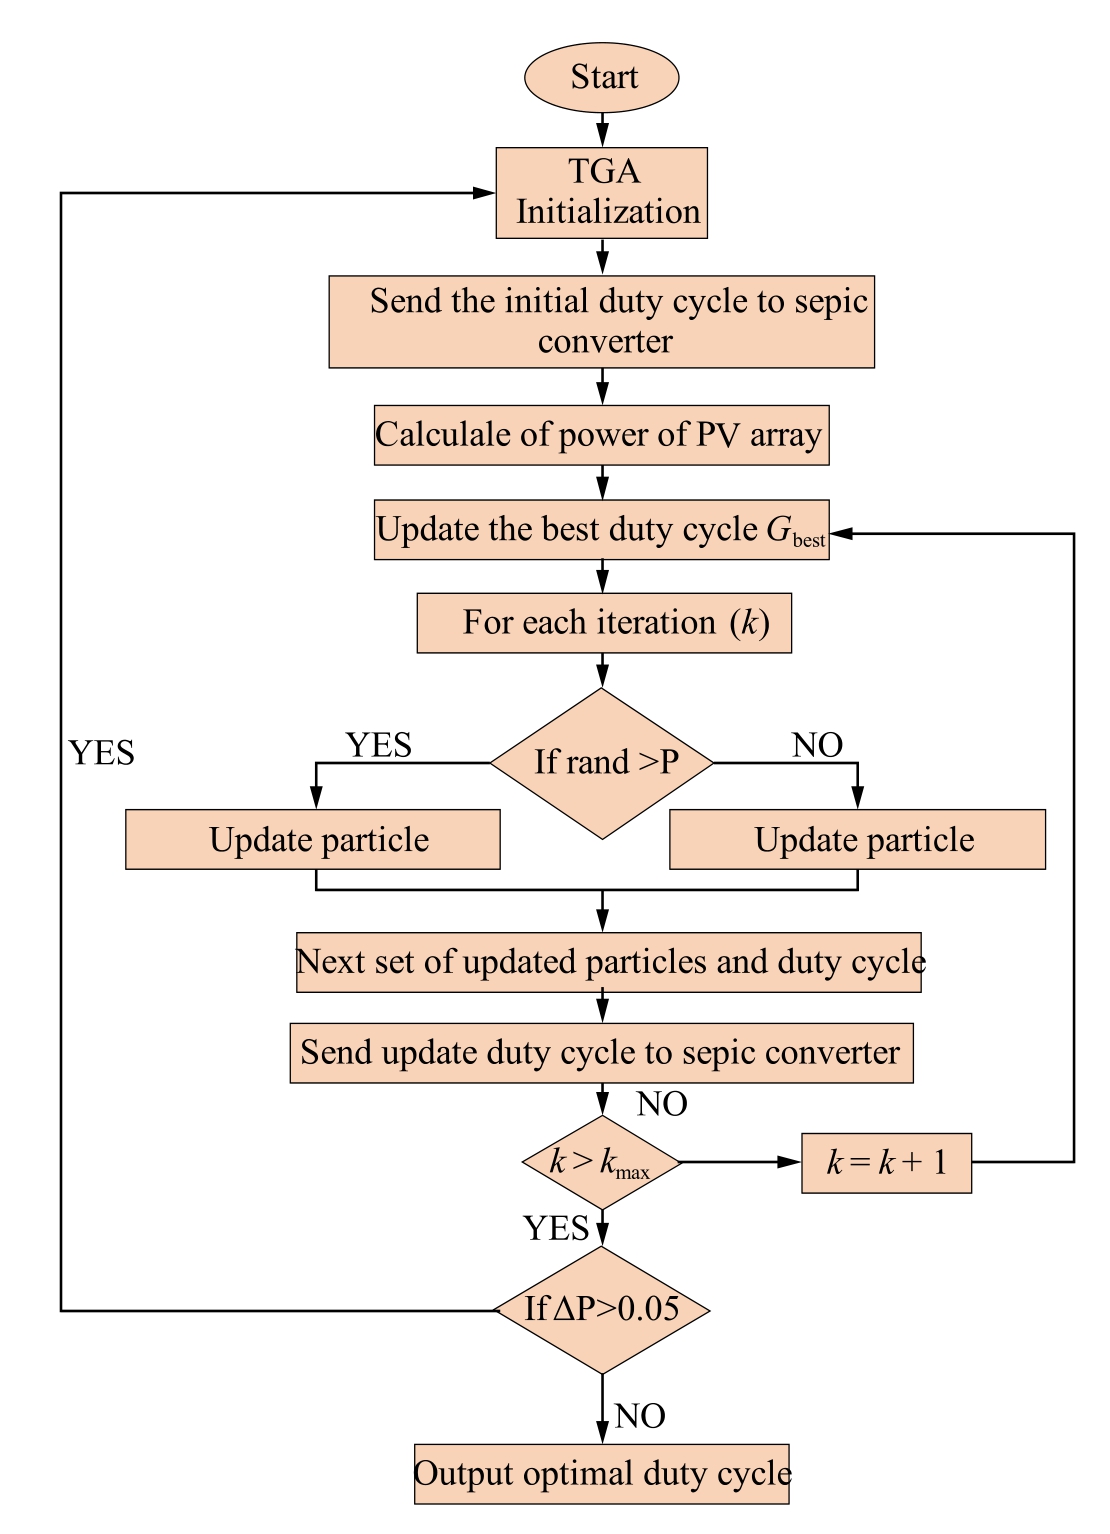
Fig.6.Flowchart of the TGA.

Here,![]() represent the top three places in the search space, which are determined based on the fitness values received from the objective function.
represent the top three places in the search space, which are determined based on the fitness values received from the objective function.
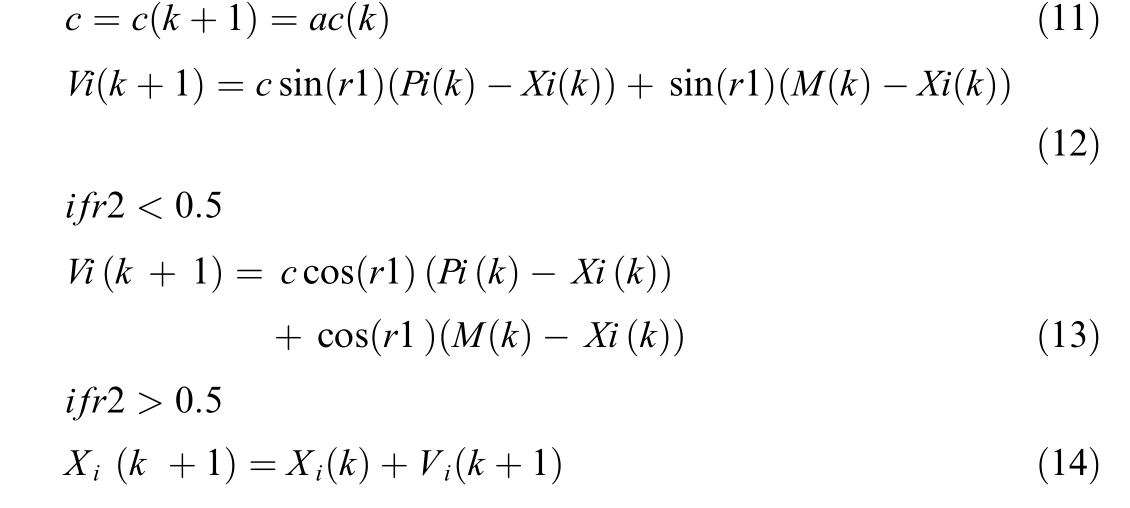

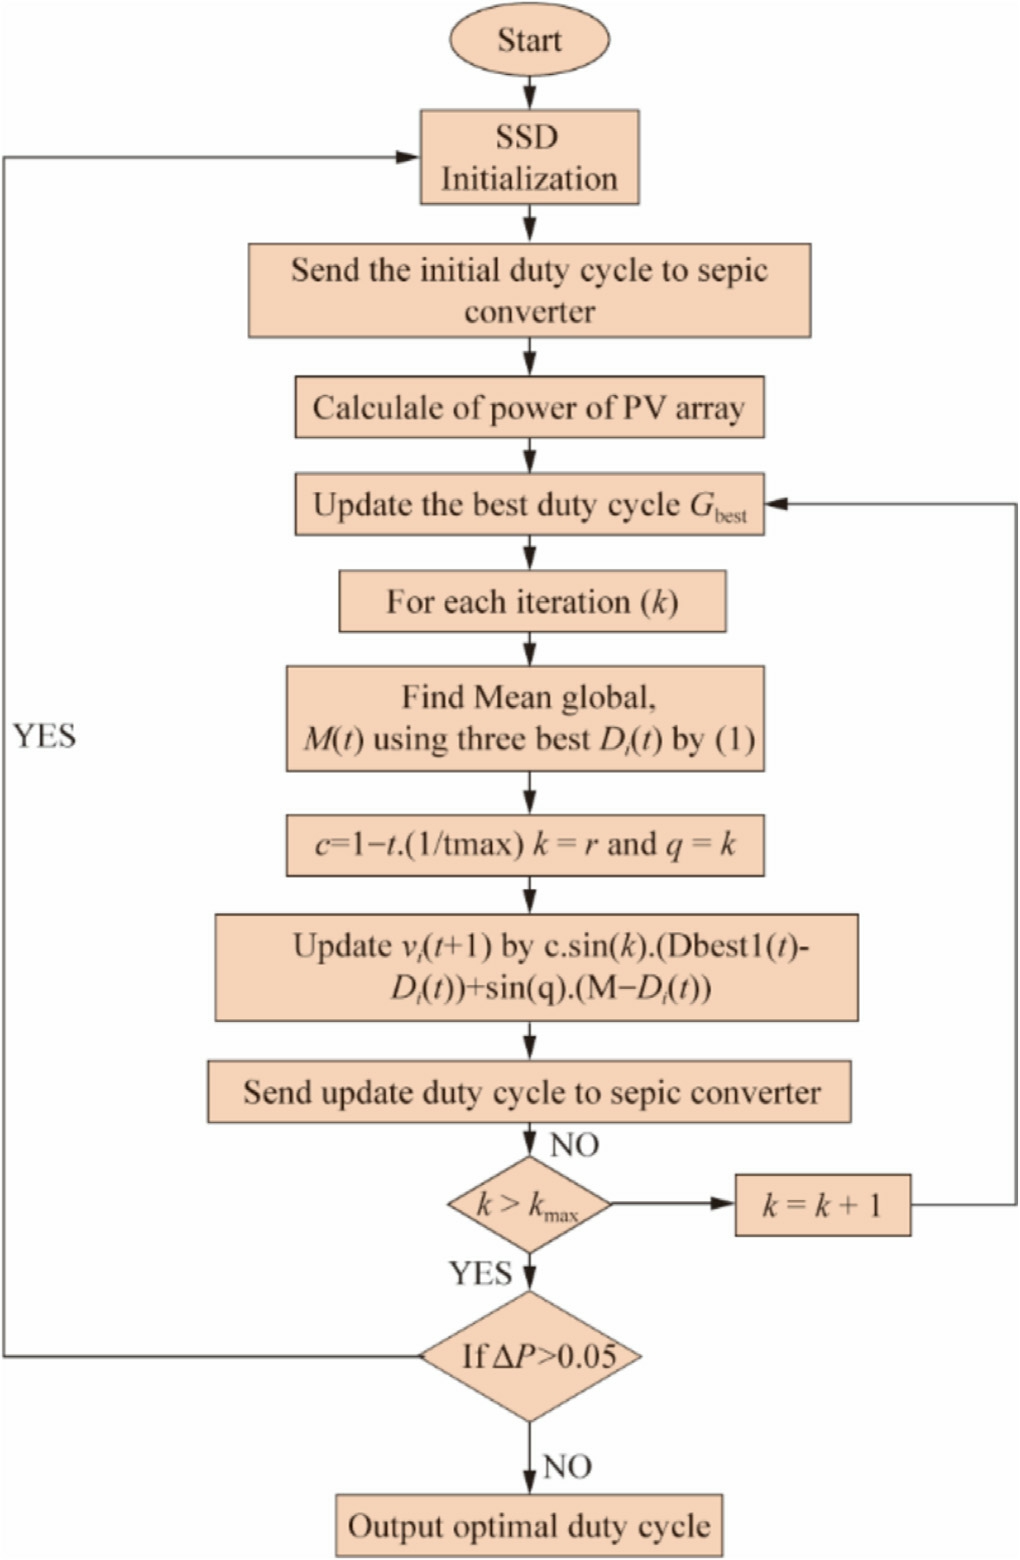
Fig.7.Flowchart of the ISSD algorithm.
![]()
2.3 Differential evolution (DE)
Storn and Price introduced differential evolution (DE)in 1996 as a method to overcome global optimization issues[38].The size of the particle population and the maximum number of iterations are the only two parameters required for this simple but effective approach.DE is a global search framework that efficiently handles multidimensional, noisy, non-continuous, and non-linear optimization problems by combining the aspects of simulated annealing (SA) and Goldberg’s genetic algorithm (GA).This approach involves applying a mutation operation to the target vectors.![]() in each iteration to generate new candidate solutions.This process ensures that all the agents within the population progressively converge towards the agent that exhibits the best performance.The principal control parameters in DE comprise the total number of agents, crossover constant ,
in each iteration to generate new candidate solutions.This process ensures that all the agents within the population progressively converge towards the agent that exhibits the best performance.The principal control parameters in DE comprise the total number of agents, crossover constant ,![]() and scaling factor,
and scaling factor,![]() Fig.8 depicts the mathematical formulation of DE, following the initialization phase.
Fig.8 depicts the mathematical formulation of DE, following the initialization phase.
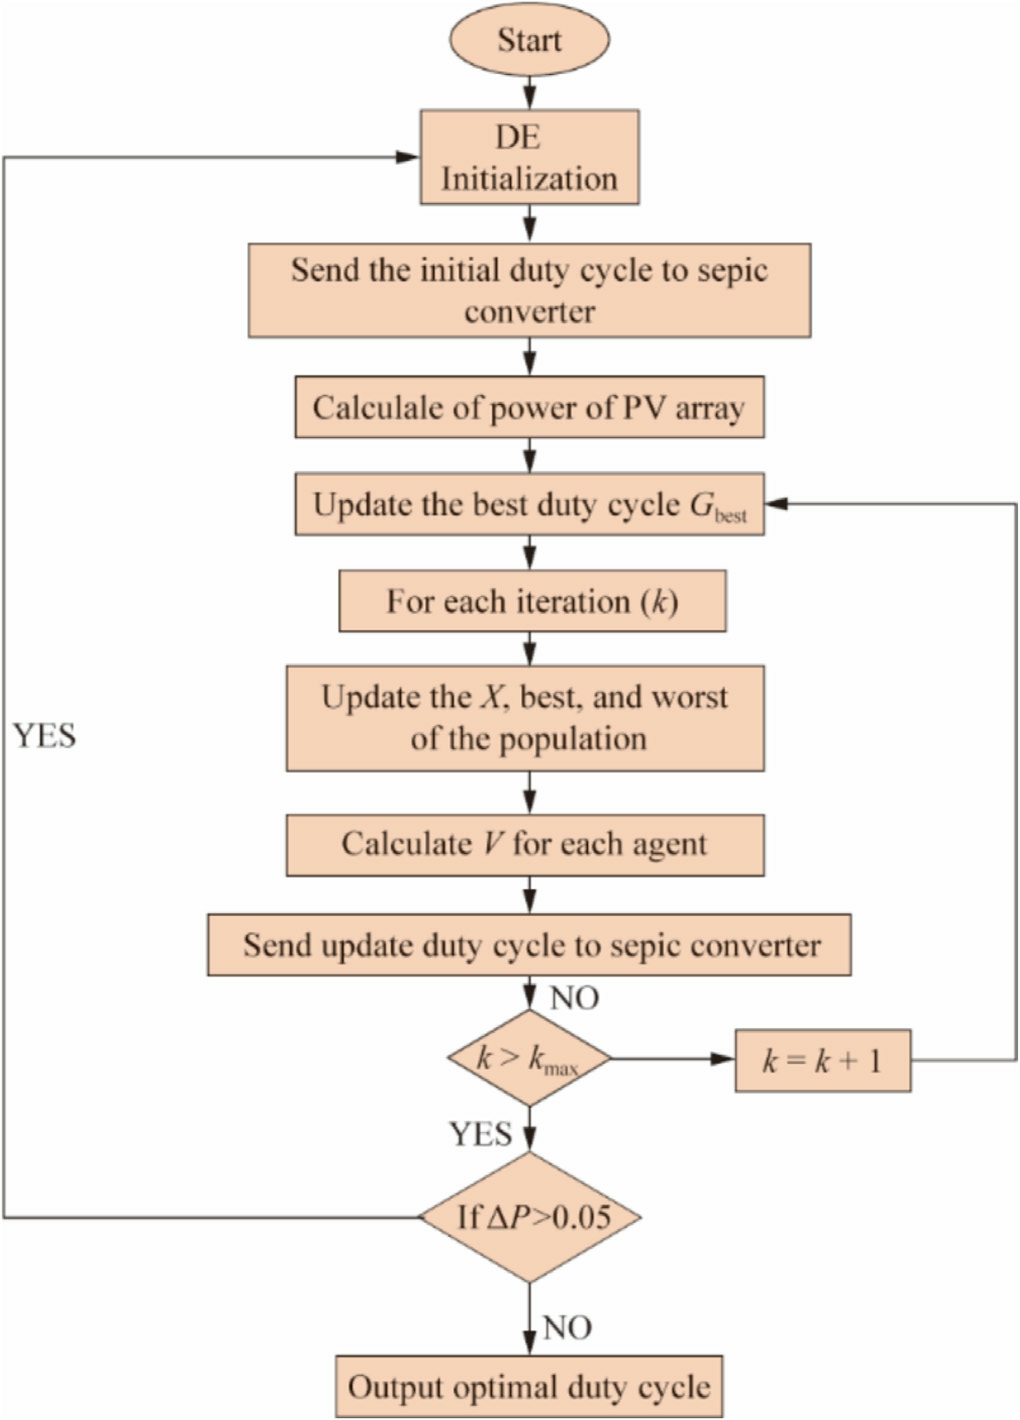
Fig.8.Flowchart of the DE algorithm.
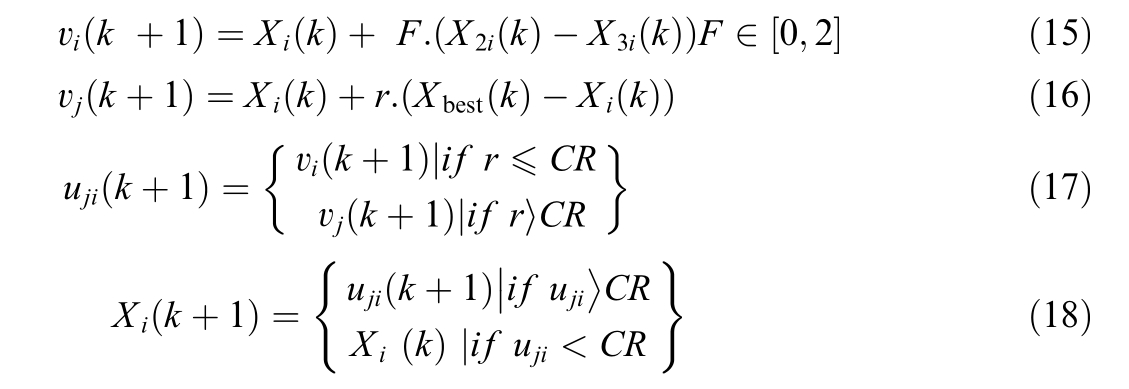
where F li es in the range of 0 to 1, (r)denotes a random number, rand, in the range of [0,1], and is compared to the crossover rate, CR, in the range of [0,1].
2.4 Grey wolf optimization (GWO)
The GWO method is an optimization approach that mimics the hierarchical organization and hunting habits of grey wolves,was introduced by Mirjalili et al.[39].This algorithm describes the social structure of a wolf pack using four types of wolves: alpha (α), beta (β), delta (δ),and omega(ω).The alpha wolf represents the ideal answer whereas the beta and delta wolves represent the secondand third-best alternatives, respectively.The remaining contenders were categorized as omega wolves.Hunting,pursuing, and tracking prey are the three main stages of the GWO.During the hunting phase, grey wolves surround the target, which is represented numerically by certain equations.The distance between the present location of the grey wolf and its prey is given as follows:
The position of the grey wolf can be modified based on its surrounding behavior, and is given as:


The components of the vector,![]() in the above equations decreased linearly from 2 to 0 with the increase in the number of iterations.The range of [0, 1] confines the random vectors,
in the above equations decreased linearly from 2 to 0 with the increase in the number of iterations.The range of [0, 1] confines the random vectors,![]() and
and![]() Fig.9 depicts a flowchart of the MPPT algorithm using the GWO approach.
Fig.9 depicts a flowchart of the MPPT algorithm using the GWO approach.
2.5 Particle swarm optimization (PSO)
Kennedy and Eberhart proposed the PSO algorithm,which uses a population-based metaheuristic technique to solve optimization problems by employing swarm intelligence [40].In PSO, a collection of particles jointly searches the search space to identify the best possible solution.Each particle in the swarm, represented at time, (k),by a position vector,![]() and a velocity vector,
and a velocity vector,![]() is a possible solution.Although the velocity vector controls the speed and direction of particle movement,the position vector indicates a potential solution.The position and speed of each particle in PSO are given as follows:
is a possible solution.Although the velocity vector controls the speed and direction of particle movement,the position vector indicates a potential solution.The position and speed of each particle in PSO are given as follows:

vi![]() and
and![]() represents the particle’s velocity and location after being updated at time,
represents the particle’s velocity and location after being updated at time,![]() respectively.The effect of the starting velocity was regulated by the inertia weight w.The acceleration coefficients, c1 and c2,determine the impact of the particle’s personal best position (pbesti) and the global best position
respectively.The effect of the starting velocity was regulated by the inertia weight w.The acceleration coefficients, c1 and c2,determine the impact of the particle’s personal best position (pbesti) and the global best position![]() respectively.The
respectively.The![]() function generates a random number between 0 and 1.Fig.10 depicts a flowchart illustrating the process of this function.
function generates a random number between 0 and 1.Fig.10 depicts a flowchart illustrating the process of this function.
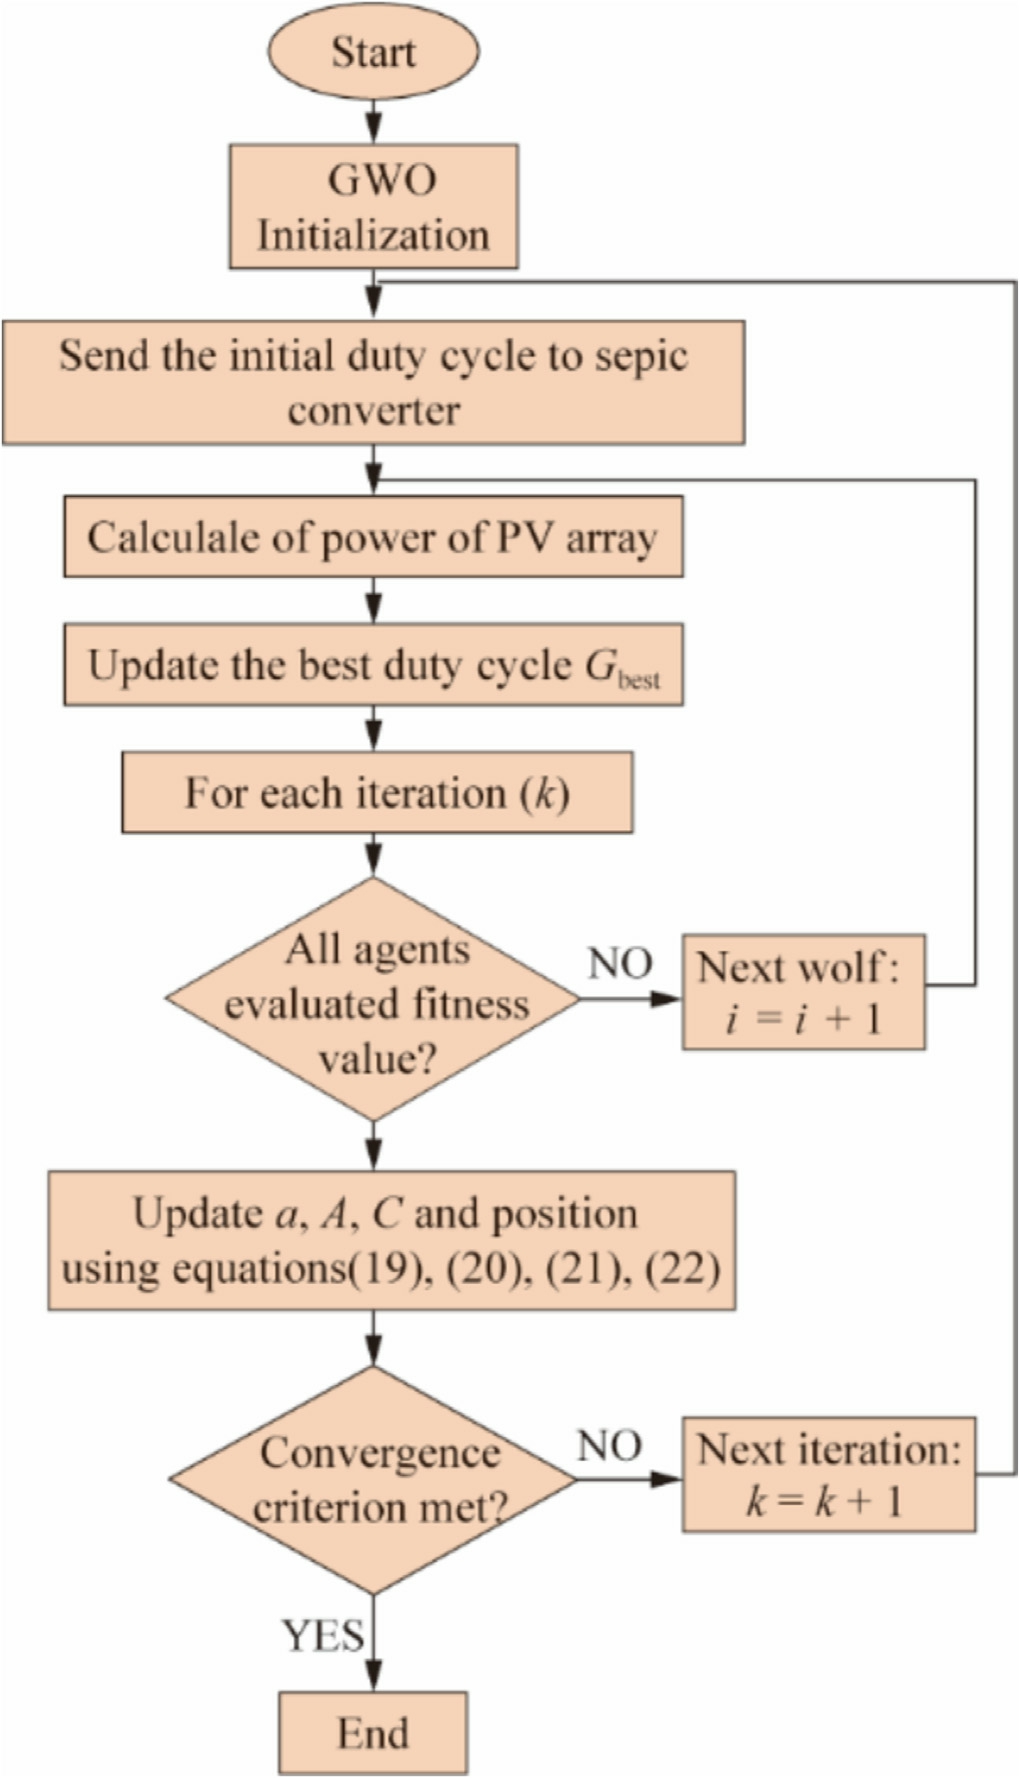
Fig.9.Flowchart of the GWO algorithm.
2.6 Cuckoo search (CS)
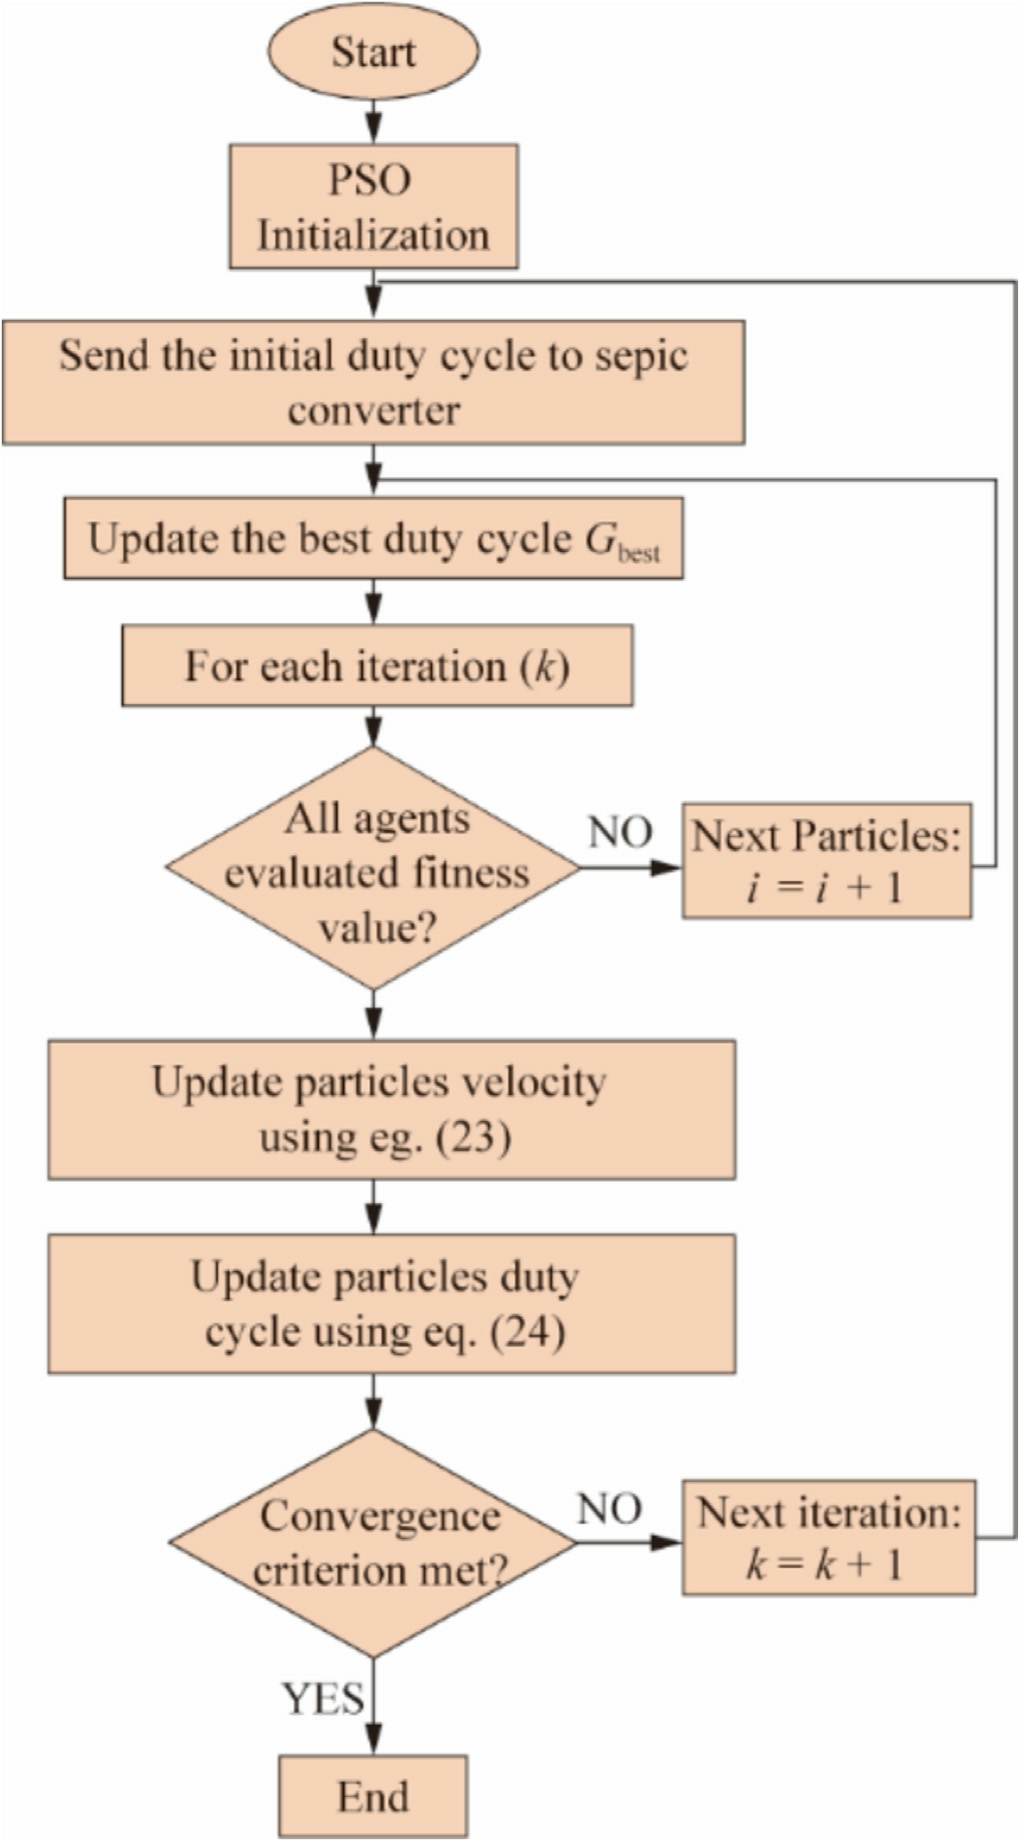
Fig.10.Flowchart of the PSO algorithm.
Cuckoo search (CS) is a bio-inspired, swarm-based optimization technique that is influenced by the reproductive strategies of the cuckoo bird.[41].This method has been applied in various MPPT applications.It employs a distinctive approach to update the positions of particles within the search space, leveraging a mechanism known as Le´vy flight to introduce step changes in the control actions.This algorithm is based on the unique and opportunistic nesting behavior of the cuckoo bird.It emulates the reproductive behavior of cuckoo birds, where they lay eggs in host nests to improve the chances of survival.The algorithm employs a Levy flight to explore the search space and generates random step sizes based on a powerlaw distribution.CS improves the solution diversity and optimization efficiency by mimicking the cuckoo’s strategy of using multiple nests to enhance the survival chances of the offspring.The power-law distribution that determines the randomly-produced step sizes used in the Le´vy flight is expressed as follows:

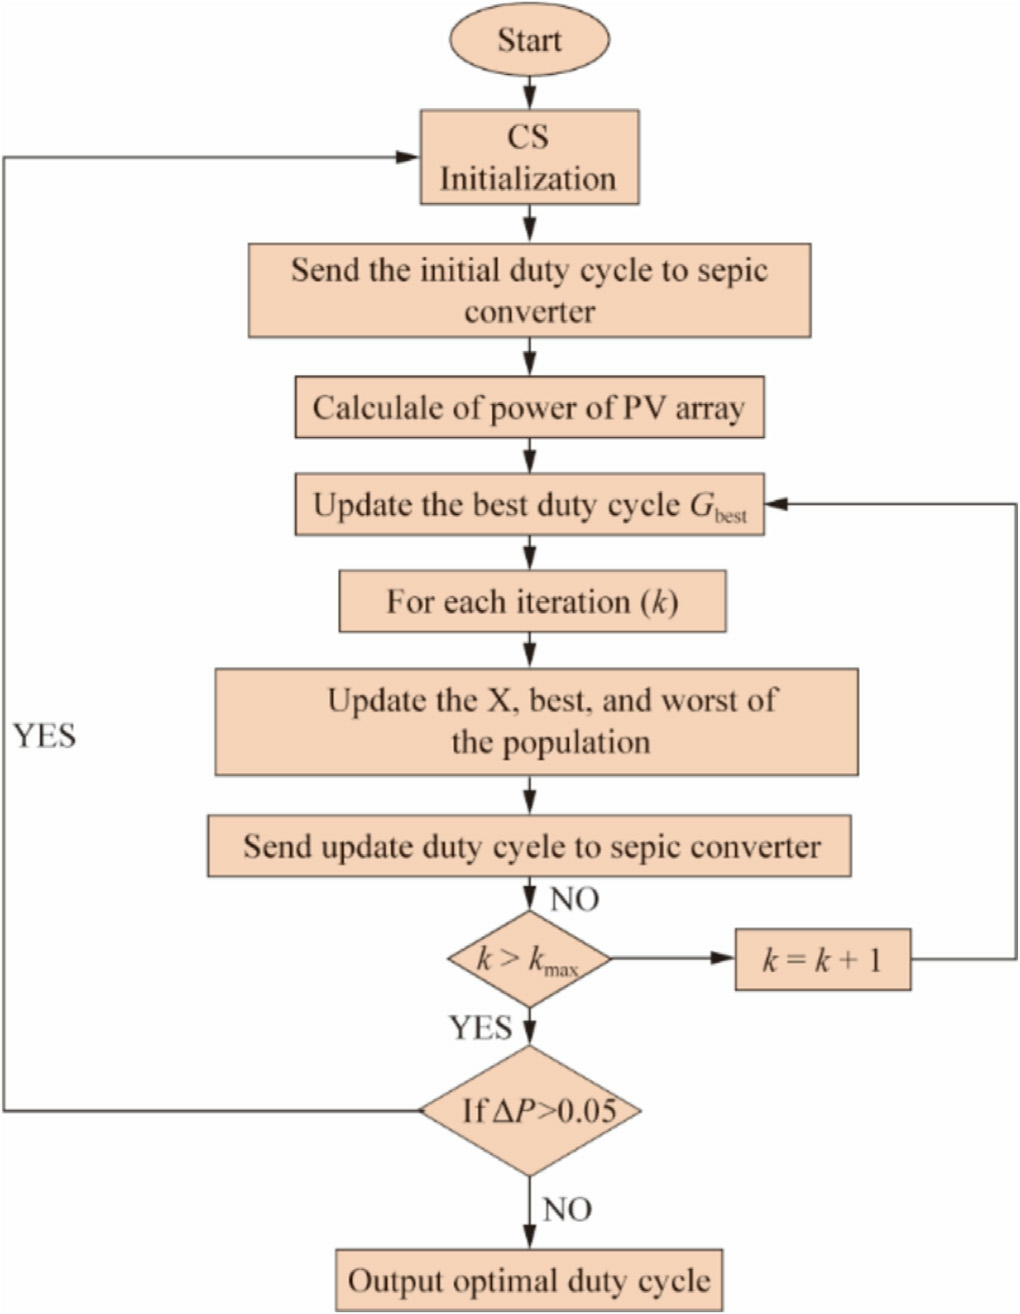
Fig.11.Flowchart of the CS algorithm.
Here, λ denotes the variance,which falls within the range,1 <λ<3,and l denotes the flight length.the generation of a new solution,![]() is given as follows:
is given as follows:
Here,k denotes the iteration index and α denotes the scaling factor.The proper tuning of α is crucial for optimizing performance across different search spaces.Typically, α is determined as follows:
where αodenotes the initial random value defined as the step change.Fig.11 depicts a flowchart illustrating the process of this function.
3 Result and discussion
3.1 Simulation results
Simulations were conducted using MATLAB/SIMULINK to evaluate the performance of the MPPT-based methods.The PV system model comprises a PV array configured with five series-connected modules (5S configuration), a SEPIC converter, a resistive load, and an MPPT controller.We employed the Sun Power 220 PVL PV mod-ule,rated at 220 W;Table 2 presents the detailed specifications.The SEPIC converter components are configured with C = 1000 μF, Cout = 1000 μF, and L = 470 mH.The switching frequency was set to 25 kHz,and the MPPT controller sampling time was defined as 0.05 s.Five case studies were performed to evaluate the proposed methods,including one scenario involving PSCs.These PSCs feature five peaks in the P-V curve,with the GMPP located at different positions (left, middle, and right), as shown in Fig.12.The performance of the proposed method was evaluated using seven algorithms: TGA, SSD, IDE,GWA, PSO, CS, and P&O.Figs.13 and 14 depicts the simulation results for the PV power and duty cycle of PSC-A, respectively.In this case, the GMPP was located on the right side of the P-V curve, corresponding to 158.13 W.The power outputs achieved by TGA, SSD,DE, GWA, PSO, CS, and P&O are 158.2 W, 158.3 W,158.5 W, 158.2 W, 158.1 W,158.4, and 157.9 W respectively.The tracking time of TGA, SSD, DE, GWA,PSO, CS, and P&O are 1.2, s, 0.95 s,1.5 s 1.4 s,2.8 s,1.6 s, and 5 s respectively.
Table 2 Sun Power 220 PVL of 220 W.

Power at MPP 220 W Voltage at MPP 40.06 V Current at MPP 5.998 A Voltage at Open Circuit 47.48 V Current at Open Circuit 6.34 A
3.2 Experimentation results
The proposed approaches were verified through experiments conducted using a system with a SEPIC converter,as shown in Fig.15.The system comprises an input capacitance of 1000 μF,output capacitance of 330 μF with a series capacitor, along with an inductance of 470 μH.It also comprises a load resistance of 20 Ω and a MOSFET that switches at a frequency of 25 kHz.The Chroma Model 62150H solar array simulator (SAS) helps in tracking the locations in the(P-V)search domain by modeling different shading conditions involving five linked modules.Table 2 presents the detailed specifications of the ‘‘Sun Power SPR-220-PVL,” a 200 W PV module.A partially shaded PV array is connected to the SEPIC via the SAS,as shown in Fig.16.A Lecroy Digital Signal Oscilloscope captures the critical parameters throughout the experiment at a sample rate of 0.05 s.The voltage and current measurements made using LEM’s LV-25P and LA-25NP sensors were supervised by the primary controller, DSpace(D1104).
3.2.1 Comparative study
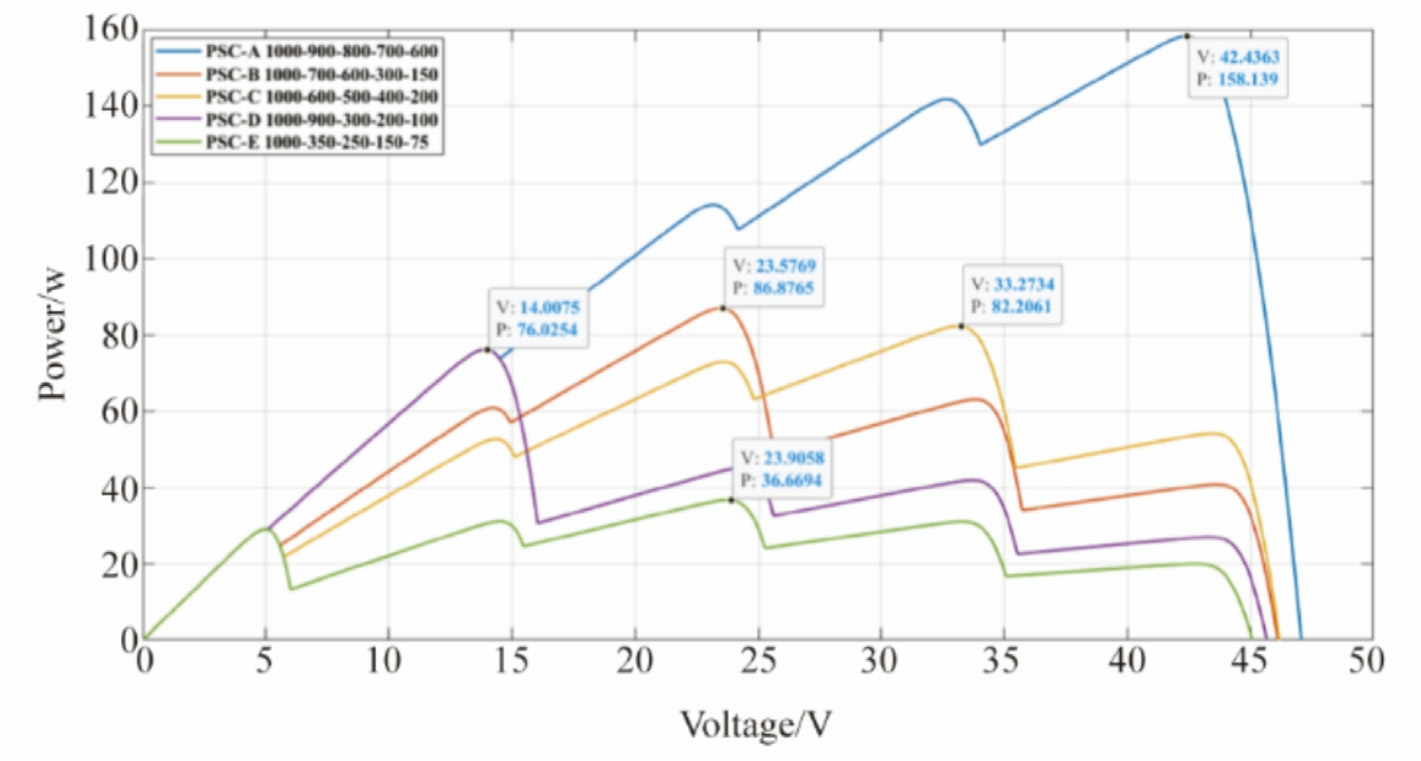
Fig.12.The P-V curves of the PV array under the PSCs.
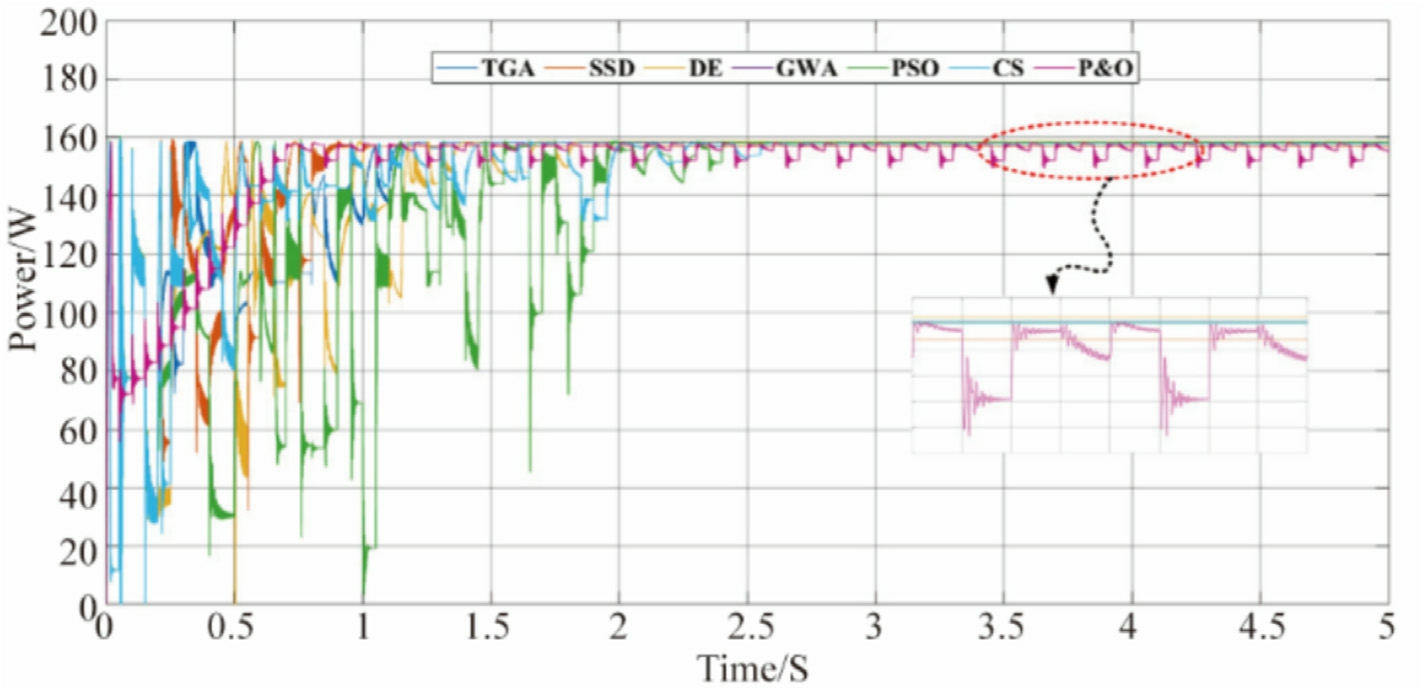
Fig.13.PSC-A power comparison.
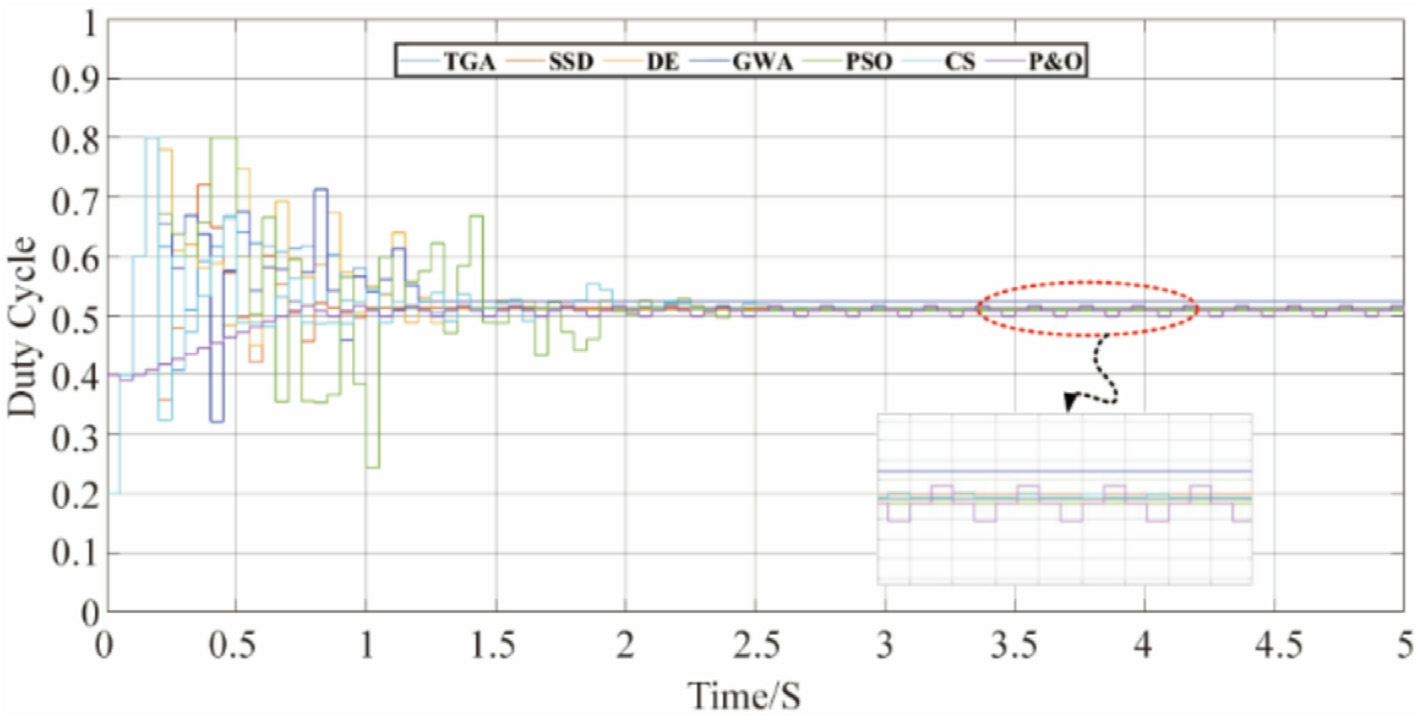
Fig.14.PSC-A Duty Cycle comparison.
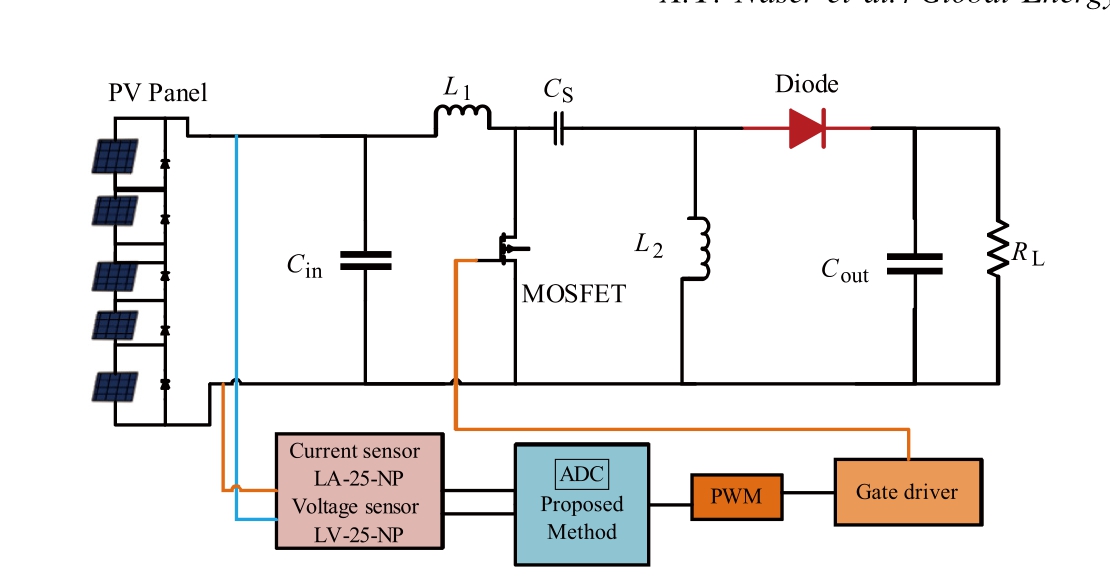
Fig.15.SEPIC converter.
Five methodologies were empirically evaluated using the following MPPT techniques: TGA, SSD, DE, GWA,PSO,and CS.The experimental setup used in this analysis included a SEPIC topology with homogeneous component configurations and constant sampling intervals.To verify the proposed technique, five complex PSCs with different peaks were evaluated.Below the search spaces for (P-V)and (I-V), the red dot indicates the operational point of the PV array under steady-state conditions.Eq.(28)calculates the tracking efficiency, depicted graphically in Fig.17, for the SAS combined with the PPV, VPV, and IPV values.
Table 4 lists all the tuning parameter values for the different approaches, along with their tracking times and steady-state effectiveness.The TGA and SSD only employed one tuning parameter each, whereas the DE,GWA, PSO, and CS used three tuning parameters per approach.
In the PSC-A arrangement, the GMPP is positioned at the extreme right end of the PV search area, enabling the extraction of a power of 156.7 W, as shown in Fig.17(a).The irradiance levels for the five modules were established at 1000, 900, 800, 700, and 600 W/m2.The TGA method achieved a remarkable tracking accuracy of 99.98%, accompanied by a fast convergence time of 1.1 s.The value of duty cycle, D, remained constant at 0.511 throughout this procedure.
In the case of PSC-B,the irradiance levels for the modules in the TGA were set to 1000, 700, 600, 300, and 150 W/m2.This configuration enabled the extraction of a maximum power of 90.23 W.Remarkably, the tracking of the GMPP was achieved within 0.75 s, demonstrating a high tracking efficiency of 98.51%.Additionally, D remained stable throughout the process, consistently measuring 0.591, as shown in Fig.17(a).
For PSC-C, the GMPP provided a power output of 85.93 W, as shown in Fig.17(a).In particular, the irradiance levels of the system were set to 1000, 600, 500, 400,and 200 W/m2.Effective tracking of the GMPP was achieved within a time of 1.25 s,presenting a tracking effi-ciency of 99.46%.Furthermore,D exhibited consistency by maintaing a fixed value of 0.507 throughout this procedure.
Within the PSC-D system, the maximum power output was 84.88 W.The designated irradiance levels were established at 1000, 900, 300, 200, and 100 W/m2.The D value exhibited stability as it approached 0.663.A tracking effi-cacy of 99.98% was achieved after effectively monitoring the GMPP for a duration of just 1 s.Fig.17(a)depicts this data.
PSC-E exhibits irradiance values of 1000,350,250,150,and 75 W/m2,as shown in Fig.17(a).Thus,we achieved a peak power output of 45.32 W.The GMPP achieved a detection accuracy of 99.87%and was tracked at 0.5 s.The value of D converged monotonically to 0.791 with stabilization.
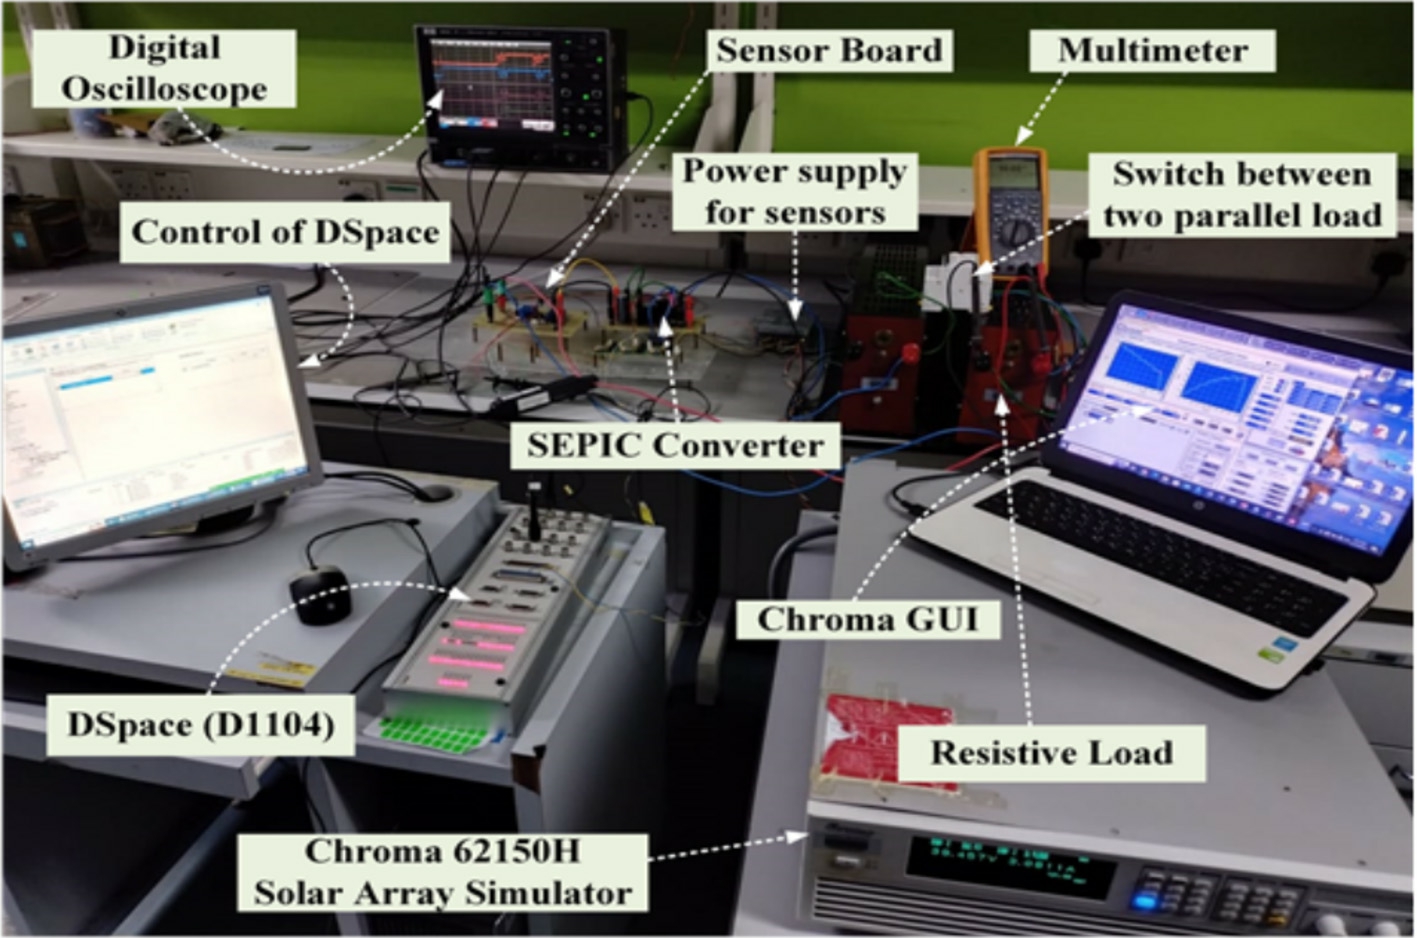
Fig.16.Experimental setup.
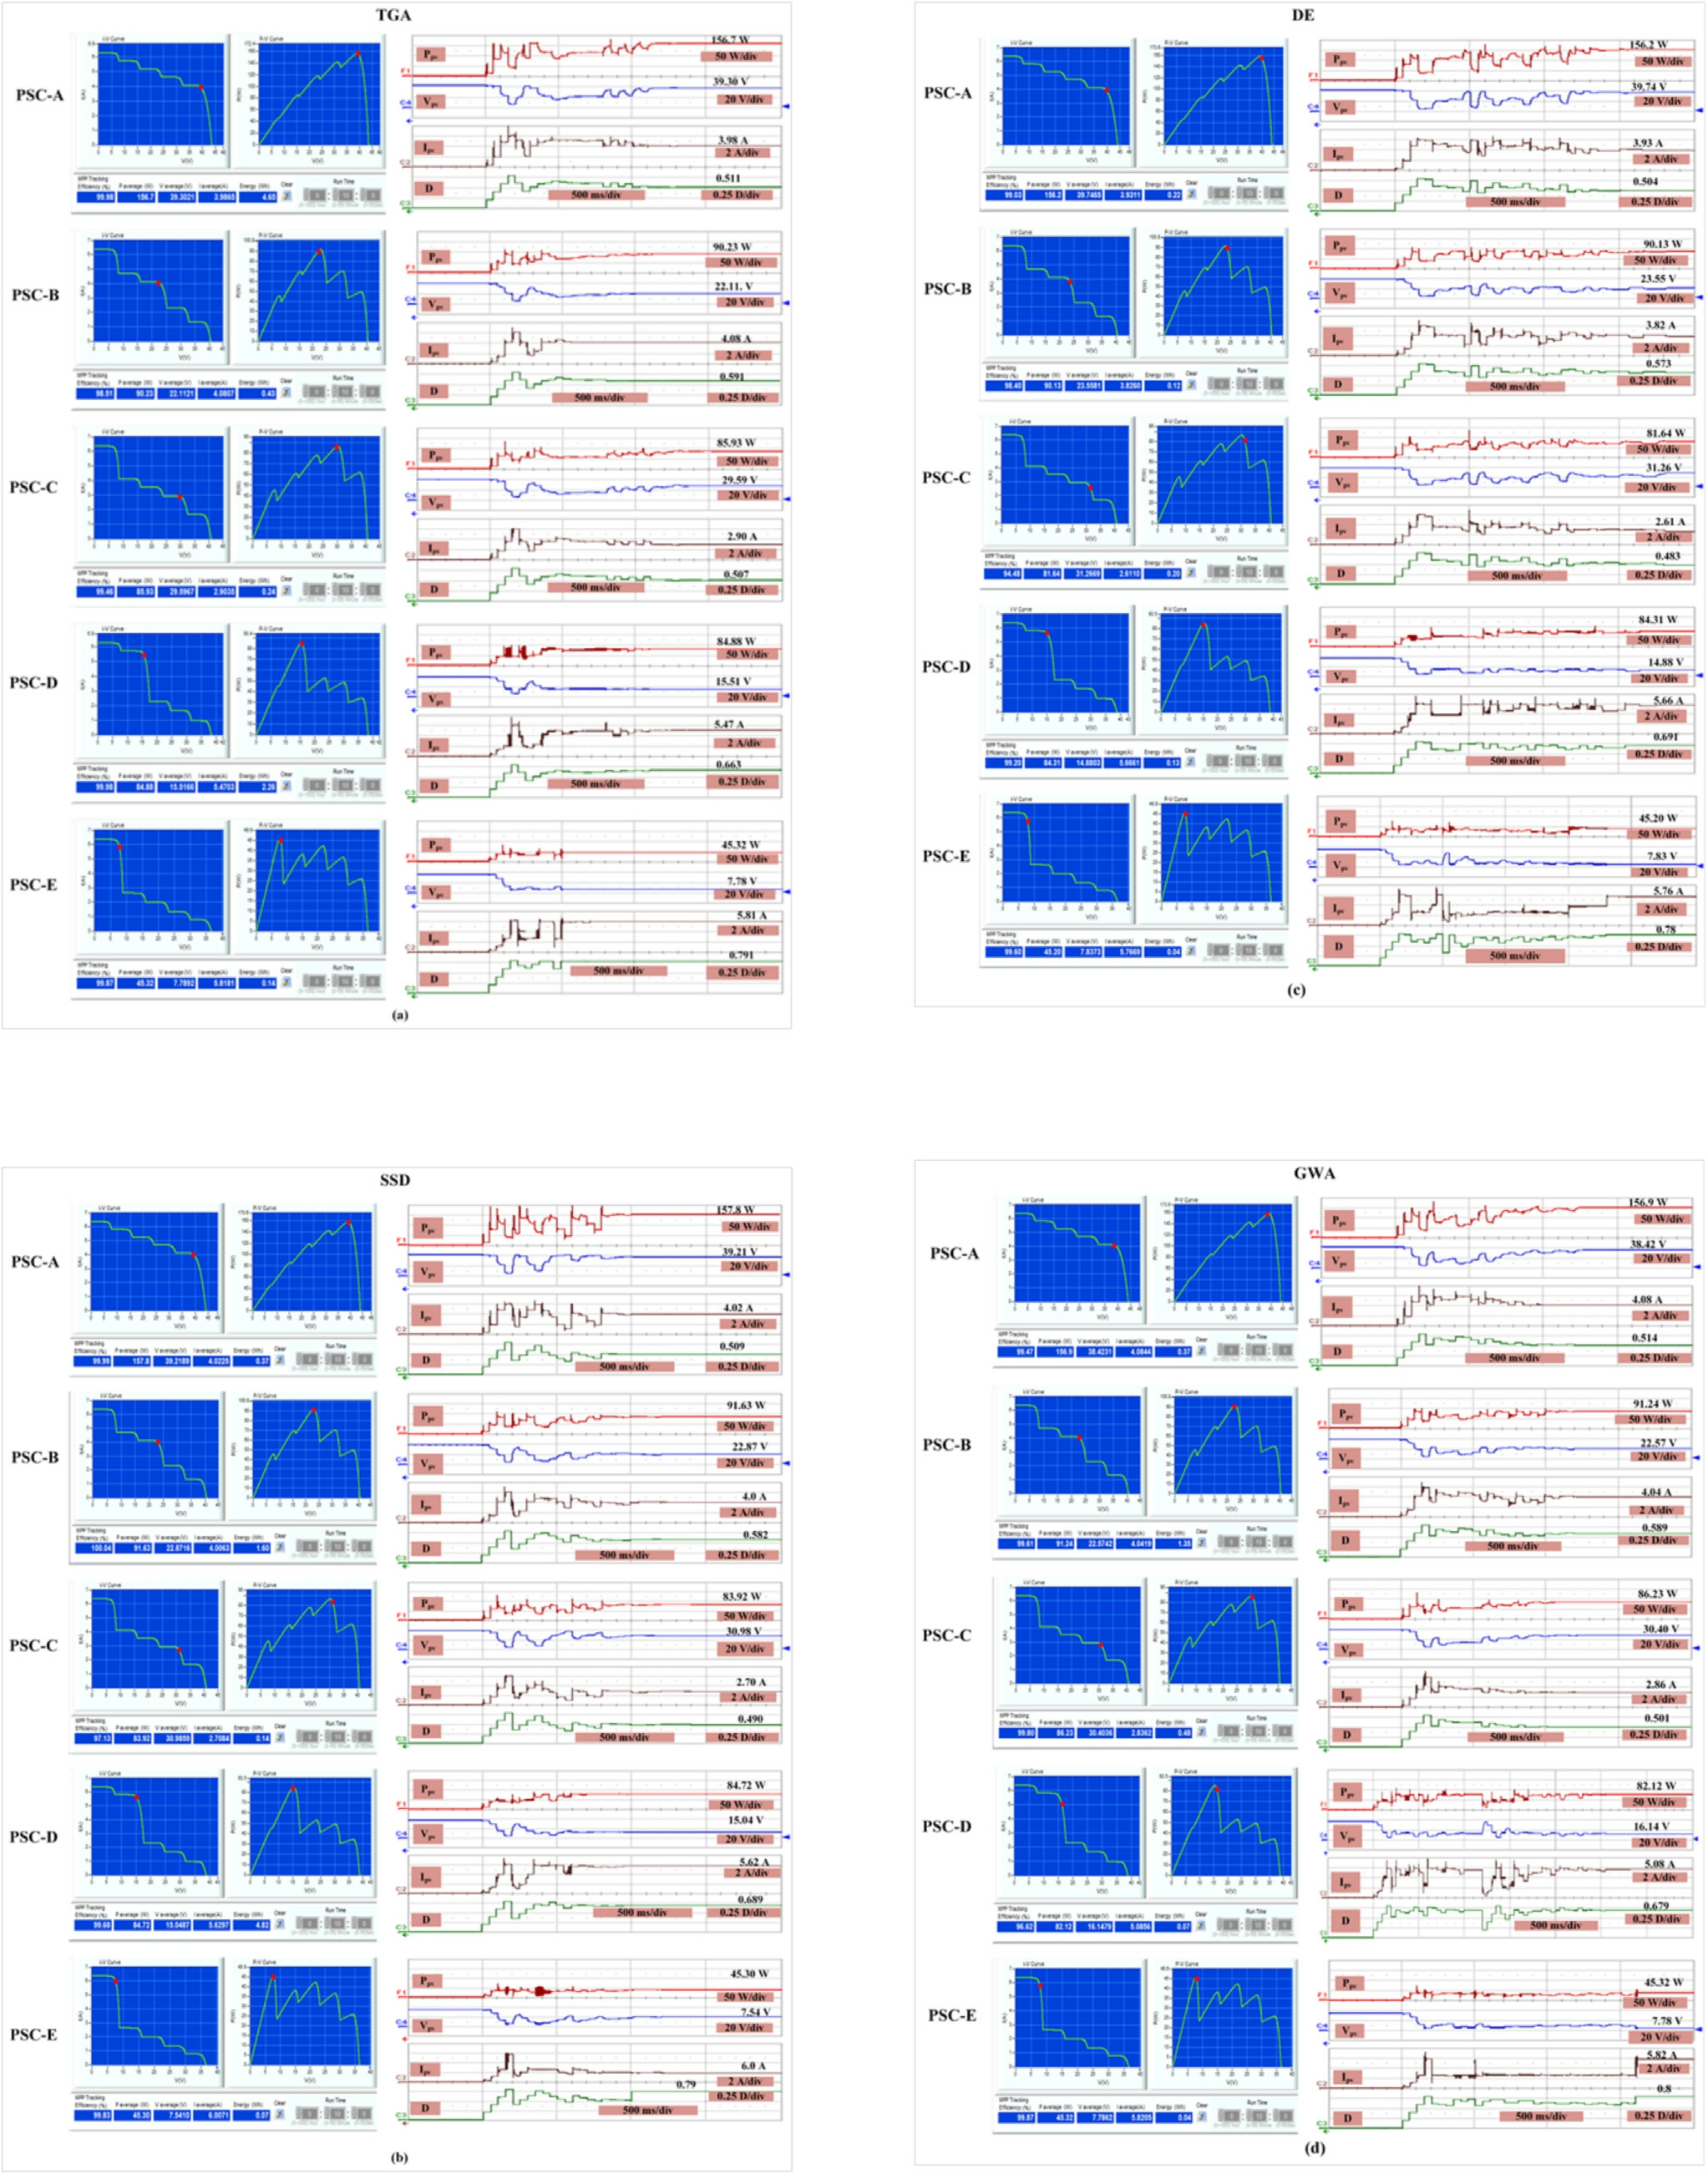
Fig.17.Comparing experiments from (PSC-A to PSC-E) between (a) TGA, (b) SSD, (c) DE, (d) GWA, (e) PSO, (f) CS, and (g) P&O.
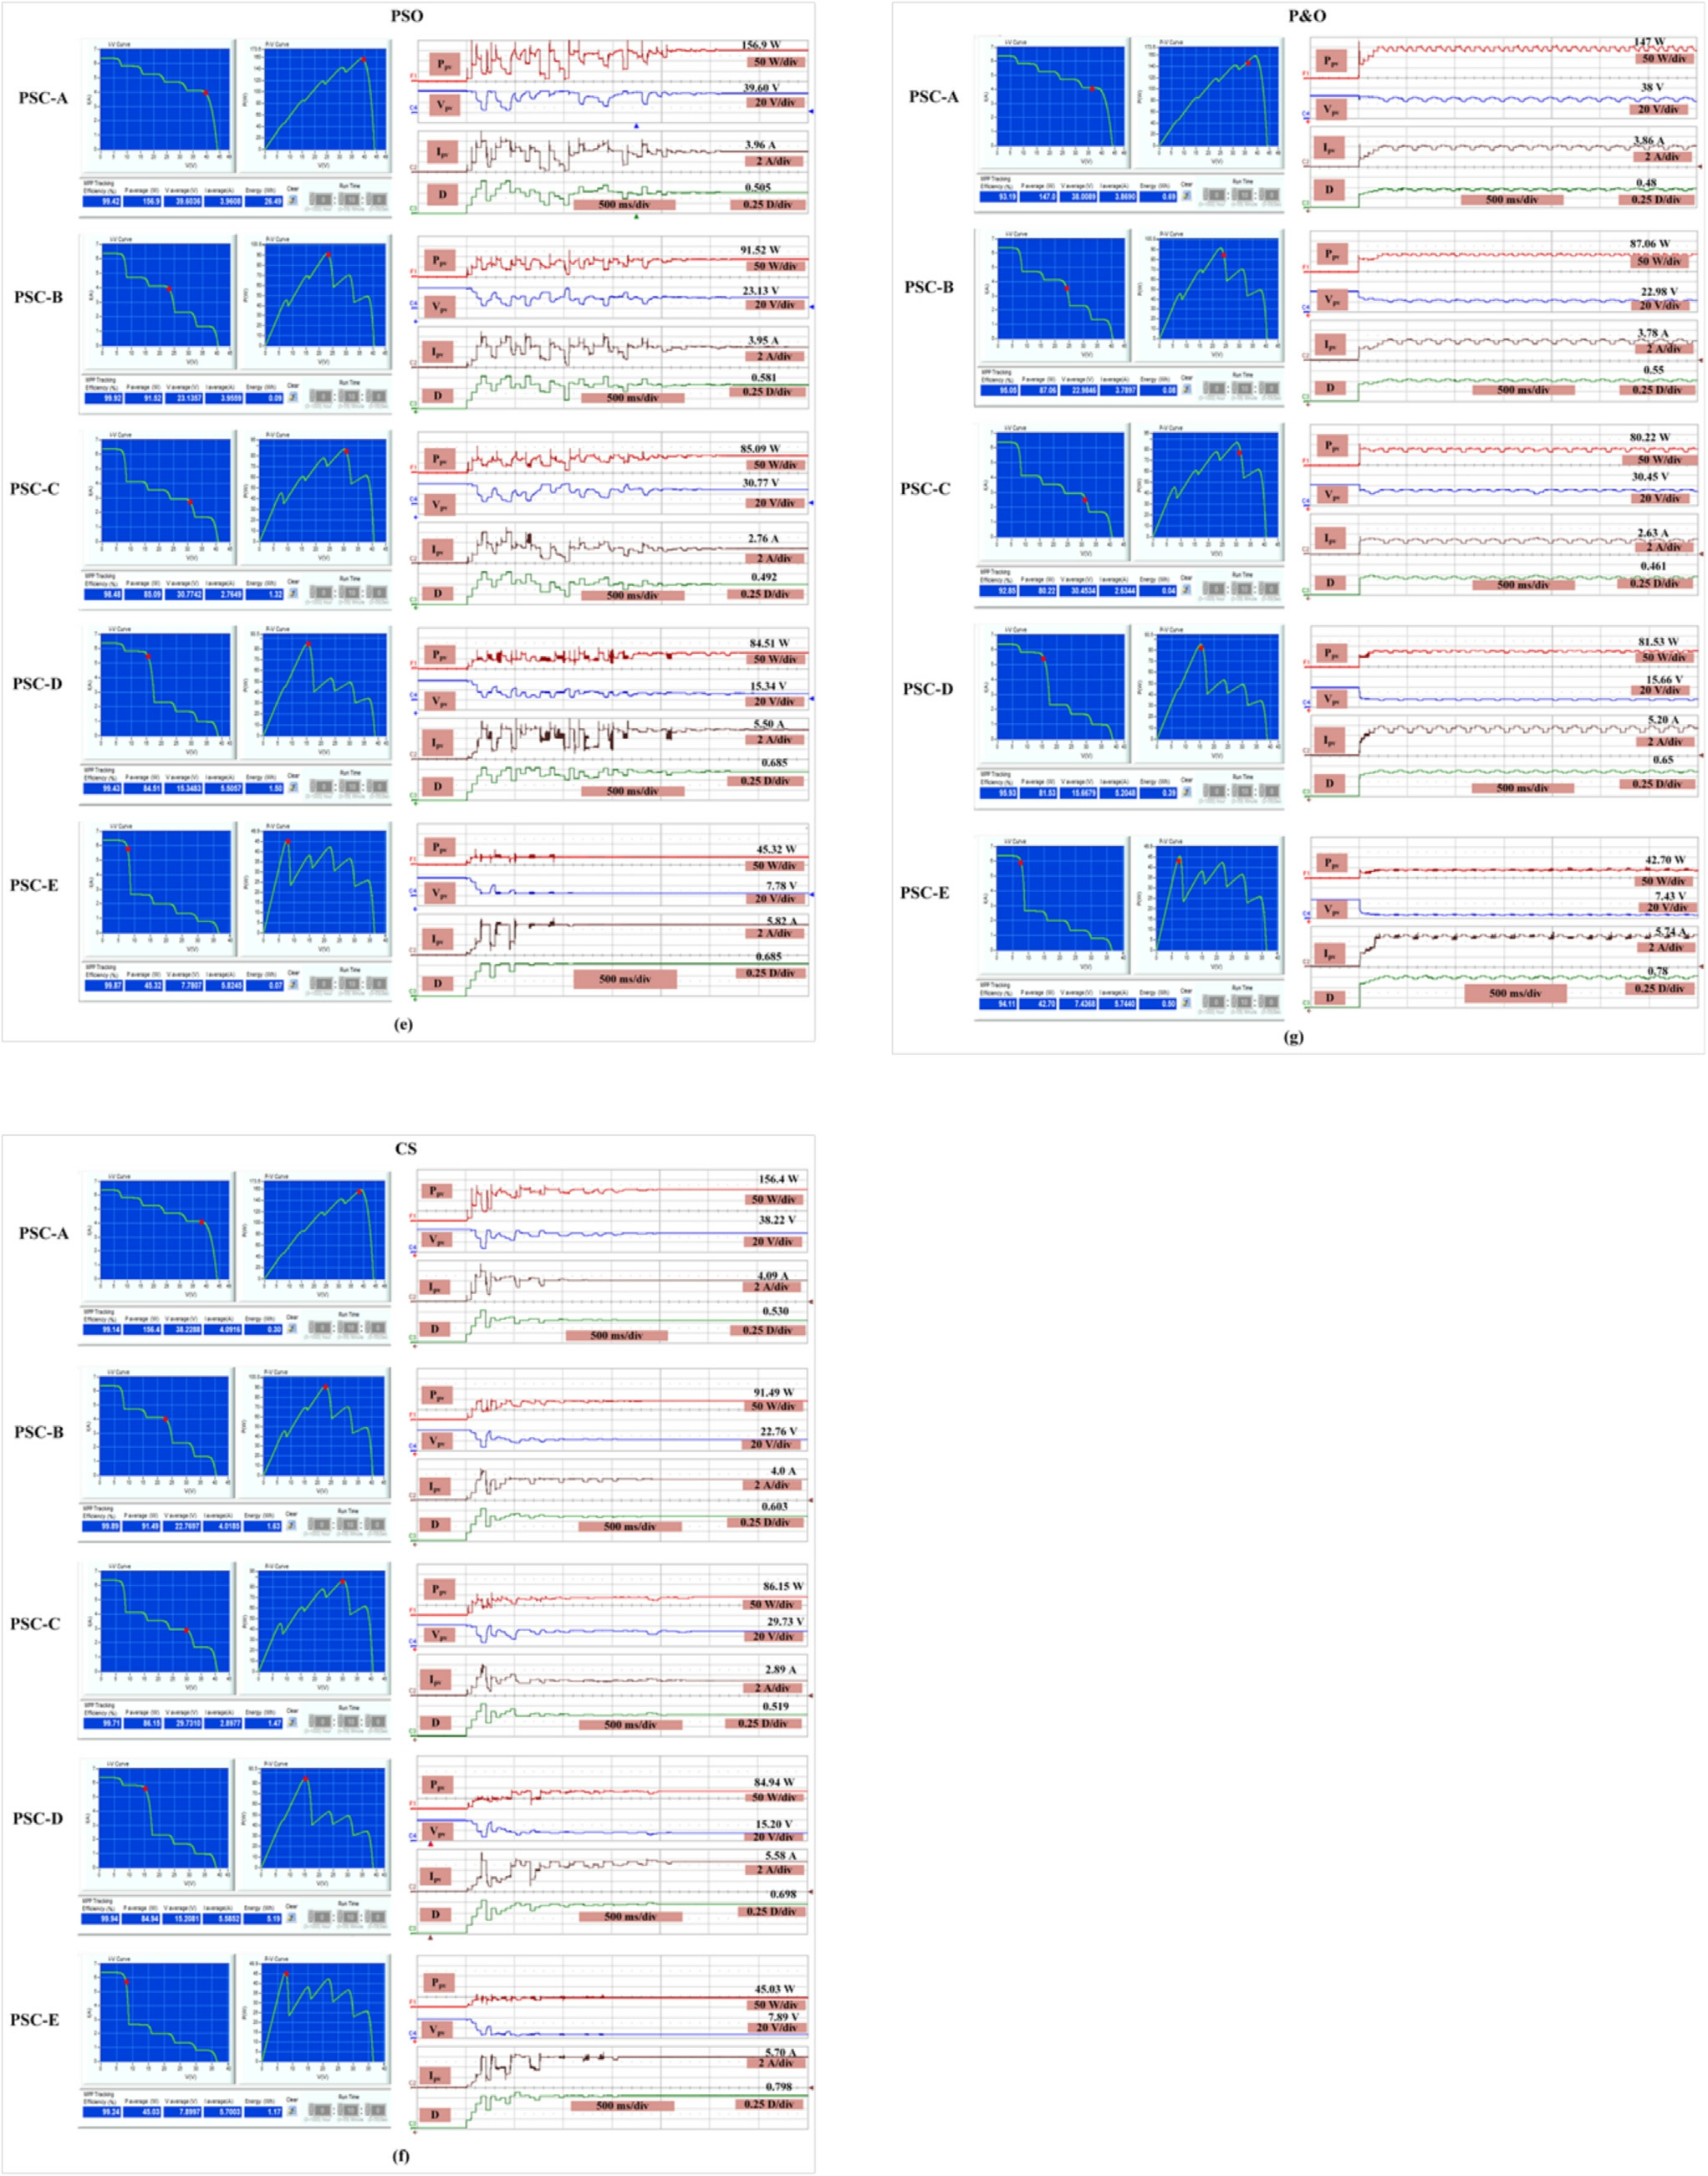
Fig 17.(continued)
Fig.17(a) to (e) present the empirical findings, which demonstrate the effectiveness of several algorithms in monitoring the GMPP.Table 4 presents a comprehensive comparison of the methodologies proposed in this study.The statistics demonstrate that the TGA and CS algorithms are highly efficient in accurately tracking the MPPT.The TG and SSD methodologies exhibit faster convergence rates when compared with the DE, GWA, PSO, and CS strategies.This enhanced speed can be attributed to the use of a single dynamic tuning parameter, thereby reducing the efficiency of the instrumentation environment(DE).
Overall, the TGA algorithm exhibited the highest performance among all the evaluated algorithms.The GMPP achieved an average tracking time of 0.92 s and a tracking efficiency of 99.54%.The CS achieved a tracking time of 1.78 s and efficiency of 99.59%.The GWA achieved a track-ing time of 1.52 s and an efficiency of 99.10%,whereas the SSD achieved an average tracking time of 1.06 s with an efficiency of 99.40%.The instruction set designer (DE)achieved an average tracking length of 1.63 s and a decreased efficiency of 98.20%.At an efficacy rate of 99.50%, the PSO exhibited a tracking duration of 2.63 s.The P&O method exhibited a reduced efficiency rate of 94.23%,along with the longest tracking duration of 3.86 s.
Table 3 Tuning parameters of PSO, GWA, DE, TGA, SSD, CS, and P&O.
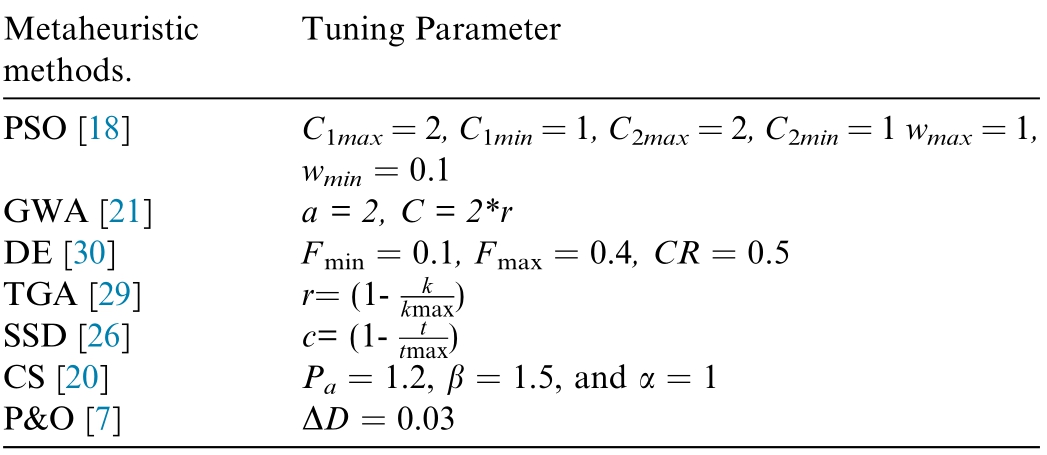
Metaheuristic methods.Tuning Parameter PSO [18]GWA [21] a = 2, C = 2*r DE [30] Fmin = 0.1, Fmax = 0.4, CR = 0.5 C1max=2,C1min=1,C2max=2,C2min=1 wmax=1,wmin = 0.1 TGA [29] r= (1- k kmax)SSD [26] c= (1- t tmax)CS [20] Pa = 1.2, β = 1.5, and α = 1 P&O [7] ΔD = 0.03
The results indicate that the TGA technique outperforms the conventional metaheuristic algorithms in terms of the tracking efficiency and speed.Table 3 summarizes the tuning parameters used in each algorithm.
3.2.2 A comparative analysis of the response to load variations
To demonstrate the effectiveness of the suggested approaches in adapting to changes in load circumstances,an empirical study was undertaken.The research assessed the efficacy of these approaches by using three previously published studies: TGA.[29], SSD [26], and DE [30].The DE approach surpasses all prior metaheuristic strategies in effectively and rapidly identifying the MPP for each load fluctuation in less than 0.05 s, as seen in Fig.18(b).However, a notable drawback of this strategy is its heavy dependence on the converter used, since the algorithm would need extensive alterations if a different converter were used.However,both TGA and SSD employed a fixed step-size strategy utilizing a constant perturbation D to regain the GMPP under varying load conditions, as illustrated in Fig.18(a).This approach achieved tracking within 0.25 s.However, the method is not without limitations.Increasing the perturbation value D introduces the risk of oscillations around the GMPP, whereas reducing D prolongs the tracking time, thereby impacting the effi-ciency of the process.
Table 4 Comparative study.
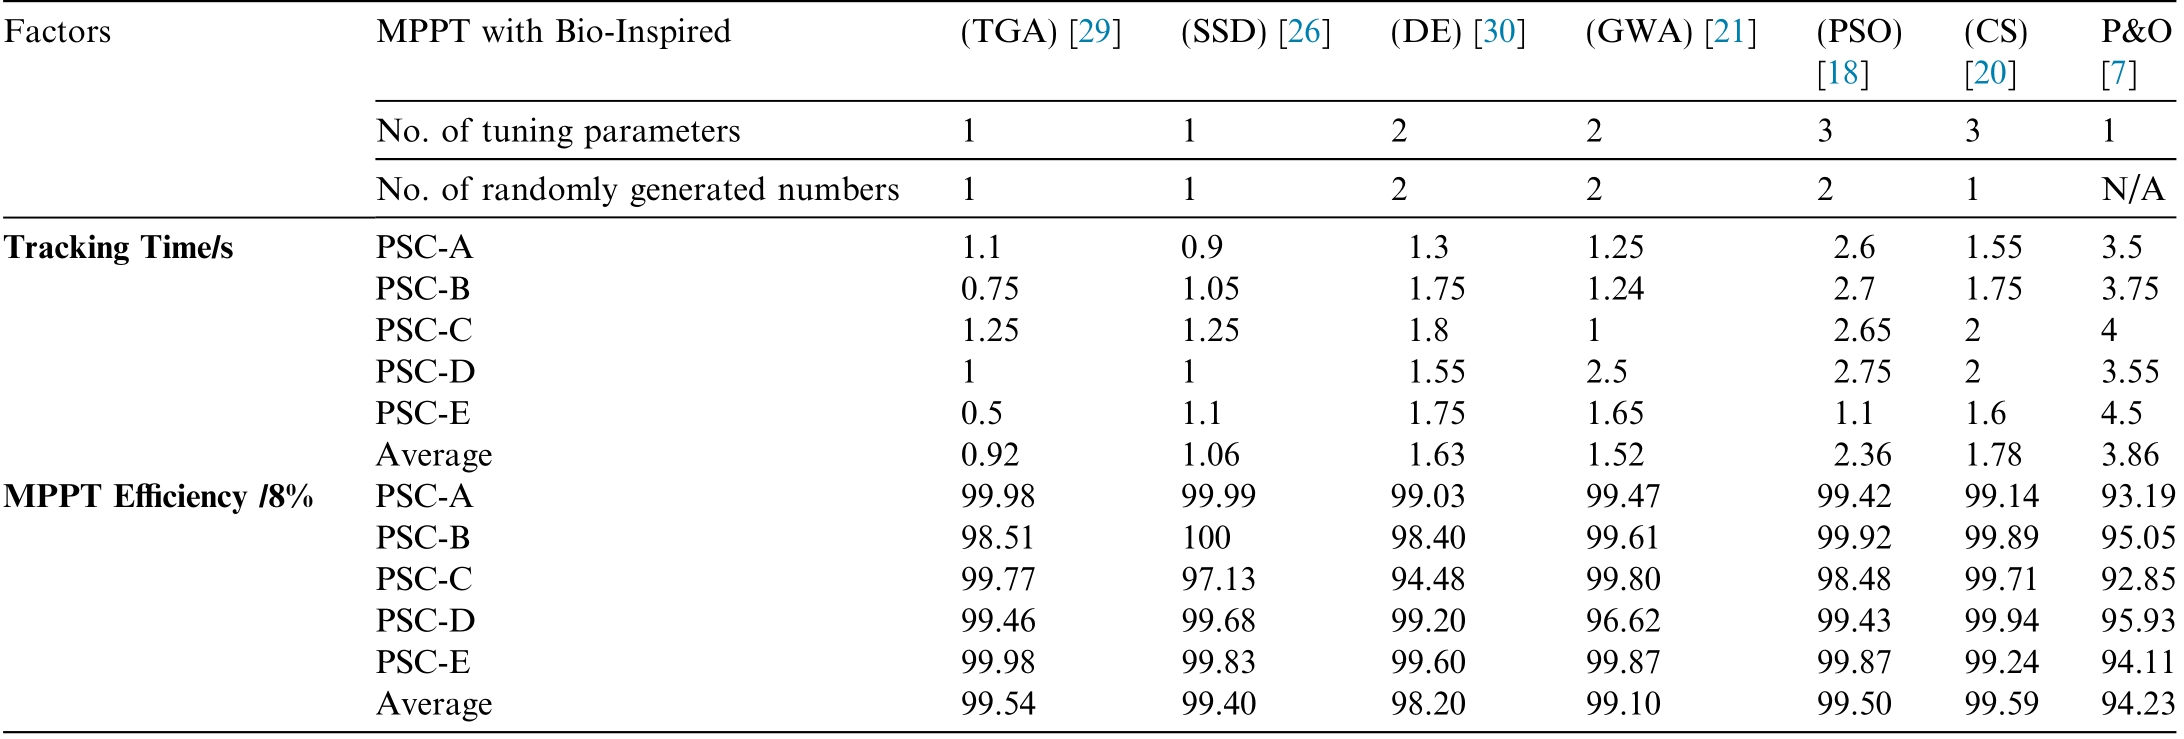
Factors MPPT with Bio-Inspired (TGA) [29] (SSD) [26] (DE) [30] (GWA) [21] (PSO)[18]P&O[7]No.of tuning parameters 1 1 2 2 3 3 1 No.of randomly generated numbers 1 1 2 2 2 1 N/A Tracking Time/s PSC-A 1.1 0.9 1.3 1.25 2.6 1.55 3.5 PSC-B 0.75 1.05 1.75 1.24 2.7 1.75 3.75 PSC-C 1.25 1.25 1.8 1 2.65 2 4 PSC-D 1 1 1.55 2.5 2.75 2 3.55 PSC-E 0.5 1.1 1.75 1.65 1.1 1.6 4.5 Average 0.92 1.06 1.63 1.52 2.36 1.78 3.86 MPPT Efficiency /8% PSC-A 99.98 99.99 99.03 99.47 99.42 99.14 93.19 PSC-B 98.51 100 98.40 99.61 99.92 99.89 95.05 PSC-C 99.77 97.13 94.48 99.80 98.48 99.71 92.85 PSC-D 99.46 99.68 99.20 96.62 99.43 99.94 95.93 PSC-E 99.98 99.83 99.60 99.87 99.87 99.24 94.11 Average 99.54 99.40 98.20 99.10 99.50 99.59 94.23(CS)[20]
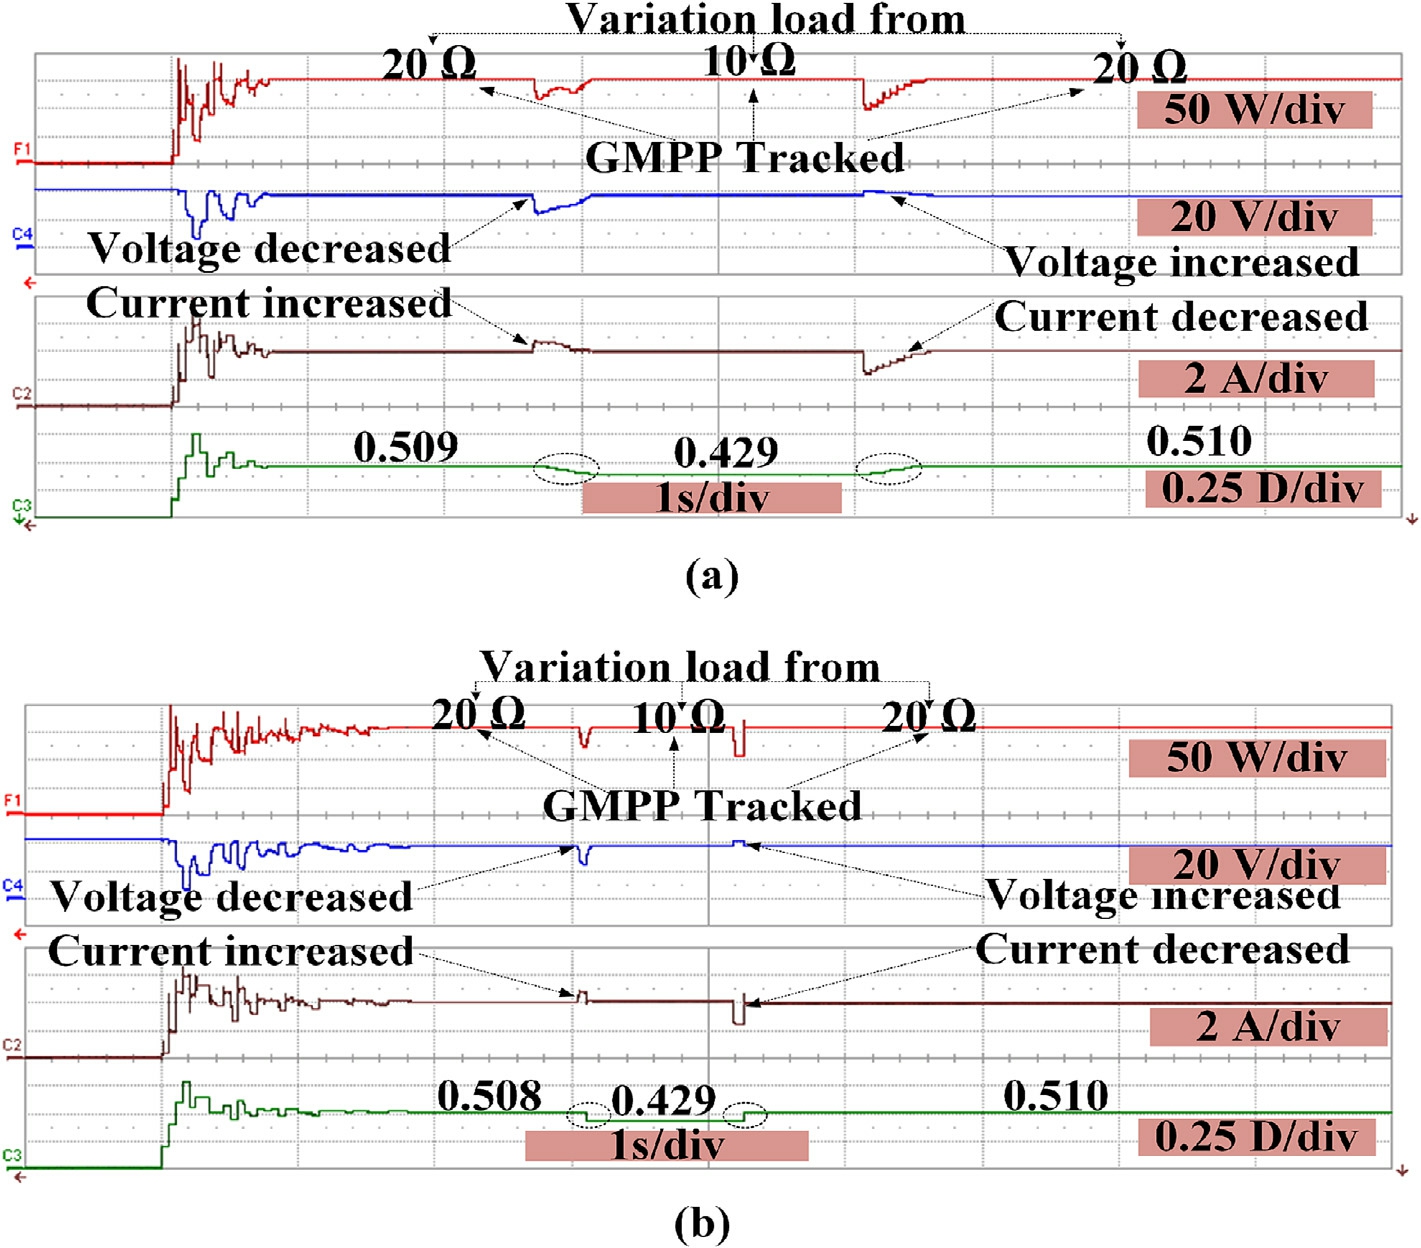
Fig.18.Comparison of TGA and SSD (a) and DE (b) for load variation.
4 Conclusion
This study presents a conceptual framework for an autonomous photovoltaic (PV) system comprising a PV generator linked to a DC-DC converter.The system design facilitates a comprehensive assessment of multiple maximum power point tracking(MPPT)controllers under various environmental conditions and their adaptability to load fluctuations.The primary goal was to evaluate the performance of the algorithms-based MPPT controller comparison to TGA, SSD, GWO, PSO, DE, SSD, and CS algorithms, identifying the most efficient approach.The findings reveal that the CS and TGA approaches excel in MPPT accuracy across different P-V curve positions,achieving efficiencies of 99.59% and 99.54%, respectively.TGA further distinguishes itself with a minimal average tracking time of 0.92 s, surpassing several existing MPPT methods.Further, the study rigorously examined the TGA effectiveness in managing load variations compared to the SSD and DE techniques.Notably,the DE algorithm demonstrated outstanding performance, accurately identifying the MPP for each load variation within 0.05 s,thereby outperforming the other tested metaheuristic approaches.
CRediT authorship contribution statement
Abdulbari Talib Naser: Writing - review & editing,Writing-original draft,Methodology,Investigation,Formal analysis,Data curation,Conceptualization.Nur Fadilah Ab Aziz: Supervision. Karam Khairullah Mohammed:Investigation. Karmila binti Kamil: Supervision. Saad Mekhilef: Supervision.
Declaration of competing interest
The authors declare that they have no known competing financial interests or personal relationships that could have appeared to influence the work reported in this paper.
Acknowledgments
This work was supported by the Ministry of Higher Education (MOHE)of Malaysia through a research grant FRGS/1/2023/TK08/ UNITEN/02/9.
References
-
[1]
T.Yue, Y.Wang, Y.Wang, Research on the promotion of Solar Energy House, in: ICMREE2011 - Proc.2011 Int.Conf.Mater.Renew.Energy Environ., vol.1, no.4, 2011, pp.247-250.https://doi.org/10.1109/ICMREE.2011.5930806. [百度学术]
-
[2]
A.K.Podder, N.K.Roy, H.R.Pota, MPPT methods for solar PV systems: a critical review based on tracking nature, IET Renew.Power Gener.13 (10) (2019) 1615-1632, https://doi.org/10.1049/iet-rpg.2018.5946. [百度学术]
-
[3]
M.Mao, L.Cui, Q.Zhang, K.Guo, L.Zhou, H.Huang,Classification and summarization of solar photovoltaic MPPT techniques: a review based on traditional and intelligent control strategies, Energy Rep.6 (174) (2020) 1312-1327, https://doi.org/10.1016/j.egyr.2020.05.013. [百度学术]
-
[4]
S.Daraban, D.Petreus, C.Morel, A novel MPPT (maximum power point tracking) algorithm based on a modified genetic algorithm specialized on tracking the global maximum power point in photovoltaic systems affected by partial shading, Energy (2014)1-15, https://doi.org/10.1016/j.energy.2014.07.001. [百度学术]
-
[5]
L.Huang, J.Zhang, Q.Cui, H.Wang, J.Shu, Maximum power point tracking scheme with partial shading detection for two-stage grid-connected photovoltaic inverters, J.Eng.2019 (16) (2019)2556-2562, https://doi.org/10.1049/joe.2018.8547. [百度学术]
-
[6]
M.A.M.Ramli,S.Twaha,K.Ishaque,Y.A.Al-Turki,A review on maximum power point tracking for photovoltaic systems with and without shading conditions,Renew.Sustain.Energy Rev.67(2017)144-159, https://doi.org/10.1016/j.rser.2016.09.013. [百度学术]
-
[7]
G.Dileep, S.N.Singh, Maximum power point tracking of solar photovoltaic system using modified perturbation and observation method, Renew.Sustain.Energy Rev.50 (2015) 109-129, https://doi.org/10.1016/j.rser.2015.04.072. [百度学术]
-
[8]
A.Safari, S.Mekhilef, K.S.Tey, S.Mekhilef, S.Member,Simulation and hardware implementation of incremental conductance MPPT with direct control method using Cuk converter, IEEE Trans.Ind.Electron.58 (10) (2014) 5384-5392. [百度学术]
-
[9]
K.S.Tey, S.Mekhilef, S.Member, Modified incremental conductance algorithm for photovoltaic system under partial shading conditions and load variation, IEEE Trans.Ind.Electron.61 (10) (2014) 5384-5392. [百度学术]
-
[10]
B.C.Phan, Y.Lai, A Deep reinforcement learning-based MPPT control, Sensors (2020). [百度学术]
-
[11]
Y.Wang, Y.Yang, G.Fang, B.Zhang, H.Wen, H.Tang, L.Fu,X.Chen,An advanced maximum power point tracking method for photovoltaic systems by using variable universe fuzzy logic control considering temperature variability,Electronics(2018),https://doi.org/10.3390/electronics7120355. [百度学术]
-
[12]
N.Pamuk, Performance analysis of different optimization algorithms for MPPT control techniques under complex partial shading conditions in PV systems, Energies 16 (8) (2023), https://doi.org/10.3390/en16083358. [百度学术]
-
[13]
A.Feroz, M.Mansoor, Q.Ling, B.Yin, M.Y.Javed, A Salp-Swarm Optimization based MPPT technique for harvesting maximum energy from PV systems under partial shading conditions, Energy Convers.Manag.209 (February), (2020)112625, https://doi.org/10.1016/j.enconman.2020.112625. [百度学术]
-
[14]
M.Seyedmahmoudian, T.K.Soon, B.Horan, A.Ghandhari, S.Mekhilef, A.Stojcevski, New ARMO-based MPPT technique to minimize tracking time and fluctuation at output of PV systems under rapidly changing shading conditions, IEEE Trans.Ind.Inform.3203(c)(2019)1,https://doi.org/10.1109/tii.2019.2895066. [百度学术]
-
[15]
D.Fares, M.Fathi, I.Shams, S.Mekhilef, A novel global MPPT technique based on squirrel search algorithm for PV module under partial shading conditions, Energy Convers.Manag.230(December 2020), (2021) 113773, https://doi.org/10.1016/j.enconman.2020.113773. [百度学术]
-
[16]
A.Talib et al., A fast-tracking MPPT-based modified coot optimization algorithm for PV systems under partial shading conditions,Ain Shams Eng.J.(July 2023), (2024)102967,https://doi.org/10.1016/j.asej.2024.102967. [百度学术]
-
[17]
K.K.Mohammed, S.Mekhilef, S.Buyamin, Improved Rat Swarm Optimizer Algorithm-based MPPT under partially shaded conditions and load variation for PV systems, IEEE Trans.Sustain.Energy(2022),https://doi.org/10.1109/TSTE.2022.3233112. [百度学术]
-
[18]
K.Ishaque, Z.Salam, M.Amjad, S.Mekhilef, An improved particle swarm optimization (PSO)- based MPPT for PV with reduced steady-state oscillation, IEEE Trans.Power Electron.27(8) (2012) 3627-3638. [百度学术]
-
[19]
C.Manickam, G.P.Raman, G.R.Raman, S.I.Ganesan, N.Chilakapati, Fireworks enriched P&O algorithm for GMPPT and detection of partial shading in PV systems, IEEE Trans.Power Electron.32 (6) (2017) 4432-4443, https://doi.org/10.1109/TPEL.2016.2604279. [百度学术]
-
[20]
J.Ahmed, Z.Salam, A maximum power point tracking (MPPT)for PV system using Cuckoo search with partial shading capability,Appl.Energy 119 (2014) 118-130, https://doi.org/10.1016/j.apenergy.2013.12.062. [百度学术]
-
[21]
S.Mohanty, B.Subudhi, S.Member, P.K.Ray, A new MPPT design using grey wolf optimization technique for photovoltaic system under partial shading conditions, IEEE Trans.Sustain.Energy (2015) 1-8. [百度学术]
-
[22]
A.M.Eltamaly, M.S.Al-Saud, A.G.Abokhalil, A novel bat algorithm strategy for maximum power point tracker of photovoltaic energy systems under dynamic partial shading,IEEE Access 8 (2020). [百度学术]
-
[23]
I.Shams, S.Mekhilef, K.S.Tey, Maximum power point tracking using modified butterfly optimization algorithm for partial shading, uniform shading, and fast varying load conditions,IEEE Trans.Power Electron.36 (5) (2021) 5569-5581, https://doi.org/10.1109/TPEL.2020.3029607. [百度学术]
-
[24]
A.Talib, K.Khairullah,N.Fadilah, A.Aziz, S.Mekhilef, Energy Conversion and Management: X Improved coot optimizer algorithm-based MPPT for PV systems under complex partial shading conditions and load variation,Energy Convers.Manag.X 22 (January) (2024), https://doi.org/10.1016/j.ecmx.2024.100565. [百度学术]
-
[25]
A.S.Benyoucef, A.Chouder, K.Kara, S.Silvestre, O.A.Sahed,Artificial bee colony based algorithm for maximum power point tracking (MPPT) for PV systems operating under partially shaded conditions, Appl.Soft Comput.J.(2015) 1-11, https://doi.org/10.1016/j.asoc.2015.03.047. [百度学术]
-
[26]
I.Shams, S.Mekhilef, K.S.Tey, Improved social ski driver-based MPPT for partial shading conditions hybridized with constant voltage method for fast response to load variations, IEEE Trans.Sustain.Energy 12 (4) (2021) 2255-2267, https://doi.org/10.1109/TSTE.2021.3088119. [百度学术]
-
[27]
M.Hamza Zafar et al., A novel meta-heuristic optimization algorithm based MPPT control technique for PV systems under complex partial shading condition, Sustain.Energy Technol.Assessments 47(February), (2021)101367,https://doi.org/10.1016/j.seta.2021.101367. [百度学术]
-
[28]
A.Fathy, H.Rezk, D.Yousri, A robust global MPPT to mitigate partial shading of triple-junction solar cell-based system using manta ray foraging optimization algorithm,Sol.Energy 207(March)(2020)305-316,https://doi.org/10.1016/j.solener.2020.06.108. [百度学术]
-
[29]
I.Shams, S.Mekhilef, K.S.Tey, Improved-team-gameoptimization-algorithm-based solar MPPT with fast convergence speed and fast response to load variations, IEEE Trans.Ind.Electron.68 (8) (2021) 7093-7103, https://doi.org/10.1109/TIE.2020.3001798. [百度学术]
-
[30]
K.S.Tey, S.Mekhilef, S.Member, M.Seyedmahmoudian,Improved differential evolution-based MPPT algorithm using SEPIC for PV systems under partial shading conditions and load variation, IEEE Trans.Ind.Inform.3203 (c) (2018), https://doi.org/10.1109/TII.2018.2793210. [百度学术]
-
[31]
B.Yang et al., Comprehensive overview of maximum power point tracking algorithms of PV systems under partial shading condition,J.Clean.Prod.268, (2020) 121983, https://doi.org/10.1016/j.jclepro.2020.121983. [百度学术]
-
[32]
Z.Wen,J.Chen,X.Cheng,H.Niu,X.Luo,A new and simple split series strings approach for adding bypass diodes in shingled cells modules to reduce shading loss, Sol.Energy 184 (March) (2019)497-507, https://doi.org/10.1016/j.solener.2019.03.099. [百度学术]
-
[33]
J.Bai, Y.Cao, Y.Hao, Z.Zhang, S.Liu, F.Cao, Characteristic output of PV systems under partial shading or mismatch conditions, Sol.Energy 112 (2015) 41-54, https://doi.org/10.1016/j.solener.2014.09.048. [百度学术]
-
[34]
O.Bingo¨l, B.O¨zkaya, Analysis and comparison of different PV array configurations under partial shading conditions,Sol.Energy 160 (November 2017) (2018) 336-343, https://doi.org/10.1016/j.solener.2017.12.004. [百度学术]
-
[35]
R.Celikel, M.Yilmaz, A.Gundogdu, Improved voltage scanning algorithm based MPPT algorithm for PV systems under partial shading conduction,Heliyon 10(20), (2024)e39382,https://doi.org/10.1016/j.heliyon.2024.e39382. [百度学术]
-
[36]
M.J.Mahmoodabadi, M.Rasekh, T.Zohari, TGA: Team game algorithm, Fut.Comput.Informatics J.3 (2) (2018) 191-199,https://doi.org/10.1016/j.fcij.2018.03.002. [百度学术]
-
[37]
A.Tharwat, T.Gabel, Parameters optimization of support vector machines for imbalanced data using social ski driver algorithm,Neural Comput.Appl.32 (11) (2020) 6925-6938, https://doi.org/10.1007/s00521-019-04159-z. [百度学术]
-
[38]
R.Storn, K.Price, Minimizing the real functions of the ICEC’96 contest by differential evolution xi , G + l, 1996, pp.842-844. [百度学术]
-
[39]
S.Mirjalili, S.M.Mirjalili, A.Lewis, Grey Wolf Optimizer, Adv.Eng.Softw.69 (2014) 46-61, https://doi.org/10.1016/j.advengsoft.2013.12.007. [百度学术]
-
[40]
R.Eberhart, J.K.Sixth, A new optimizer using particle swarm theory, in: Proc.IEEE Symp.Micro Mach.Hum.Sci.Nagoys,Japan,pp.39-43,1997,[Online].Available:https://ieeexplore.ieee.org/abstract/document/494215.?casa_token=VRHbIOq0xY0AAAAA:tigoKrFPGIOWOZPL3HUCxeJDuwp HdMr7AdrNcyfXSzfY9zdeQ3AAVzx9vdb63ZQ8Q1ZwFq8E5okfcE. [百度学术]
-
[41]
X.Yang, S.Deb, A.C.B.Behaviour, Cuckoo Search via Le´vy flights,2009 World Congr Nat.Biol.Inspired Comput.(2009)210-214, https://doi.org/10.1109/NABIC.2009.5393690. [百度学术]
Fund Information

