Recommended articles:
-

-
Global Energy Interconnection
Volume 8, Issue 4, Aug 2025, Pages 581-597
Demand Response in power off-grid microgrids in Nigeria: a game theory approach
Abstract
Abstract
0 Introduction
One of the major challenges today is ensuring universal access to clean and sustainable energy, particularly for populations in developing countries, most of which are located in tropical regions[1,2].Access to electricity, more specifically, is one of the central pillars of social and economic development [3,4], which should enhance the fulfillment of at least the basic needs such as lighting, access to educati on and fresh food, including healthcare, income generation and job creation [4].More than 600 million people worldwide still lack access to electricity, with electrification rates varying significantly by region, from nearly 100% in North Africa to 45% in Sub-Saharan Africa (excluding the country South Africa) and as low as 25% in some rural areas [5,6].
Decentralised renewable power systems, such as solar photovoltaic (PV) panels, wind turbines and small hydropower plants, are among the most suitable and readily available technologies to accelerate progress toward universal access to modern energy services by 2030, in line with the 7th United Nations Sustainable Development Goal.Africa is richly endowed with vast renewable energy resources, particularly solar energy [7].In recent years,rapid advances in energy technologies and information and communication technology, combined with the significant decli ne in solar equipment prices, have created new opportunities to access clean and sustainable energy.
This study focuses on microgrids equipped with solar photovoltaic panels in Sub-Saharan African cities.Although urban households generally have a higher electrification rate than rural homes, they still face significant challenges.These include poor service delivery due to an unstable grid,unreliable energy supply and low generation capacity, with frequent load sheddings and blackouts [8].Households situated near or entirely off the grid frequently lack access to electricity, particularly in peri-urban areas.More than half of the urban population lives in informal settlements, accounting for at least 110 million people[9].Furthermore, high connection costs are a major barrier to access the grid [10], which often incentivizes some users to make illegal connections to the grid, leading to significant revenue losses for utilities [6].
Most of the literature on energy access in developing countries focusses on rural stand-alone and off-grid electrification.These studies typically use mathematical models and optimization techniques to determine the size of hybrid wind and solar systems with battery storage [11-14].The primary objective is to optimize system design while ensuring a reliable power supply at minimal energy costs.This paper goes beyond technology sizing by incorporating strategies that utilities and households can use to negotiate tariffs and optimally allocate electricity.
Game theory is widely used in the scientific literature to model interactions among participants, particularly through cooperative games such as Stackel berg, Nash,and coalition formation between users, aggregators and utilities.For example, [15] developed a coalitional gamebased optimization approach, demonstrating that households equipped with hybrid renewable-storage systems can considerab ly reduce electricity costs through energy sharing and trading.Similarly, [16] applied cooperative game theory to interconnected microgrids, which achieved cost redu ctions and facilitated energy transactions between communities.[17,18] extended decentralized optimization approaches for microgrid scheduling and coordination by developing a three-layer strategy applied to smart buildings and electric vehicle fleets.Non-cooperative games have also been applied to smart grids, such as in peer-to-peer trade configurations [19] and at larger scales distributed energy resource management [20,21].
Most of negotiation-based approaches incorporate Demand Response programs to assess the technical potential of power systems to meet demand with reduced capacity.These strategies are particularly important in developing countries where affordability and community participation are critical to the success of energy systems.Demand Response methods and smart grid management encompass a diverse range of app roaches, from models with passive consumers and direct load control, to those involving proactive consumers who respond to tariffoptions [22-24].Incentive-based Demand Response is extensively developed using Stackelberg games, with the distribution system ope rator acting as the leader and prosumers as followers [25].This hierarchical approach coordinates the community’s response to grid signals and facilitates effici ent demand-side management.A significant body of work [18,26,27] highlights the potential of multiagent decision-making frameworks to manage dynamic load scheduling, storage dispatch and cost-sharing.Innovative mu lti-objective algorithms based on metaheuristic and artificial intelligence methods are developed in [28]for application at the apartment and buildin g level, and in [17] for coordinating multiple microgrids at a larger scale.Furthermore, sophisticated home energy management models are elabora ted to account for uncertainties that may arise in domestic installations [29].
Most studies acknowledge the technical and economic benefits of integrating Demand Response into microgrid operation, reporting improvements in load management,peak reduction, and cost savings.Numerically, hous eholds equipped with hybrid renewable energy and storage systems can achieve electricity costs reductions of 20%according to [15] and up to 29% as reported in [26].By contrast, other studies indicate moderate savings, ranging from 2.4% to 11.8% as documented in [16].The reported reductions vary across studies in terms of scope and metrics, while some research emphasizes planning and loadshifting potential rather than direct cost savings [29],which limits cross-comparability between findings.
The literature on microgrids and smart grid development in Sub-Saharan Africa has expanded significantly.For instance, ref [1] estimate the cost of a rural off-grid solar PV project in Nigeria and demonstrate that such off-grid solutions are often economically unviable when compared to traditional on-grid contracts, which benefit from government subsidies.In contrast, ref [30] assess the impact of PV-diesel hybrid systems on the Nigerian private sector, finding that these systems can lead to improved reliability and notab le cost savings.A study by[31] found that load-shifting strategies in off-grid solarpowered microgrids can reduce peak demand by 24% in a case study of rural electrification in Tanzania.In a related context, ref [32] reviews optimization programs for hybrid off-grid microgrids in rural Sub-Saharan Africa,emphasizing the importance of long-term viability, affordability, and social acceptance.Meanwhile, ref [33] quantifies the impact of subsidies on the optimal design and affordability of microgrids, highlighting their critical role in ensuring equitable access to electricity.
While the majority of research has focused on rural off-grid electrification, there remains limited attention to the development of off-grid microgrids in urban areas.Ref[8] investigated mini-grid and stand-alone systems to assess the costs associated with urban and rural electrification in SSA, as well as their projected development by 2030.Similarly, ref [34] examined the relationship between grid extension solutions and off-grid modes of electricity access in SSA urban and rural areas, while also reviewing the state of knowledge regarding urban electric hybridi sation.However, these analyses do not address Demand Response, demand-side management, or their impacts at the household or community level.
Despite technological advancements, socio-economic factors, which play a critical role in shaping Demand Response participation, remain underrepresented in the literature.Most studies adopt a primarily technical focus,emphasizing operational efficiency, the integration of renewables, and the incorporation of Demand Response,while paying only partial attention to user welfare.Only a limited number of works addresses behavioral parameters that encourage households to reduce electricity consumption by explicitly modeling user discomfort,behavioral incentives,or the impact of community engagement.For example, [18,35,36] incorporate consumer preferences and inconvenience costs directly into the optimization process,while[37] introduces user discomfort within utility functions by modelling the trade-off between energy savings and quality of experience.Reviews and policy analyses [38-40] highlight the critical importance of social acceptance and energy justice, particularly given the acute access and affordability challenges faced by informal settlements and peri-urban areas.These sources argue that the long-term success of Demand Response and microgrid deployment depends not only on technical innovation, but also on effectively addressing socioeconomic realities and regulatory environments,especially in rapidly urbanizing regions such as Sub-Saharan Africa.
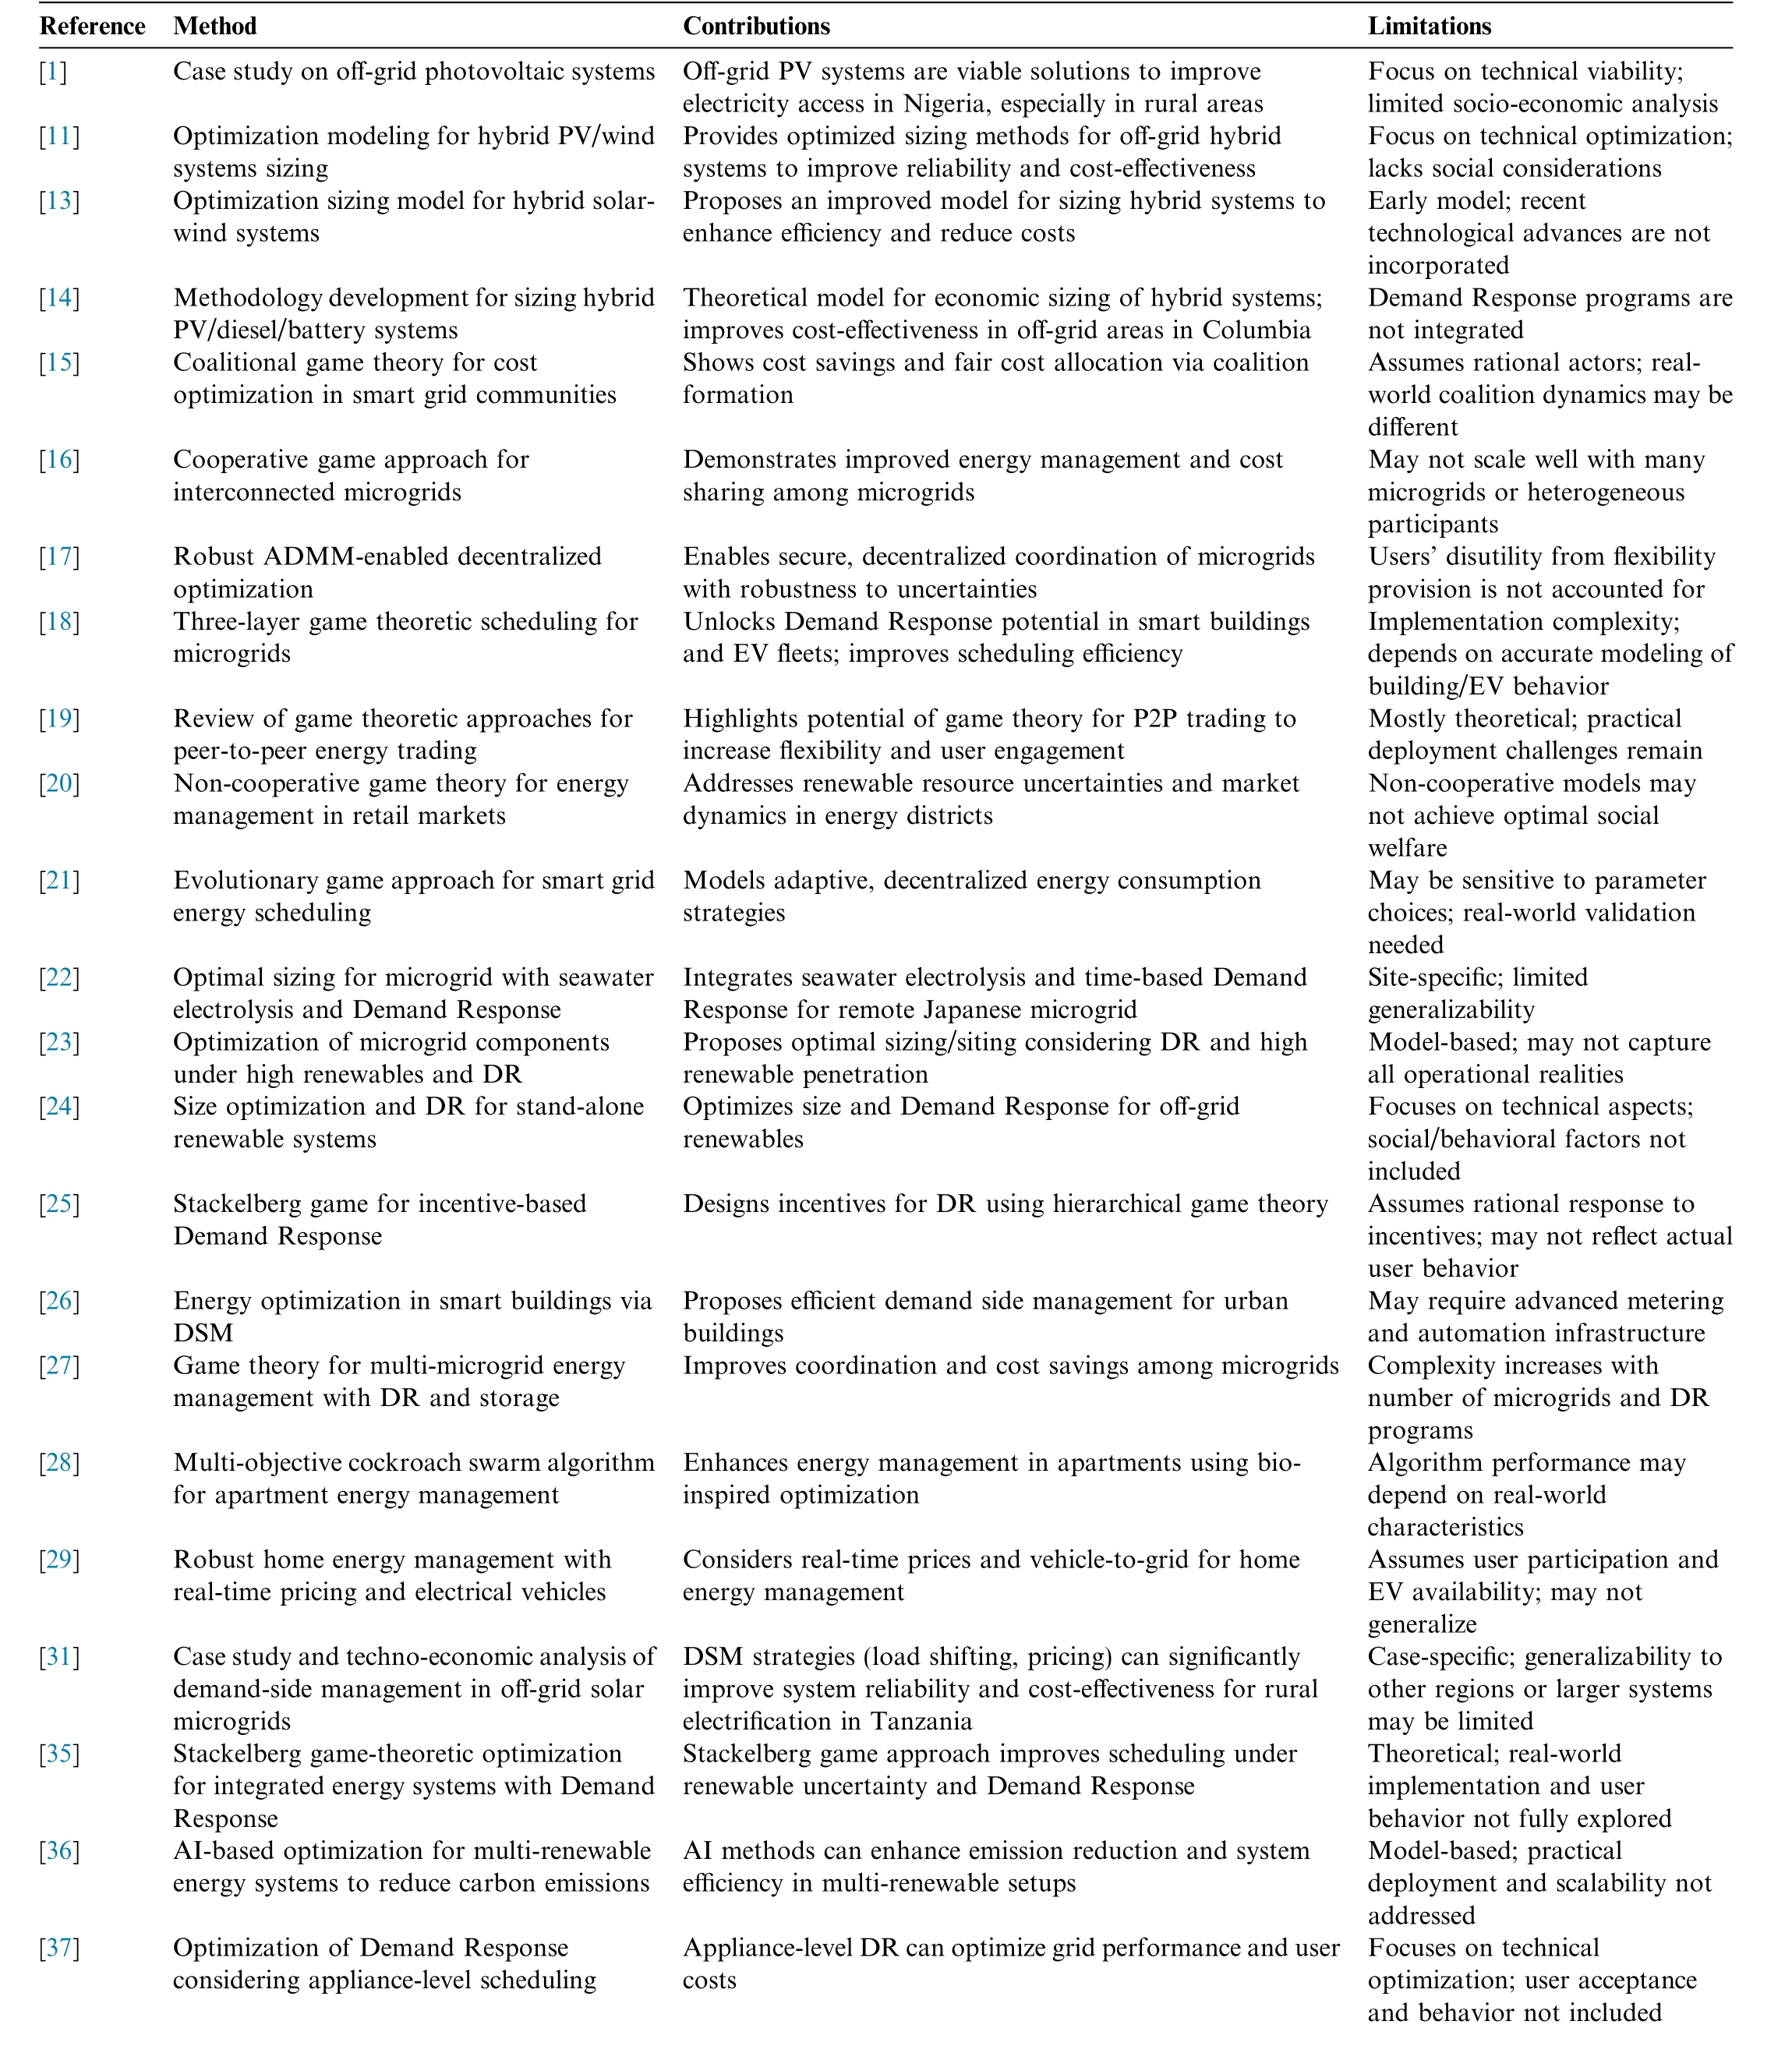
For cross-comparison, Table 1 gathers various approaches within the field of smart grids that employ game theory applied to microgrids, with particular relevance to the needs and constraints of developing countries.These approaches have been selected based on the way they integrate innovative optimization methods to enhance Demand Response,account for user behavior and discomfort, and incorporate socio-economic factors.
The success of these models is highly dependent on local context, including energy infrastructure and regulatory policies, requiring empirical evidence to adapt to the specific needs and conditions of each region.Our study is motivated by the application of game-theoretic modeling to microgrids with Demand Response, realistically applied to a developing country case study.The aim is to provide energy transition stakeholders with orders of magnitude regarding investment needs, household’s options for shifting appliance usage, and the utility company’s tari ffschemes to be implemented.
In line with the literature, this research employs game theory to investigate an urban off-grid microgrid, and develops a nonlinear bilevel optimization model.The energy system consists of solar PV panels and batteries, which together ensure a reliable electricity supply.The case study focusses on an off-grid microgrid in Gombe State, Nigeria, and the evaluation outcome is the levelized cost of electricity (LCOE).The model framework integrates household utility and socioeconomic constraints, including system cost considerations, i nto the system sizing problem.With regard to regulation and public and private financial support, the numerical results provide recommendations for implementation that align with national and regional energy policies.The following contributions to the relevant literature can be noted:
The study provides a contextualized implementation of game-theoretic models.Given the recognized limitation in data availability, significant effort has been devoted to data collection on energy consumption patterns and renewable energy resources, enabling accurate model calibration.The resulting detailed database includes hourly profiles for both sola r power potential and household electricity consumption over one-year period.
Game-theoretic models typically assume rational behavior, which may not always reflect real-world conditions.By incorporating behavioral factors, the study accounts for realistic social preferences that can influence Demand Response.The potential for demand shifting is assessed more realistically through the decomposition of household loads into specific device usage, and by considering the duration of delay for essential appliances, especially during the dry hot season, such as fans, irons and air conditioners.
By evaluating the feasibility of complex game-theoretic models under real-world constraints, this study identifies tariff conditions that optimally align with the utility’s cost recovery policy, supply-demand equilibrium,and specific socioeconomic criteria for shifting the consumption of selected household appliances.
The study carefully analyzes constraints faced by the utility in maintaining continuous supply, as well as household considerations regarding discomfort from reduced energy demand.Model findings underscore the importance of social and economic factors in the bargaining between household and the utility.The negotiation process is shown to be essential for future interactions among actors in urban Sub-Saharan Africa, as it enables for both affordable solar microgrids and efficient allocation mechanisms.
Table 1 Comparative studies dedicated system optimization, grid managemen t with Demand Response and game theory methods.
?
Table 1 (continued)

Reference Method Contributions Limitations[49] Nash-Stackelberg game for regional energy market with Demand Response Theoretical; practical implementation and user heterogeneit y not fully addressed[50] Real-time Demand Response algorithm using Stackelberg game Game-theoretic approach improves market efficiency and user participation Assumes rational actors; field validation needed[51] Game-theoretic model for optimal time-ofuse pricing Enables effective real-time DR in smart grids; leaderfollower dynamics modeled Model-based; may not capture all consumer behavior This paper Improves demand-side management and system efficiency through dynamic pricing Stackelberg game bi-level model of utility and households, with price rebates and Demand Response programs Leader-follower dynamics modeled for PV-battery microgrid sizing in peri-urban areas in Nigeria.Discomfort accounted into household utility function Assumptions on households’willingness to curtail loads; field validation needed
The remainder of the study’s structure is as follows.Section 1 describes the urban off-grid MG and the components of the energy system.Section 2 presents the mathematical formulation of the optimisation problems for s ystem sizing.Section 3 discusses simulation results in terms of case study model performance, followed by sensitivity analysis.Section 4 ends with policy recommendatio ns.
1 Case study
Solar energy is important in Africa, and SSA, in particular, receives the most sunlight, solar irradiation and warm weather (25-28 °C).Nonetheless, solar power deployment remains insignificant in the energy mix.Africa has only 5 GW of installed solar PV capacity, accounting for less than 1%of the world’s installed capacity.According to the IAE’s Africa case scenario, solar PV will become the continent’s largest electricity source,surpassing hydropower and natural gas[6], with the rapid expansion of both grid-connected and off-grid microgrid systems.Electrification progress has been made in recent years through grid extension, which has been triggered by factors such as population density and high long-term demand and pea k loads.Currently, stand-alone solar PV or off-grid microgrid systems are supplementing central grid extension,particularly in rural SSA[8].Building microgrids could accelerate access to electricity, as 100,000-200,000 microgrids could provide electricity to approximately 140 million rural Africans by 2040 [41].
The case study is a microgrid in Gombe state, located in North-East Nigeria, which has the lowest electricity access rate (26%) and the highest average poverty rate (76%)among the country’s six geopolitical zones.
1.1 Resource estimation
The solar energy potential in Gombe is estimated using the open-access database tool, Renewables ninja, developed by Imper ial College London and Energy and Technology Policy Group ETH Zu¨rich,1 https://www.renewables.ninja/. where the timestep is the hour and the outcome of power output is determ ined by weather conditions at each geospatial coordinate.We choose a solar PV panel with a nominal power rating of 1 kW, a 180°azimuth orientation, no solar tracking system and a tilt of 35°.The variability of the solar energy profile is deterministic in this case [42], whereas stochastic methods could be used to obtain random variability [43].The estimated solar PV output profile is used as an input to determine the optimal size of the off-grid solar PV/battery system.Fig.1 shows a PV output profile of 1 kWp power and 1508 kWh of power generation per year, with peaks of 0.8 kW during the dry season (from November to March)and 0.5 kW during the wet season(from April to October).
1.2 Load demand assessment
In SSA, the average annual power consumption per capita ranges from 50 kWh in rural areas to 200 kWh in urban areas[5].The residential demand in Nigeria is based on loads collected in 2016 [44], where the aggregated load is determined using a bottom-up approach that takes into account parameters such as the number of households,appliance categories and number, a ppliance power rating and the operating time and time windows for each urban and rural household type.As ref[44] assumed similar load characteristics for typical weekdays and weekends, the 52 weeks (weekdays and weekends) are considered representative of the hourly load demand [45].
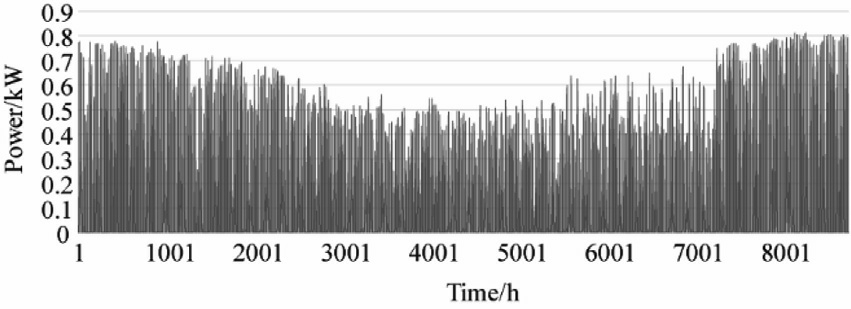
Fig.1.Hourly PV power generated over one year (Source: based on Renewables ninja).
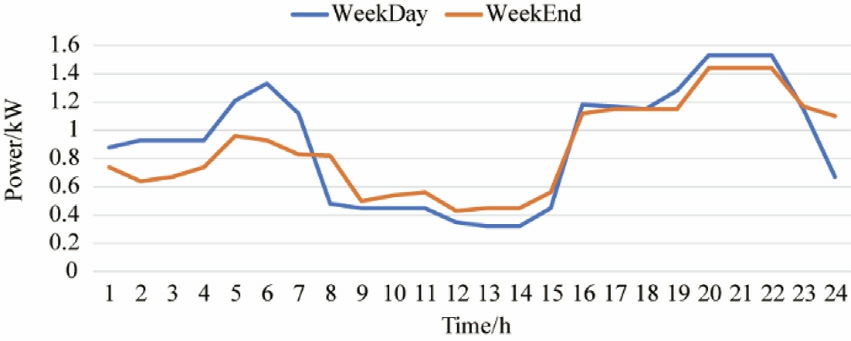
Fig.2.Urban household daily load profile over a typical weekday and weekend [44].
The weekly loads are then transformed into a representative load profile for a household by taking demographic characteristics into account (average household size in urban area, urban population ratio in total population).This is then converted into a load profile for a community of 10 households,which corresponds to the size of our off-grid system’s electricity demand.We assume that the average size of an urban household is five people, which is consistent with figures from the Nigerian National Bureau of Statistics,and that the urban population accounts for 48%of the total population[46].Fig.2 depicts a daily load profile for an urban household, with blue and red lines representing weekday and weekend loads, respectively.A 10-household community’s total daily power consumption is 22 kWh per weekday (20 kWh per weekend day), with a maximum peak of 1.53 kW (1.44 kW in the weekend).
Further, the electricity demand is categorised by appliance, which represents basic energy serv ices as defined by the [6]2 Basic energy services include electricity services (e.g.several light bulbs, phone charging, a radio, a fan or television) and modern clean cooking facilities and fuels (e.g.natural gas, liquefied petroleum gas,electricity, bioethanol and biogas systems and improved biomass cookstoves). : air conditioner, electric fan, cooking, audiovisual,electric iron, lighting and others (cold appliances, cloth dryer and washing machine).Appendix A shows the annual electricity demand for each appliance and indicates that the three largest consumer appliances are air conditioners, electric fans and lighting.In anticipation of the Demand Response, we investigate the device type th at may result in recovered or increased load, following a DR event.
When an appliance cannot delay or shift its use at a later time, it is said to have non-recovery load characteristics.We divide devices into two categories: type 1 (lighting, cooking,audiovisual and electric irons, which account for 36% of annual electricity demand) and type 3 (air conditioner and electric fan, which account for 62% of the total, mainly due to the tropical climate in Nigeria, where temperature and humidity vary by season, i.e.dry or rainy).All type-3 devices, as well as an electric iron from the ty pe 1 class,are eligible for power consumption shifting.It should be noted that the type 2 devices(washing machine,dishwasher and electric vehicle) mentioned in [44] are not common in our representative household and th us are not included.
2 Problem formulation
2.1 Cost of system components
Various economic criteria (life cycle cost, total annualised cost and level ized cost of energy) are used in the literature on decentralised energy system sizing [11].The annualised cost of the system(Eqs.(1)-(9)) and the LCO E(Eq.(10)) are the financial criteria used in this study to determine the off-grid system design:

Variables CC, OM and RC are the capital investment cost, annual operation and maintenance cost and replacement cost, respectively.The off-grid system consists of solar PV panels and battery storage, which are denoted by the subscripts PV and Bat.The capital recovery factor,CRF(d,L)is the present value of an annuity that depends on the real interest rate(d)and the project lifetime,L[14]:
The initial cost is converted into an annual cost with the CRF formula, where the annual cost of solar PV and battery is the first term in Eq.(1).
Costs of PV panels for investment and annual operation and maintenance are given in Eq.(3) and Eq.(4):

where cpv[€/kWp] denotes the PV cost per kilowatt peak,Kpv [kWp] is the capacity of PV and φpvis the fraction of PV OM cost in the total capital cost.We consider the lifetime of the project to be the PV panel’s technical lifetime,i.e.20 years.Thus,the replacement cost is zero![]() because the PV panel does not need replacement.
because the PV panel does not need replacement.
Costs of battery storage is given in Eq.(5), where cb at [€/kWh] is the cost per unit of battery and Kbat [kWh] is the batte ry capacity.The operation and maintenance cost per year is given by Eq.(6), where φ batis the percentage of the batte ry OM cost in the total cost:
When the battery lifetime (5 years) is lower than the project duration (20 years) , the cost of replacement becomes the following [16]:
where γbatis the derate factor of the initial battery capital cost, and the![]() the single payment present value as follows:
the single payment present value as follows:

Lb is the lifetime and y the number of replac ements of the battery:
The LCOE [€/kWh] is calculated by dividing the total system cost (acquisition cost, operation and maintenance cost and replacement cost) by the annual energy generated.Becau se energy is curtailed and thus not consumed in off-grid systems, the LCOE cannot be calculated as the cost per kWh generated [47]; therefore, we calculate the LCOE as the total cost per kWh energy consumed,  [14,24]):

2.2 Optimization problem
The model determines the optimal size of the off-grid project, with the goal of minimising total system cost, such as ensuring that the microgrid supplies power and meets demand at all hours of the year.Two main scenarios are evaluated based on historical sizing (HS) and undersizing(US), as shown at Fig.3.
The first scenario (HS) serves as the reference or benchmark case for system sizing, determining the capacity of solar panels and batteries.The second scenario (US)involves downsizing the off-grid system by incorporating DR programs, including load reduction for eligible appliances.By integrating the strategic interactions between the utility and households, two tests are generated: without game (US-NG) and with game (US-G).The technical potential to reduce the load is assessed in the absence of the game,whereas in the presence of the game,the technical potential is constrained by the household utility function and the socio-economic parameters to reduce the load.
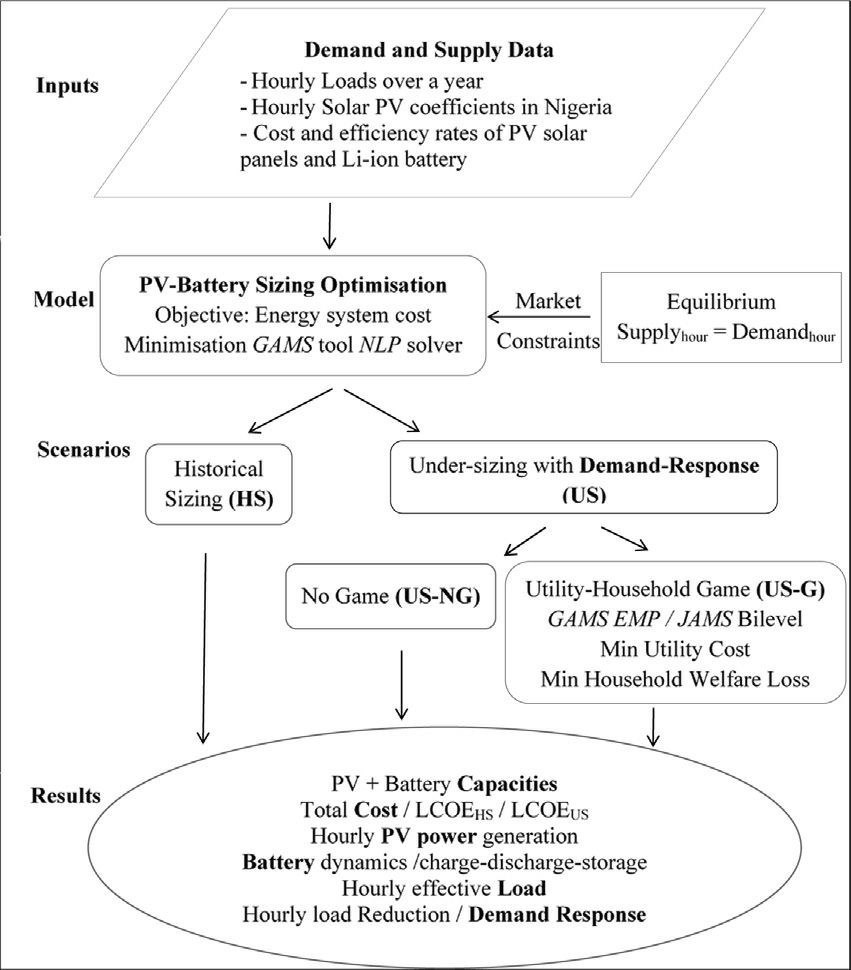
Fig.3.Flowchart of the off-grid system sizing problem methodology.
The optimisation models for the HS and US-NG scenarios are writt en in GAMS and solved using the CONOPT solver [48].The US-G scenario is expressed as a bilevel programming problem, which is solved using the general Extended Mathematical Programming(EMP)syntax and the JAMS solver.
The input data comprise hourly load profiles, technical parameters for the PV panel and battery and economic preferences for curtailment and disutility compensation.The solar panel and battery capacities, effective demand and load curtailment are the decision variables.The output is the total annualized cost of the energy system and the LCOE, which is the average cost paid by households.
2.2.1 Historical sizing scenario
The HS scenario determines the optimal PV and battery capacity by minimising total system cost(Eq.(11)) subject to constraints(Eqs.(12)-(27)).It should be noted that the term ‘system cost minimisation’ refers to a utility acting as a benevolent social planner, aiming to reduce consumer bills by optimally sizing the energy project, thereby lowering investment costs:

Constraints Eqs.(12)-(17) include equations introd uced at Section 2.1, as foll ows:
The capital recovery factor of PV solar panels and battery:

The investment cost of PV panels and batteries,respectively:

The cost of battery replacement:

The cost of operation and maintenance of PV panels and batteries, respectively:

The LCOE is the ratio between the total annualized cost of the off-grid system and the sum of the hourly historical energy demand over the year![]()


Eq.(20) defines the solar potential![]() which at each hour should be higher than the solar power consumed by households and by the battery while charging:
which at each hour should be higher than the solar power consumed by households and by the battery while charging:
The solar power in excess is either consumed, charged or wasted![]() when the battery attains the storage limit:
when the battery attains the storage limit:
Eqs.(22)-(27) include the storage dynamics and physical co nstraints of the battery:
where![]() is the charging power efficiency.The initial stored energy is equal to the final state at the end of the operation horizon:
is the charging power efficiency.The initial stored energy is equal to the final state at the end of the operation horizon:
The battery is charging, dischar ging or unused:
Constraint (25) specifies the upp e r![]() and lower
and lower![]() bounds of the battery state of charge:
bounds of the battery state of charge:
Eqs.(26) and (27) are charging and discharging power constraints related to battery capacity, respectively:

As the main decision variables, the optimisation problem returns the total capacity of the PV pan e l (Kpv) in kWp, the total capacity of the battery (Kbat) in kWh and the LCOE in €/kWh.
2.2.2 Undersizing scenario
The undersizing scenario (US) introduces the DR program in the historical case and includes the case without game (US-NG) and with game (US-G).
Undersizing without game (US-NG) minimises a new system cost subject to similar constraints as in the historical case and to new constraints related to curtailment:

A new power demand is formulated at Eq.(29) (eh),derived from the historical power demand net of the power curtailed at ratio θ(Eq.(30)).Numerically, θtakes two values: 0.3 for DR with shifting involving only appliances such as irons, fans and air conditioners, and 0.7 for DR without shifting involving only lighting, cooking and audiovisual.
Eq.(31) describes the DR program, and ω indicates the annual load reduction rate, which is 5% of total annual historical energy demand and 10% in a more ambitious case.

The average cost of the energy system resul ts from PV panels-battery resizing:
Undersizing with game (US-G) describes the game with a bilevel problem by relating the amount of load that households are willing to reduce, to their welfare function and to a new (lower) price of electricity set by the utility.Undersizing with game describes a non-cooperative Stackelberg game, wherein the utility is the leader and the household is the follower [49,50].
The objective function (Eq.(33)) and constraints (12)-(27) and (31) for utility definition are similar to those defined in the US-NG case:

The upper-level (Eqs.(33) and (34)) corresponds to the utility problem, while the lower-level (Eqs.(35)-(37)) corresponds to the household program.Constraint (35)defines the household’s objective function, which is a disutility with two parts: the first part (p 2eh) represents the cost of purchasing energy, where ehis the effective electricity demand and p2is the unit sale price of electricity, which is equal to the LCOE defined in Eq.(34); the second part![]() is considered to express the household’s dissatisfaction related to load curtailment [51], with parameters α as the elasticity of demand to electricity price and βas the willingness to curtail the load.
is considered to express the household’s dissatisfaction related to load curtailment [51], with parameters α as the elasticity of demand to electricity price and βas the willingness to curtail the load.

Eqs.(36) and (37) are equivalent to Eqs.(31) and (32):

2.2.3 Data calibration
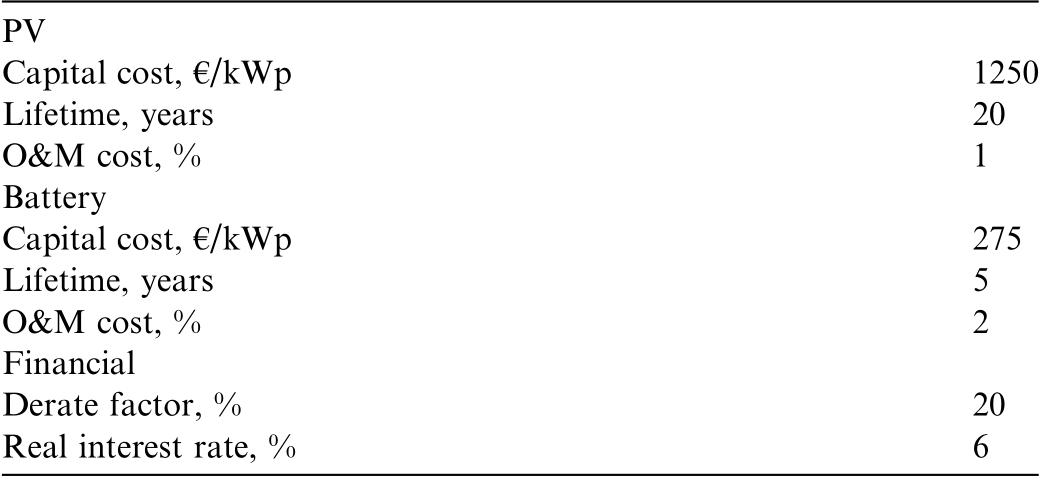
The power generated by PV system, included in data initialisation, is obtained from the Renewable Ninja website by indicating the capacity of 1-kWp PV array and geographical location-specific data.The hourly load profile of the 10-household community depicted in Fig.2 contains data on power demand.The energy system consists of a silicium polycrystall ine cell PV module and a lithium-ion battery (Table 2).Lithium-ion was chosen because it outperforms other systems in terms of maturity, lifetime,energy density, self-discharge and cost [45,52].
Demand flexibility is achieved through the load curtailment program, which applies to devices that can delay their consumption (iron, air conditioner and fans),accounting for 70% of the total demand,and to appliances that cannot postpone their consumption (cooking, audiovisual and lighting), accounting for 30% of the total demand.
3 Results and discussion
We first size the off-grid microgrid so that the historical load is met.Then DR applies so that the household reduces the load at an annual rate of 5% of the total demand, and 10%, alternatively.This corresponds to the technical ability to achieve these rates without game (Section 3.1) and with game(Section 3.2).Lastly, cost sensitivity tests apply to financial parameters (Section 3.3).
Table 2 Technical cost and lifetime parameters of the system components[45,53].
PV Capital cost, €/kWp 1250 Lifetime, years 20 O&M cost, % 1 Battery Capital cost, €/kWp 275 Lifetime, years 5 O&M cost, % 2 Financial Derate factor, % 20 Real interest rate, % 6
3.1 Optimization results for scenario undersizing without game(US-NG)
The model, run for the historical scenario, returns capacities of PV panel of 12 kWp and battery of 26 kWh for a total cost of 38,420 €and LCOE of 0.31 €/kWh(Table 3).The case is unaffordable for most Nigerian households living in the studied area, because the tariff rate of this off-grid microgrid is 69% higher than a gridconnected rate (around 0.095 €/kWh); therefore, in order to reduce the overall cost, we undersize the PV system by testing the DR strategy.
Resizing the microgrid demonstrates that reducing the demand by 5% significantly reduces energy system costs:with DR, but without shifting the load, PV and battery capacities are reduced by one-third and costs are reduced by 35%; when shifting is considered, variations are lower(15%).Surprisingly, DR calibrated at 10%, without shifting, does not change the behaviour expected at 5% load curtailment, indicating that the potential limit to shave peaks is reached at 5%.This potential is further exploited when shifting applies because the size of the energy system is reduced for the battery but not for the solar panel.
Load seasonality related to the weather entails variable Demand Response.With Nigeria’s tropical climate, cooling devices (electric fans and air conditioners) play an important role in household response by season.Table 4 shows the load decomposition based on a 5% annual load curtailment target for the DR programs.For DR without shifting, 266 kWh (68%) of the load is curtailed during the rainy season, compared with 127 kWh (32%) during the dry season.The targeted annual load to be curtailed for DR with shifting is also reached and dispatched as follows:226 kWh(58%)curtailed in the rainy season and 166 kWh(42%) curtailed in the dry season.
Fig.4 illustrates the periods during the year when load curtailment occurs, without shift, at a 5% annual rate(Fig.4a) and at 10% annual rate (Fig.4b), and with shift(Fig.4c, Fig.4d).We notice that the load is curtailed more frequently during the rainy season than during the dry season: the curtailment occurs more frequently be tween the 3000th and 7200th hours without shifting assumptions and between the 3000th and 7900th hours with shifting.
To illustrate this, let us consider three days for each season.Figs.5 and 6 compare the load for the historicaldemand during the dry season (e.g.December) and the rainy season (e.g.June).Whatever the DR program is,with or without shifting, the rainy season has more load curtailed than the dry season, with different peak periods smoothed out by season.Morning peaks are slightly smoothed in the DR program without shifting, while evening peaks are curtailed in magnitude rather than in duration (Fig.5b for the rainy season compared to Fig.5a for the dry season).This is explained by the fact that lighting or entertainment devices (e.g.audiovisual) or appliances with no-shifting are appropriate for shaving peaks.
Table 3 Model results of optimal sizing in historical and undersizing scenarios.

Indicator Historical sizing, HS Under-sizing, no game, US-NG Without shifting With shifting DR target/% 5% 10% 5% 10%PV/kWp 12 8.41 8.44 11.47 10.863 Battery/kWh 26 18.18 18.07 22.827 19.95 Total cost/€ 38,420 24,838 24,879 33,402 31,226 LCOE/€/kWh 0.310 0.200 0.200 0.265 0.245
Table 4 Te energy flow curtailed with the DR program at 5% annual curtailment.

Season DR without shifting DR without shifting Expected load curtailment/kWh Dry Rainy Total 393 Dry Rainy Total 393 Load curtailed/kWh 127 266 393 166 266 392 Percentage of load curtailed in the target of 5%, % 32 68 100 42 58 100
In contrast, morning peaks are significantly smoothed in the DR program with shifting (Fig.6a, b).This is due to higher humidity during the rainy season and hot and dry conditions during the dry season, which encourages the use of temperature regulating devices, such as air conditioners with a shifting need.
3.2 Optimization results for undersizing with game (US-G)
When considering the strategic interaction of utilityhousehold, socioeconomic parameters influence the technical potential to reduce the load, altering the no-game results obtained above and improving historical case figures.Interestingly, including the consumer’s willingness to reduce load as a function of the rebate on the bill,results in lower reduction in the amount of energy curtailed.This indicates that the social potential for demand flexibility is lower than the technical potential.
The DR game without shifting, at 5% annual load curtailment, returns 12% cost savings compared with the historical case, and 16% cost savings at 10% load curtailment.This has a greater impact than without game, while it has no effect in the case 5% related to 10% (US-NG without shifting at 5% versus 10%).This is primarily due to the test with game having a greater remaining potential to reduce load than the test without game.Nonetheless, the average cost remains the same (0.287 €/kWh): a 10% lower investment cost (32,149 €) over a lower volume of energy consumed (7082 kWh) is equivalent to a 10% higher investment cost (33,877 €) over a larger energy flow(7471 kWh; Table 5).
A DR game with shifting reduces the energy system size even more than a DR game without shifting, revealing a willingness to reduce the load on appliances whose consumption is postponed.Surprisingly,at 5%and 10%tests,the results with and without game do not differ at all, indicating that this case (US-Game with shifting) best reproduces the technical potential of load curtailment (US-No Game with shifting).
In terms of curtailment targets (Table 6), the DR with game at 5% is almost achieved without shifting (99%)and only partially achieved with delay (71%), demonstrating the importance that households place on appliances related to temperature comfort over other activities (fans over lighting).The remaining 1% that the household does not reduce has a significant impact on system sizing:it represents 4 kWh with peaks that require additional PV and battery when compared to the no-game case,or a cost difference of 23 points.
Fig.7 (without shifting) and 8 (with shifting) show how households choose the moment of curtailment that has the least impact on utility.Furthermore, the load reduction occurs at similar periods across seasons (dry and rainy),owing to households’ strategic decision to prioritise devices that cannot induce shifting.
Interestingly, the DR game without shifting shows that as the curtailment rate increases (from 5% to 10%), the magnitude of peak shaving decreases, particularly for the two peak periods (morning and evening peaks), which recalls the limit that the household achieves at the 5%target.
The DR game with shifting, however, has seasonal curtailment variations.Because of increased home occupancy activities and increased use of electrical appliances, mostly related to temperature regulation, hous eholds are more willing to reduce load during the rainy season than during the dry season (electric iron, fan and air conditioner;Fig.8).
Seasonally, 58% of the curtailed load was recorded during the rainy season, compared with 42% during the dry season (without shifting), and trends are similar in the case with delay, i.e.61% during the rainy season and 39% during the dry season.
To summarise, a DR program makes the energy system less expensive, but without a game, it remains a technological solution imposed on households, via for instance smart meters with norms.When a strategic game is used,load shifting could be more efficient than cutting the load following norms; however, it appears to be less efficient in terms of curtailed flows and costs than the case without game.This demonstrates how social factors (disutility due to curtailment) and economic parameters (willingness to receive for reduced consumption) affect the technical potential when only technical sizing is used.Finally,appropriate regulation would prioritise contract negotiation for flexibility through game over utility-imposed norms as they better account for households’ potential to adopt sustainable behaviour.The design of the renewable energy transition requires the participation of all actors, and DR is an important step toward decentralising the electricity service for both the household and utility,as consumer actors and new ethical utility players of the transition.
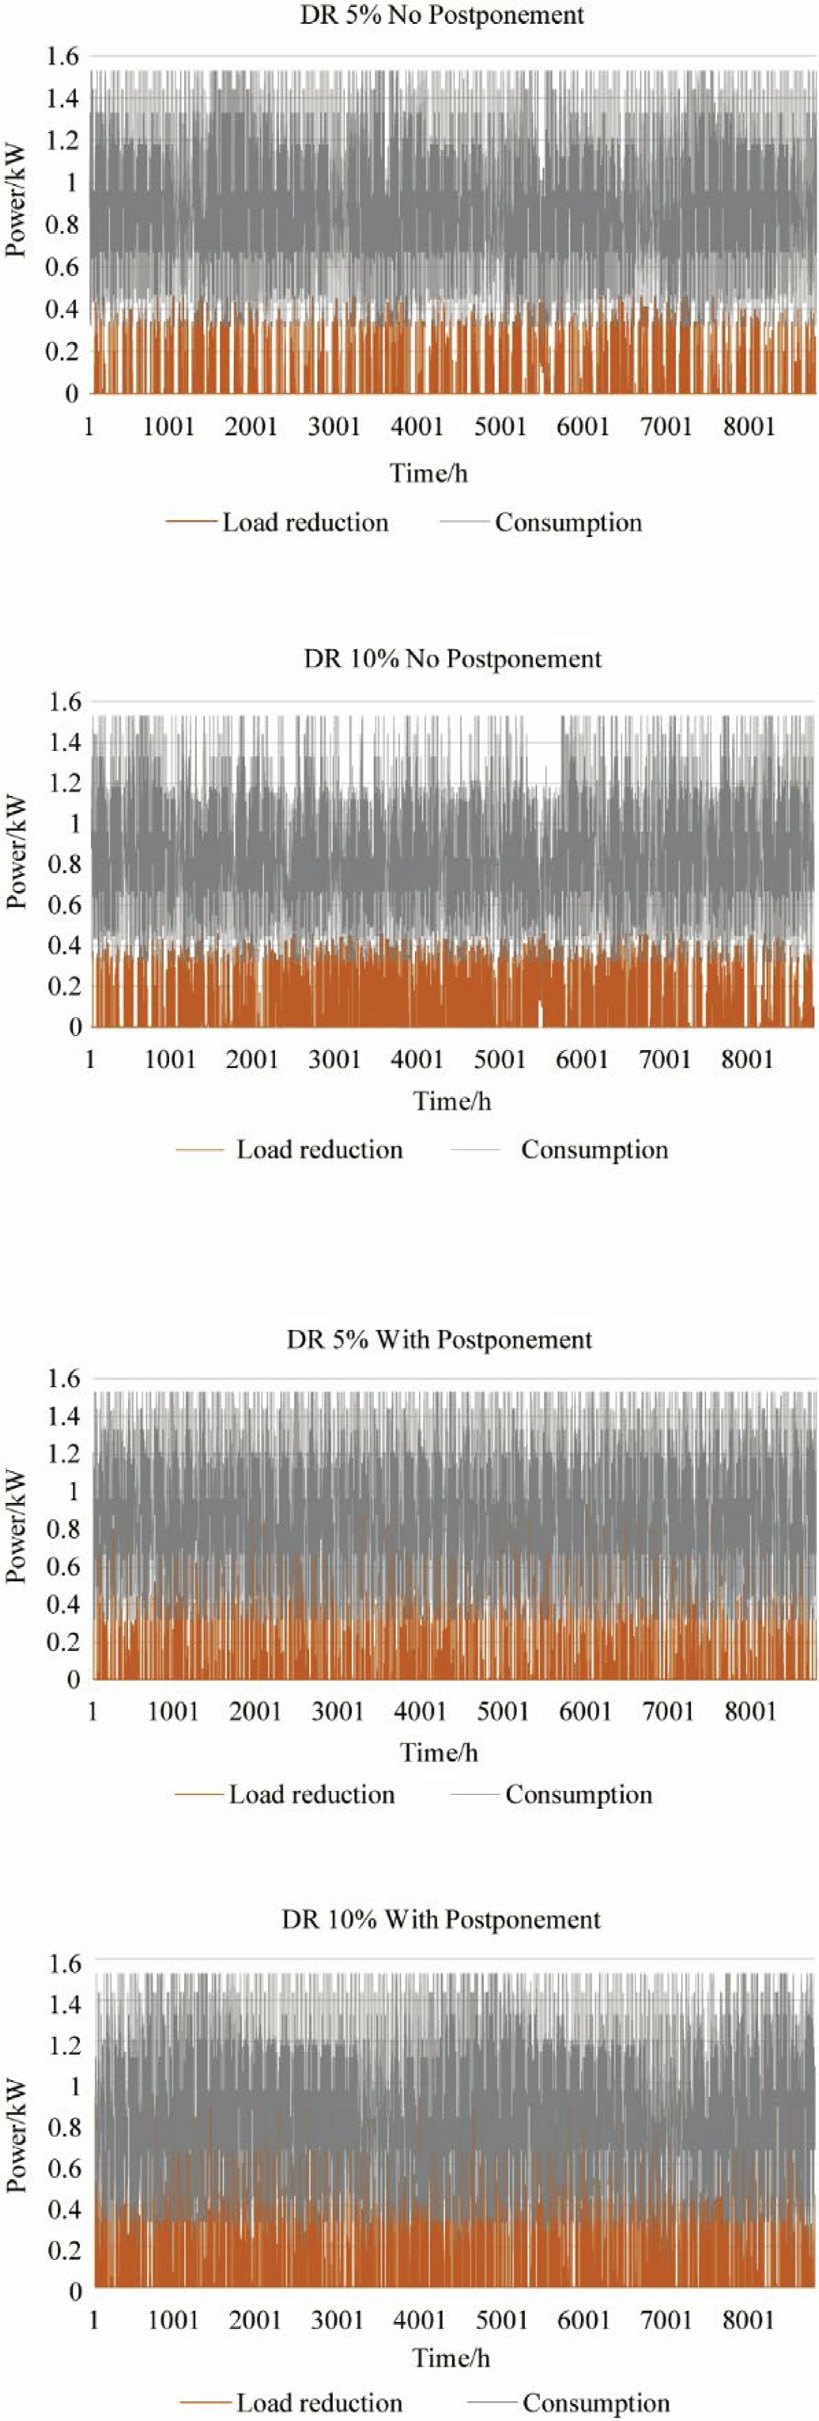
Fig.4.Expected DR occurrence over a year at 5% and 10% load curtailment tests with and without postponement option
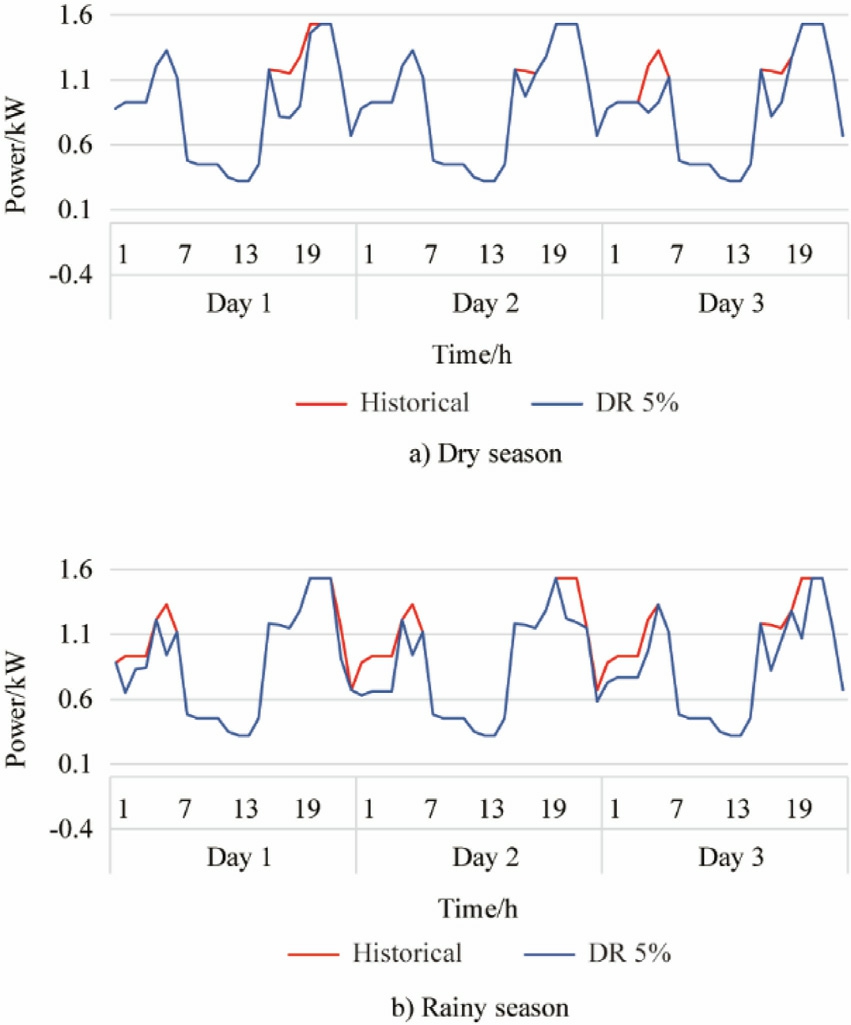
Fig.5.DR at 5% rate without shifting over three days in dry (a) and rainy seasons (b).
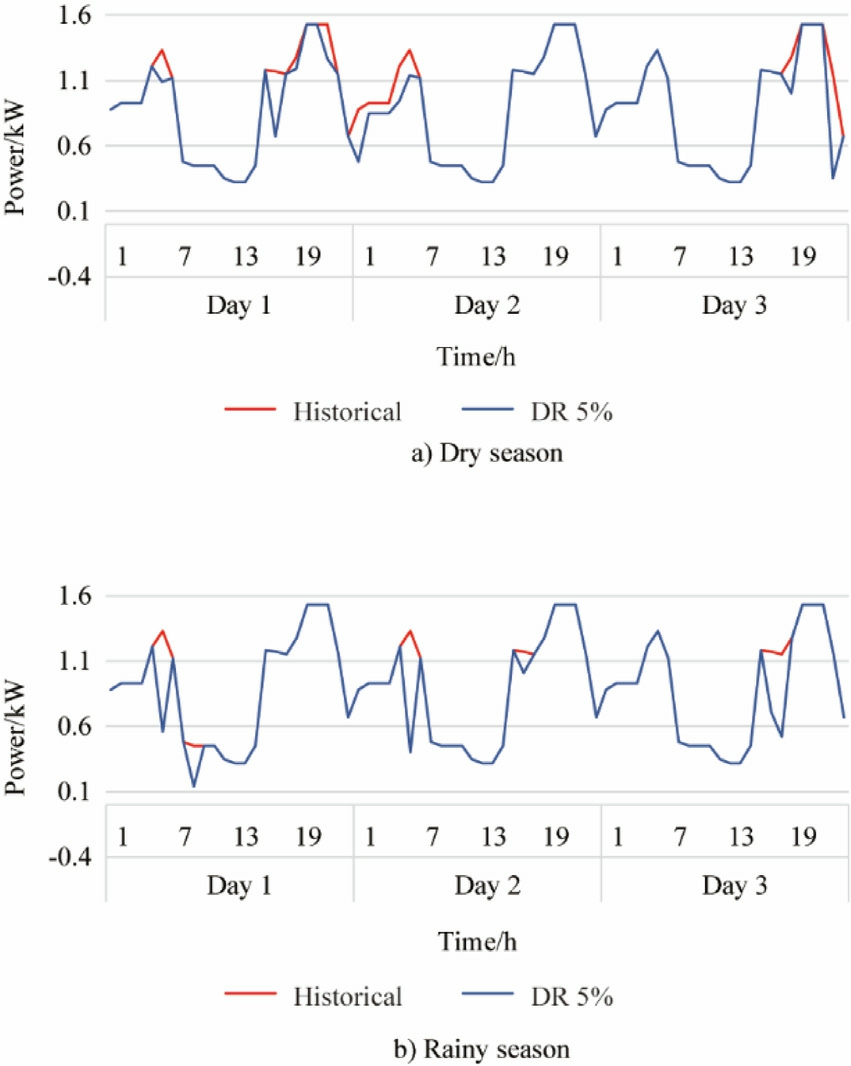
Fig.6.DR at 5% rate with shifting over three days in the dry (a) and rainy (b) seasons.
Table 5 Sizing results of the off-grid MG by scenario.

Scenario HS US-No GAME US-GAME Indicator Without shifting With shifting Without shifting With shifting DR 0% 5% 10% 5% 10% 5% 10% 5% 10%PV, kWp 12 8.41 8.44 11.47 10.86 11.48 10.89 11.47 10.86 Battery, kWp 26 18.18 18.1 22.83 19.95 24.73 23.50 22.83 19.95 Total cost, € 38,42 24,84 24,879 33,402 31,226 33,877 32,149 33,402 31,226 LCOE,€/MWh 0.31 0.20 0.20 0.265 0.245 0.287 0.287 0.279 0.272 Cost saving over HS 35% 35% 13% 18.7% 11.8% 16.3% 13% 18.7%
Table 6 The load curtailed with DR game, with and without shifting (at 5% rate).

DR without shifting DR without shifting Season Dry Rainy Total Dry Rainy Total Technical target/kWh 393 393 Load curtailed/kWh Percentage,% 165 42 224 58 389 100 111 39 172 61 283 100
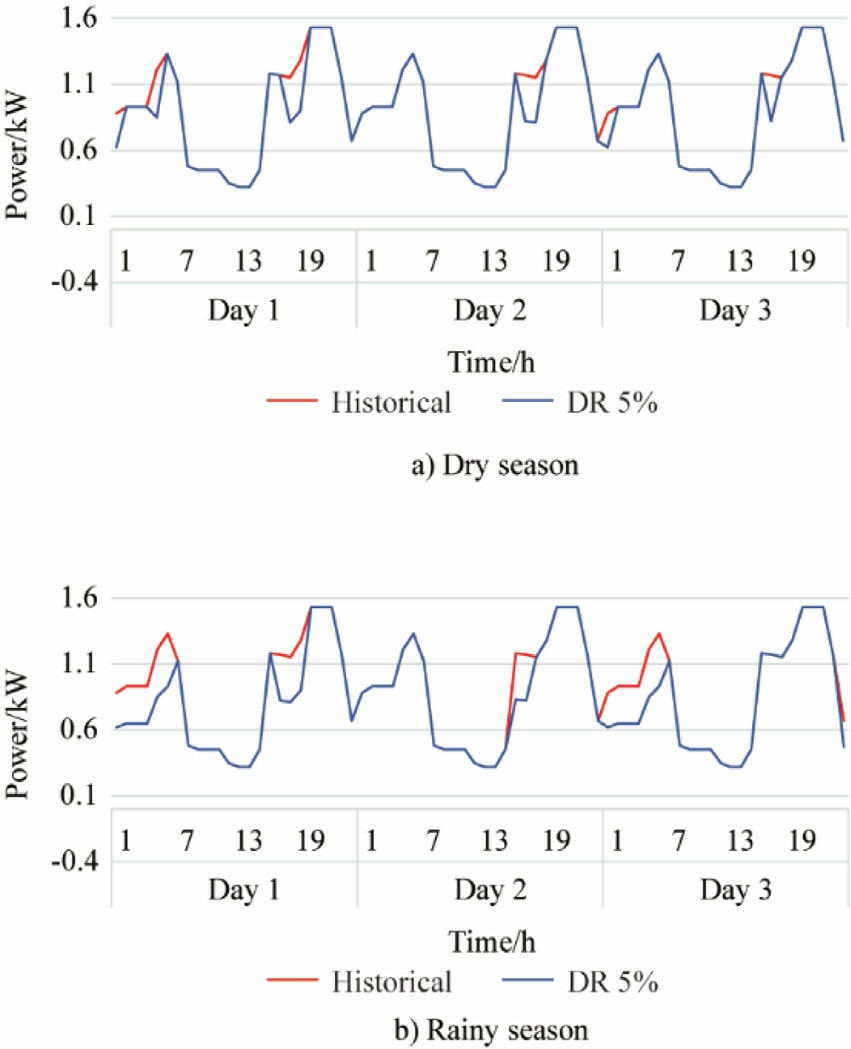
Fig.7.Load profiles in the US-G in the dry (a) and rainy (b) seasons(without shifting).
3.3 Sensitivity analysis
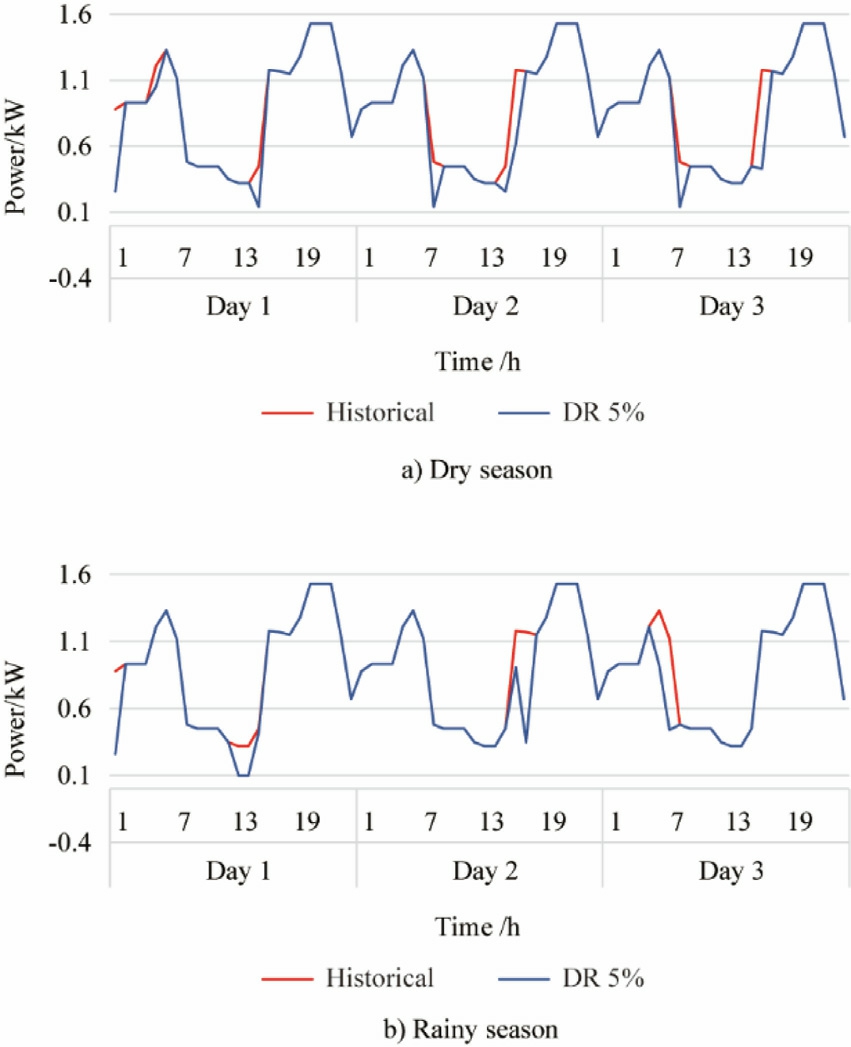
Fig.8.Load in the US-G over three days in the dry (a) and rainy (b)seasons (with shifting).
We address here the issue of high-level tariffs obtained for the off-grid microgrid to make the project appealing to both investors and beneficiary end-users.The average cost obtained in the base case is 0.31 €/kWh (143.73 N/kWh),3 Exchange rate between EURO and NAIRA used for the analysis is as follows: 1 EUR = 463.64 NGN. which most Nigerian households cannot afford without financial assistance.Currently the on-gridconnected consumers contract power at 0.095 €/kWh(43.91 N/kWh),4 The 2016 Jos Distribution Company’s tariff for residential consumers is considered.Jos Distribution Company is one of the 11 electricity supply and distribution companies in the North-East of Nigeria.For the tariffstructure see https://www.oecd.org/environment/cc/climate-futures/casestudy-achieving-clean-energy-access-in-sub-saharan-Africa.pdf. therefore sensitivity tests are performed in order to achieve new off-grid tariff rates competitive with on-grid contracts.
3.3.1 Capital subsidies
Upfront capital costs being one of the main ba rriers to microgrid deployment [33,54], we test system cost reduction at different rates of 25%, 50% and 75% of the total cost (Fig.9).Capital subsidies are granted at the end of optimisations and do not affect the system sizing, therefore the same PV and battery capacities are required, with and without subsidies.Instead, the average cost, the LCOE,paid by households falls to 0.238 €/kWh(at a 25%subsidy rate), 0.155 €/kWh (at a 50% subsidy rate) and 0.077 €/kWh (at a 75% subsidy rate), with the latter improving the on-grid rate by 19%.
3.3.2 Capital interest rate
We vary the real interest rate, which is initially set at 6%, in one-point increments between 1% and 12% to test trends found in the literature:higher interest rates increase project cost,thereby increasing the average cost,and lower interest rates reduce costs[33,58-60].Our off-grid project’s economics are highly sensitive to this parameter, as obtained with the equation of the present value of the annuity over the project’s lifetime(Eq.(2)).At a 1% interest rate, the average cost is 0.22 €/kWh, and at a 12%interest rate, the cost is 0.44 €/kWh (Fig.10).
3.3.3 Variation of battery lifetime
According to experts, lithium-ion batteries will have advantages over lead-acid batteries in the long term, such as longer lifetime, low er maintenance and a greater number of lifecycles due to technological progress [52].For the same battery and solar panel capacities, we run the test of increased lifetime from 5 to 10 years.The total cost naturally decreases as the battery is replac ed less frequently over the course of the project; however, it is less sensitive than financial parameters( 6%only of the previous cost).
4 Conclusion and policy implications
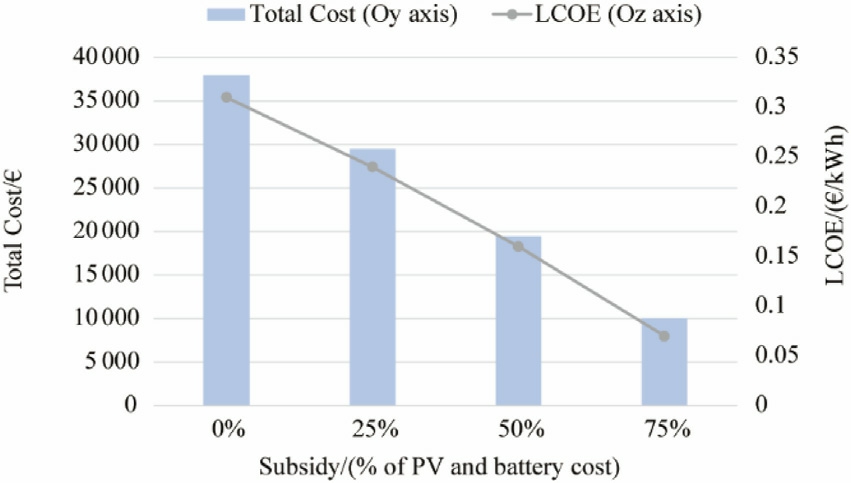
Fig.9.Impact of capital subsidies on the average cost(LCOE)and total cost.
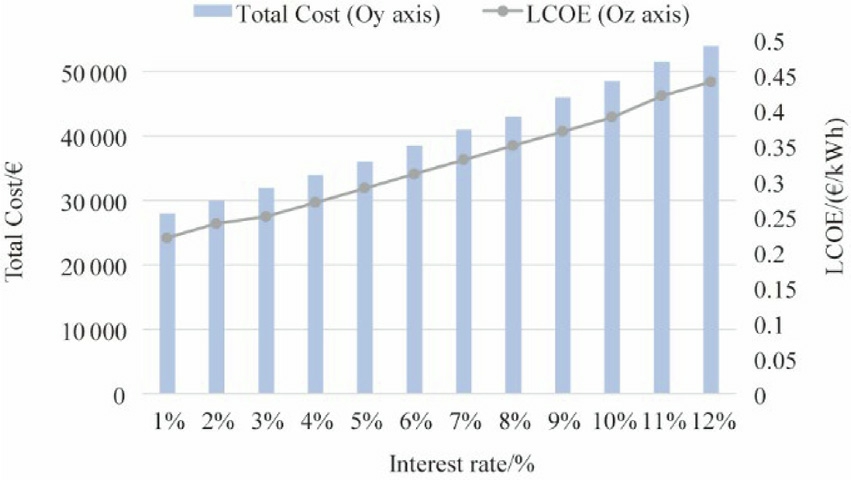
Fig.10.Impact of interest rates on the average cost (LCOE) and total cost.
Urban households in Sub-Saharan Africa facing unstable grid connections can benefit from abundant renewable sources such as solar power.However, financing issues and the development of decentralized markets remain significant challenges [4].This paper addresses the sizing and operating of off-grid solar-battery energy systems in Nigeria to provide a better understanding of solar investment design, governance models, and the potential interactions among stakeholders.Methodologically, this study integrates a body of research that fills the gap in microgrid energy management by applying game theory and Demand Response concepts to developing countries.Using a nonlinear optimization program, a bilevel model is built to frame the strategic game between the utility and households.This approach enables the evaluation of investment costs alongside welfare variations resulting from demand curtailment.Tests conducted include Demand Response options proposed by the utility to households, based on a game of tariffreductions and load curtailment commitments, with the postponment of selected household devices.
Results show that an off-grid microgrid of 10 households with an annual total demand of 7.8 MWh, requires an energy system composed of 12 kWp solar PV panels and batteries with a storage capacity of 26 kWh to reliably meet hourly demand throughout the year.The resulting tariff for this system configuration is 0.31 €/kWh, for a total investment of 38,420 € over a 20-year technical lifetime.Since this tariff is significantly higher than the market grid rate (by 69%), demand-side flexibility emerges as an effective strategy to reduce costs.By resizing the microgrid, a reduction in demand of 5% leads to a substantial decrease in energy system costs, by approximate ly one third.Tests involving demand reduction through load postponement show a more moderate effect on cost reduction (about -15%), as this approach primarily reduces batteries requirements but not the necessary capacity of solar panels.
Detailed data on seasonal solar power profiles and hourly electricity demand over the year made it possible to reveal the household preferences for demand shifting,the timing of curtailment decisions, and the prioritization of devices for power reduction.The results indicate that reducing power consumption is more effective during the rainy season than in the dry season, primarily due to increased household activities during periods of higher occupancy.The findings also demonstrate that households prioritize appliances related to temperature comfort, such as funs, over other devices like lighting.Over the course of the day, morning demand peaks are only slightly reduced,wher eas evening peaks are curtailed more in magnitude than in duration.This suggests that lighting and audiovisual devices used in the evening are particularly suitable for peak shaving strategies.
Despite the implementation of Demand Response programs, household electricity tariffs remain high at 0.2 €/kWh compared to the on-grid market tariff of 0.095 €/kWh.Since system costs are strongly influenced by financial parameters, sensitivity analyses were conducted on the impact of financial aid.These tests revealed that off-grid projects could become cost-competitive, reaching 0.077 €/kWh, but only with substantial capital subsidies covering 75% of upfront costs.Nevertheless, providing significant financial support for these energy projects could stimulate industry growth and attract investment in off-grid electrification.Such programs could be implemented by local governments, working in partnership with national and international co-financing funds.This collaborative approach would encourage private sector participation and help ensure reasonable returns on investment.
Access to reliable and affordable electricity remains a significant challenge in developing countries, especially for households in rural areas and informal urban settlements.When considering how to replicate this study in other countries, it is important to account for Nigeria’s tropical climate, which features a high humidity rainy season and hot, dry season.In such conditions, cooling devices play a crucial role in household power consumption.In particular, contracts for Demand Response should recognize that postponing the use of temperatureregulating devices, such as electric fans and air conditioners, can significantly impact comfort during periods of power curtailment.Therefore, these contracts should be designed to minimise discomfort caused by the temporary unavailability of such appliances.
The strengths of the study steam from the way it complements technological aspects of microgrid sizing with social and economic factors, such as the discomfort and household’s willingness to participate in Demand Response programs.This approach enables the design of future contracts through negociation between the utility and households.A key finding is that households are more willing to reduce their electricity usage when they are allowed to postpone the curtailed demand, rather than being required to cut their demand without the option to shift it at a later time.The study also demonstrates that economic interactions alone are less effective at reducing costs compared to direct technical control of demand cuts by the utility.This is due to the inherent trade-offbetween maximizing welfare and setting rebate rates.
Although negotiation might be time-consuming, it can offer greater flexibility by creating mutual benefits for both the utility and households, and can foster dynamic behaviors that adapt to rapidly changing energy configurations.In the future, both stakeholders are expected to play active roles in the energy transition, especially as off-grid systems face increasing demand without corresponding capacity expansion.By considering household welfare, alongside factors beyond historical power consumption, stakeholders can help buildi ng an ethical investment model that encourages sustainable, long-lasting and adaptable consumption behaviour during the transition to renewable energy.
Electrification services can help achieve broader goals such as socio-economic development, ed ucation and health[56,57].These services can also reduce cultural and technical barriers to the energy transition, including skill attributes and social acceptance.While financial assistance programs can help address economic barriers, providing full financi al support for microgrids may encourage undisciplined behaviour[8,54].For instance, project developers might oversize systems to qualify for grants, or face challenge such as corruption and the use of their counterfeit products, like lowquality generic solar panels, which stem from institutional barriers and a lack of standards for renewable technologies.To address these issues, a scheme that offers partially subsidised capital costs ti ed to the performance targets (such as the quality of power delivered)could help eliminate these strategic behaviors.
Governments and development institutions in other developing countries have implemented policy strategies to accelerate the widespread deployment of off-grid microgrid projects, aiming to expand access to sustainable electricity at the lowest possible cost[33].These policies include financial mechanisms such as subsidies for capital and operating costs, as well as non-subsidy incentives l ike tax breaks,loan guarantees, partial risk guarantees, and concessions [54,55].
Government financial support for energy initiatives is a cornerstone of the ‘Nigeria Electrification Project’, a collaborative effort led by the Nigerian government, the World Bank and other international partners as the German Agency for International Cooperation and the African Development Bank.The program incentivizes private-sector participation in developing and operating economically viable microgrids through mechanisms like capital expenditures subsidies, competitive subsidy tenders, and performance-based grant schemes.Its goal is to deliver electricity to one million Nigerian households,public educational institutions and underserved micro-, small and medium-sized businesses [55].These subsidies cover 50%-75% of total capital expenditures, aligning closel y with the rates tested in our analysis.
Future work will investigate the strategic game within energy communities by considering heterogeneous, rather than homogeneous, participants.It will also address contractual provisions for deviations, such as periods where households might reject load curtailment requests.Further research is needed to better understand future electricity loads as the number of household appliances increases,as well as stochastic forecasting of both hourly demand and solar power generation profiles.Additionally, more studies are required to explore the indivi dual behaviour in relation to social factors influencing real-time electricity consumption,and how people respond to price signals and information, for example by actively participating in system sizing and maintenance.
CRediT authorship contribution statement
Racine Diatta: Writing - original draft, Investigation,Conceptualization, Methodology, Data curation, Software, Formal analysis.Rodica Loisel: Validation,Resources, Investigation, Writing - review & editing,Supervision, Project administration, Funding acquisition,Conceptualization, Software, Methodology, Formal analysis. Lionel Richefort: Supervision, Formal analysis,Methodology, Writing - review & editing, Investigation,Conceptualization.
Declaration of competing interest
The authors declare that they have no known competing financial interests or personal relationships that could have appeared to influence the work reported in this paper.
Acknowledgment
We appreciate the financial support from Nantes Universite´ through the project AAP II GENOME (Gestion des Energies Nouvelles et Optimisation Electrique)and LEAP-RE MiDiNa project, grant N° ANR-23-LERE-0002-01.
Appendix A
Table A1 Share of electric appliances [44].
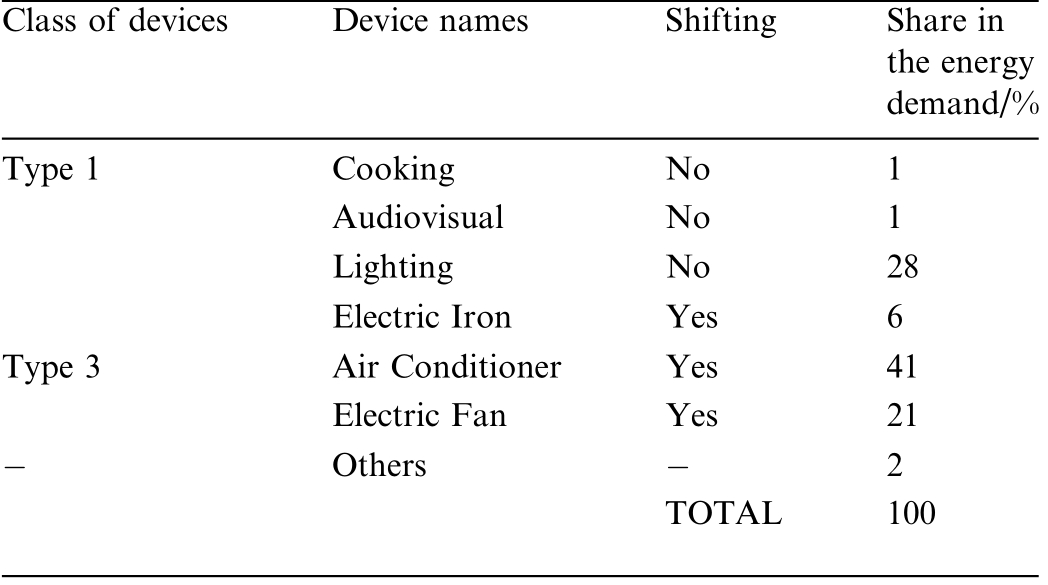
Class of devices Device names Shifting Share in the energy demand/%Type 1 Cooking No 1 Audiovisual No 1 Lighting No 28 Electric Iron Yes 6 Type 3 Air Conditioner Yes 41 Electric Fan Yes 21 Others 2 TOTAL 100
References
-
[1]
U.S.Akpan, S.R.Isihak, Y.O.N.Udoakah, Electricity access in Nigeria: viability of off-grid photovoltaic system,in:2013 Africon,IEEE, 2013, pp.1-8. [百度学术]
-
[2]
O.Gandhi, D.Srinivasan, Introduction, in: Sustainable Energy Solutions for Remote Areas in the Tropics, Springer Nature, 2020,pp.1-8 (Chapter 1). [百度学术]
-
[3]
B.Pillot, M.Muselli, P.Poggi, J.B.Dias,Historical trends in global energy policy and renewable power system issues in sub-Saharan Africa: the case of solar PV, Energy Policy 127 (2019) 113-124. [百度学术]
-
[4]
IEA, Energy poverty - how to make modern energy access universal.IEA-OECD, 2010. [百度学术]
-
[5]
M.Hafner, S.Tagliapietra, L.De Strasser, Energy in Africa:Challenges and Opportunitie s, Springer Nature, 2018. [百度学术]
-
[6]
IEA, International Energy Agency, Africa energy outlook, 2019. [百度学术]
-
[7]
D.A.Quansah, M.S.Adaramola, L.D.Mensah, Solar photovoltaics in sub-Saharan Africa-addre ssing barriers,unlocking potential, Energy Procedia 106 (2016) 97-110. [百度学术]
-
[8]
A.G.Dagnachew, P.L.Lucas, A.F.Hof, D.E.H.J.Gernaat, H.S.de Boer, D.P.van Vuuren, The role of decentralized systems in providing universal electricity access in Sub-Saharan Africa-a model-based approach, Energy 139 (2017) 184-195. [百度学术]
-
[9]
World Bank, World Bank Enterprise Surveys, Technical report,World Bank, 2019. [百度学术]
-
[10]
M.Kojima, R.Bacon, C.Trimble, Political Economy of Power Sector Subsidies: A Review with Reference to Sub-Saharan Africa,World Bank Group, 2014. [百度学术]
-
[11]
A.Kaabeche, M.Belhamel, R.Ibtiouen, Sizing optimization of grid-independent hybrid photovoltaic - wind power generation system, Energy 36 (2) (2011) 1214-1222. [百度学术]
-
[12]
R.Siddaiah, R.P.Saini, A review on planning, configurations,modeling and optimization techniques of hybrid renewable energy systems for off grid applications, Ren.Sustain.Energy Rev.58(2016) 376-396. [百度学术]
-
[13]
H.Yang, L.Lu, W.Zhou, A novel optimization sizing model for hybrid solar-wind power generation system, Sol.Energy 81 (1)(2007) 76-84. [百度学术]
-
[14]
A.O.Arraez-Cancelliere, N.Mun˜oz-Galeano, J.M.Lo´pez-Lezama,Methodology for sizing hybrid battery-backed power generation systems in off-grid areas, Wind Solar Hybrid Ren.Energy Syst.(2019). [百度学术]
-
[15]
A.Chis, V.Koivunen, Coalitional game based cost optimization of energy portfolio in smart grid communities, IEEE Trans.Smart Grids 10 (2) (2019) 1960-1970. [百度学术]
-
[16]
M.Movahednia, H.Karimi, S.Jadid, A cooperative game approach for energy management of interconnected microgrids,Electr.Power Syst.Res.213 (2022) 108772. [百度学术]
-
[17]
S.A.Mansouri, E.Nematbakhsh, A.Ramos, A robust ADMMenabled optimization framework for decentrali zed coordination of microgrids, IEEE Trans.Ind.Inf.21 (2) (2025). [百度学术]
-
[18]
S.A.Mansouri, A.Paredes, J.M.Gonzalez, J.A.Aguado,A threelayer game theoretic-based strategy for optimal scheduling of microgrids by leveraging a dynamic Demand Response program designer to unlock the potential of smart buildings and electric vehicle fleets, Appl.Energy 347 (2023) 121440. [百度学术]
-
[19]
W.Tushar, C.Yuen, H.Mohsenian-Rad, et al., Transforming energy networks via peer to peer energy trading:potential of game theoretic approaches,IEEE Signal Process Mag.35(2018),https://doi.org/10.1109/MSP.2018.2818327. [百度学术]
-
[20]
M.Marzband, M.Javadi, J.L.Domı´ nguez-Garcı´a, M.M.Moghaddam, Non-cooperative game theory based energy management systems for energy district in the retail market considering DER uncertainties, IET Gener.Transm.Distrib.10(12) (2016). [百度学术]
-
[21]
Z.Zhang, H.Liu, Non-cooperativ e energy consumption scheduling for smart grid: an evolutionar y game approach, ICNC-FSKD 2020.Lecture Notes on Data Engineering and Communications Technologies, Springer, Cham, 2021. [百度学术]
-
[22]
M.M.Gamil, M.Sugimura, A.Nakadomari ,et al.,Optimal sizing of a real remote Japanese microgrid with sea water electrolysis plant under time-based Demand Response programs, Energies 13(14) (2020) 3666. [百度学术]
-
[23]
S.M.Hakimi, A.Hasankhani, M.Shafie-kh ah, J.P.S.Catala˜o,Optimal sizing and siting of smart microgrid components under high renewables penetration considering Demand Response, IET Renew.Power Gener.13 (10) (2019) 1809-1822. [百度学术]
-
[24]
A.Chauhan, R.P.Saini, Size optimization and Demand Response of a stand-alone integrated renewable energy system, Energy 124(2017) 59-73. [百度学术]
-
[25]
M.Fochesato, C.Cenedese, J.Lygeros, A Stackelberg game for incentive-based Demand Response in energy markets, in: 2022 IEEE 61st Conference on Decision and Control (CDC), 2022,https://doi.org/10.48550/arXiv.2204.08730. [百度学术]
-
[26]
B.N.Alhasnawi, B.H.Jasim, A.N.Alhasnawi, et al., A novel efficient energy optimization in smart urban buildings based on optimal demand side management, Energy Strat.Rev.54 (2024)101461. [百度学术]
-
[27]
B.Javanmard, M.Tabrizian, M.Ansarian, A.Ahmarinejad,Energy management of multi-microgrids based on game theory approach in the presence of Demand Response programs, energy storage systems and renewable energy resources,J.Energy Storage 42 (2021) 102971. [百度学术]
-
[28]
B.N.Alhasnawi, B.H.Jasim, A.M.Buresˇ, et al., A multi objective improved cockroach swarm algorithm approach for apartment energy management systems, Information 14 (2023) 521. [百度学术]
-
[29]
M.Tostado-Veliz, H.M.Hasanien, R.A.Turky, et al., A fully robust home energy management model considering real time price and on-board vehicle batteries, J.Energy Storage 72(2023)108531. [百度学术]
-
[30]
A.A.Adesanya, C.Schell, Solar PV-diesel hybrid systems for the Nigerian private sector: an impact assessment, Energy Policy 132(2019) 196-207. [百度学术]
-
[31]
X.Wang, H.Wang, S.H.Ahn, Demand-side management for offgrid solar-powered microgrids: a case study of rural electrification in Tanzania, Energy 224 (2021). [百度学术]
-
[32]
S.Feron, Sustainability of off-grid photovoltaic systems for rural electrification in developing countries: a review, Sustainability 8(12) (2016) 1326. [百度学术]
-
[33]
P.Benalcazar, A.Suski, J.Kamin´ski, The effects of capital and energy subsidies on the optimal design of microgrid systems,Energies 13 (4) (2020) 955. [百度学术]
-
[34]
S.Jaglin, Electricity autonomy and power grids in Africa: from rural experiments to urban hybridization s, in: Local Energy Autonomy: Spaces, Scales, Politics, 2019, pp.291-314. [百度学术]
-
[35]
Y.Li, C.Wang, G.Li, C.Chen, Optimal scheduling of integrated Demand Response-enabled integrated energy systems with uncertain renewable generations: a Stackelberg game approach,Energy Conver.Manage.235 (2021) 113996. [百度学术]
-
[36]
B.N.Alhasnawi, S.M.M.Almutoki, F.F.K.Hussain, et al., A new methodology for reducing carbon emissions using multi-renewable energy systems and artificial intelligence, Sustain.Cities Soc.114(2024) 105721. [百度学术]
-
[37]
Y.Wang, W.Yang, T.Liu, Appliances considered Demand Response optimisation for smart grid, IET Gener.Transm.Distrib.14 (4) (2017) 856-864. [百度学术]
-
[38]
O.O.Babayomi, B.Olubayo, I.H.Denwigwe, et al., A review of renewable off-grid mini-grids in Sub-Saharan Africa, Front.Energy Res.10 (2023) 1089025. [百度学术]
-
[39]
A.Nordling, S.Pa¨dam, C.af Bure´n, P.Jo¨rgensen,Social costs and benefits of smart grid technologies, Discussion Paper ISGAN Annex 3 Int.Smart Grid Action Netw.(2018). [百度学术]
-
[40]
H.Louie, Off-Grid Electrical Systems in Developing Countries,Springer, Cham, Switzerland, 2018. [百度学术]
-
[41]
L.Odarno, E.Sawe, M.Swai, M.J.J.Katyega,A.Lee,Accelerating mini-grid deployment in sub-Saharan Africa: lessons from Tanzania, TaTEDO - WRI, 2017. [百度学术]
-
[42]
T.Sarkar, A.Bhattacharjee, H.Samanta, et al., Optimal design and implementation of solar PV-wind-biogas-VRFB storage integrated smart hybrid microgrid for ensuring zero loss of power supply probability, Energy Convers.Manag.191 (2019) 102-118. [百度学术]
-
[43]
M.Sufyan, N.A.Rahim, C.K.Tan, M.A.Muhammad, S.R.S.Raihan, Optimal sizing and energy scheduling of isolated microgrid considering the battery lifetime degradation, PLoS One 14 (2)(2019) e0211642. [百度学术]
-
[44]
O.Adeoye, C.Spataru, Modelling and forecasting hourly electricity demand in west African countries, Appl.Energy 242(2019) 311-333. [百度学术]
-
[45]
S.P.Ayengo, T.Schirmer, K.P.Kairies, H.Axelsen, D.U.Sauer,Comparison of off-grid power supply systems using lead-acid and lithium-ion batteries, Sol.Energy 162 (2018) 140-152. [百度学术]
-
[46]
NBS, National Bureau of Statistics, LSMS-integrated surveys on agriculture: General household survey panel 2015/2016, 2016. [百度学术]
-
[47]
R.Dufo-Lo´pez, J.L.Bernal-Agustı´n, J.M.Yusta-Loyo, J.A.Domı´nguez-Navarro, I.J.Ramı´rez-Rosado, J.L.Aso, Multiobjective optimization minimizing cost and life cycle emissions of stand-alone PV-wind-diesel systems with batteries storage, Appl.Energy 88 (11) (2011) 4033-4041. [百度学术]
-
[48]
GAMS, Gams-documentation.GAMS Documentation Center,2021. [百度学术]
-
[49]
Q.Lu, S.Lu¨, Y.Leng, A Nash-Stackelberg game approach in regional energy market considering users’ integrated Demand Response, Energy 175 (2019) 456-470. [百度学术]
-
[50]
M.Yu, S.H.Hong, A real-time demand-response algorithm for smart grids: a Stackelberg game approach, IEEE Trans.Smart Grid 7 (2) (2016) 879-888. [百度学术]
-
[51]
P.Yang, G.Tang, A.Nehorai, A game-theoretic approach for optimal time-of-use electricity pricing, IEEE Trans.Power Syst.28(2) (2013) 884-892. [百度学术]
-
[52]
A.Jaiswal, Lithium-ion battery based renewable energy solution for off-grid electricity: a techno-econo mic analysis, Renew.Sust.Energy Rev.72 (2017) 922-934. [百度学术]
-
[53]
P.Ralon, M.Taylor, A.Ilas, et al., Electricity Storage and Renewables: Costs and Markets to 2030, International Renewable Energy Agency, Abu Dhabi, UAE, 2017. [百度学术]
-
[54]
N.J.Williams, P.Jaramillo, J.Taneja, T.S.Ustun,Enabling private sector investment in microgrid-based rural electrification in developing countries: a review, Ren.Sustain.Energy Rev.52(2015) 1268-1281. [百度学术]
-
[55]
J.Corfee-Morlot, P.Parks, O.James, F.Ayeni, Achieving clean energy access in Sub-Saharan Africa, 3Cs and Carbon Limits Nigeria, 2019. [百度学术]
-
[56]
A.S.Sarkodie, S.Adams, Electricity access and income inequality in south Africa: evidence from Bayesian and NARDL analyses,Energy Strat.Rev.29 (2020) 100480. [百度学术]
-
[57]
N.Magnani, A.Vaona, Access to electricity and socio-economic characteristics: panel data evidence at the country level,Energy 103(2016) 447-455. [百度学术]
-
[58]
A.L.Bukar, C.W.Tan, K.Y.Lau, Optimal sizing of an autonomous photovoltaic/ wind/ battery/ diesel generator microgrid using grasshopper optimization algorithm, Sol.Energy 188 (2019) 685-696. [百度学术]
-
[59]
L.Olatomiwa, S.Mekhilef, A.S.N.Huda, K.Sanusi, Technoeconomic analysis of hybrid PV-diesel-battery and PV-winddiesel-battery power systems: the way forward for rural development, Energy Sci.Eng.3 (4) (2015) 271-285. [百度学术]
-
[60]
T.J.Reber, S.S.Booth, D.S.Cutler, X.Li, J.A.Salasovich, Tariff Considerations for Micro-Grids in Sub-Saharan Africa, National Renewable Energy Lab, Golden, CO (United States), 2018. [百度学术]
Fund Information

