Recommended articles:
-

-
Global Energy Interconnection
Volume 8, Issue 4, Aug 2025, Pages 640-656
A novel balance method for determining the energy efficiency of electric traction networks
Abstract
Abstract
0 Introduction
This research presented below aims to develop methods for calculation of power losses in ETN and for breaking down power consumption by source.The relevance of this research agenda is confirmed by a sizable body of contributions dealing with this subject.
The issues of energy saving in traction power supply systems are devoted to the articles [1-10].For example,Ref.[1] assessed power losses by train traction.Paper [2]reported the results of a comparative study of investment and efficiency to reduce energy consumption in traction power supply and described the present situation of regenerative energy utilization by an energy storage system.Ref.[3] evaluated the energy saving effect of traction power supply voltage in an urban electric railway system.Ref.[4] investigated the possibility of energy saving by introducing energy conversion and energy storage technologies in traction power supply systems.Ref.[5] dealt with enhancement of energy efficiency of a 25 kV traction network by decreasing the balancing current.Ref.[6]detailed a technique for evaluating energy loss in DC traction power supply systems.Refs.[7,8] proposed to use hierarchical coordination of trains and storages of traction substations for energy cost optimization.Ref.[9] proposed a modified unified power flow system with energy-saving and energy feedback evaluation as applied to railway power supply systems.Ref.[10]discussed the issues of cost of high-efficiency power supply technologies used on railways.
The problems of increasing the efficiency of regenerative braking are solved in [11,12,14].Ref.[11] solved the problem of optimization of rolling stock fleet motion under traction power system constraints.Ref.[12] contributed an intelligent regenerative braking energy harvesting strategy for an AC railway substation.Ref.[14]proposed an optimal centralized control strategy for regenerative braking energy flow exchanges in DC railway traction systems.
The problem of improving the quality of electric power is considered in[13].Ref.[13]discussed the issues of application of power electronics to improve power quality and efficiency of power supply of AC traction networks.
Technologies for managing the power consumption for train traction are described in [15-18].Ref.[15] evaluated high-speed railway dynamic energy consumption.Ref.[16]assessed energy management opportunities in DC traction networks.Ref.[17] detailed a two-level energy management model of a railroad substation with energy storage[17].Ref.[18] discussed the issues of application of artificial neural networks for forecasting electric loads of railway transport [18].
The review of the published research presented above allows us to conclude that the available contributions have covered key aspects related to the issue of power loss calculation in ETNs and enhancement of the energy efficiency of transportation processes.
However,the issues of power loss calculation based on ASCAPC data and breakdown of electricity consumption by source have not been addressed in the studies known to the authors.Below we present the results of research aimed at developing methods for power loss calculation in ETNs and breakdown of power consumption by source based on metering data generated by ASCAPC.
Our technique stands apart from the findings reported in the published research on the topic with the key differences being as follows:
1) the proposed technique makes it possible to carry out on-line calculations of power losses in AC traction networks, allowing for real-time control of the energy efficiency of transportation processes;
2) we have formulated and solved the problem of breaking down power consumption by source: i.e.,calculation of the amount of power consumed by a particular train as supplied by each traction substation.
The rest of the paper is organized as follows.The balance-based technique is provided in Section II.Section III presents loss calculation in traction transformers.Section IV shows the power consumption measurement errors.In Section V,an algorithm for energy efficiency calculation in traction networks and transformers is presented.Section VI validates the balance-based technique.In Section VII, an algorithm for energy efficiency calculation from ASCAPC data is presented.Finally,Section VIII draws the conclusions.
1 The balance-based technique
The version of the technique presented below has power losses calculated at the fundamental frequency and does not take into account additional components resulting from harmonic distortions.This is due to the fact that most of the rolling stock that we considered while elaborating the technique was equipped with metering devices that recorded power consumption only at the fundamental frequency.It should be noted that the technique will be able to accommodate those additional components without undergoing significant modifications since Fazonord[20], the software package that served as the backbone for the modeling process, is designed to model nonsinusoidal power flows as well.Furthermore, the current version of this software package (5.3.2.9) allows modeling of DC traction networks with detailed representation of rectifier-inverter units and calculation of their power losses.This enables us to generalize the proposed technique so as to address the task of breaking down the power consumption by source in DC traction networks.
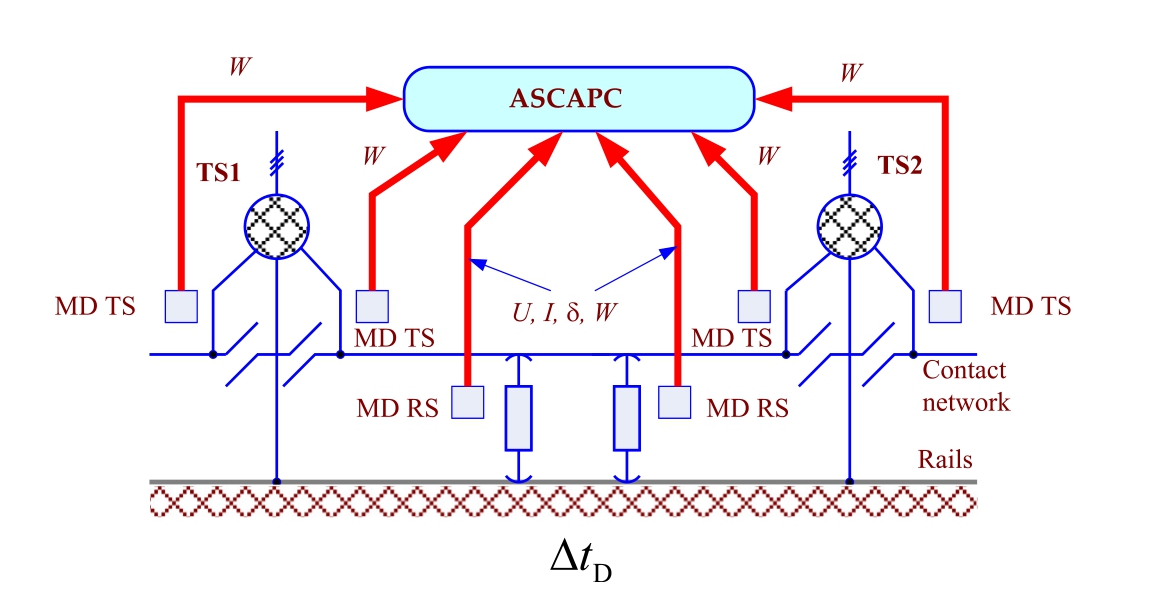
Fig.1.ASCAPC structure for the traction power system:MD - metering devices.
ASCAPC systems implemented in traction networks usually record the following information (Fig.1):
1) levels of voltages U, currents I, angles δ between them (for fundamental frequency) and power consumption by trains together with the milepost that identifies locomotive location, which are recorded by sensors and metering devices with the interval of Δt D;
2) power consumption by the overhead catenary system feeders of traction substations, which is recorded by metering devices with the interva l of ΔtTS; at thatΔ t T S > Δt D.
These data make it possible to break down the rolling stock (RS) power consumption by source and calculate power losses in the traction network by drawing up power balances for feeder arms of adjacent traction substations.The law of conservation of energy serves as the basis for drawing up the balance.This takes into account the average transmission of active and reactive power with the breakdown by feeders of traction substations over the reading time interval recorded by the ASCAPC.
The consumption of active (and reactive) power from the feeders of substation A(Fig.2)recorded by the meters is made up by a preliminary estimate of consumption by trains W aA, consumption due to losses in the traction network ΔW aA, and transmission to substation B W aT [21]:

The consumption from feeders of substation B is similar,except that one has to subtract the energy transmitted:

Calculated estimates of electric power consumption by trains with a breakdown by supply arms of the feeder area W a A , Wa B allow calculating the average transmission capacity of active and reactive electric power

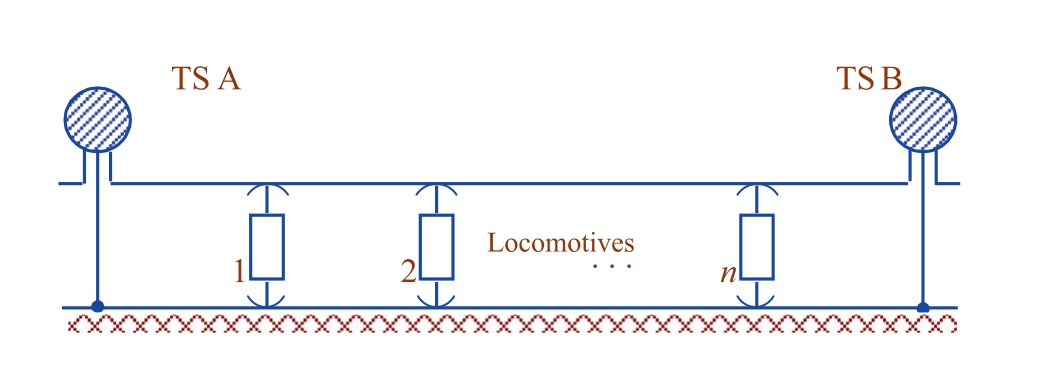
Fig.2.Inter-substation area (ISA) circuit.
Electricity consumed by substations to cover losses can be considered proportional to the recorded consumption:
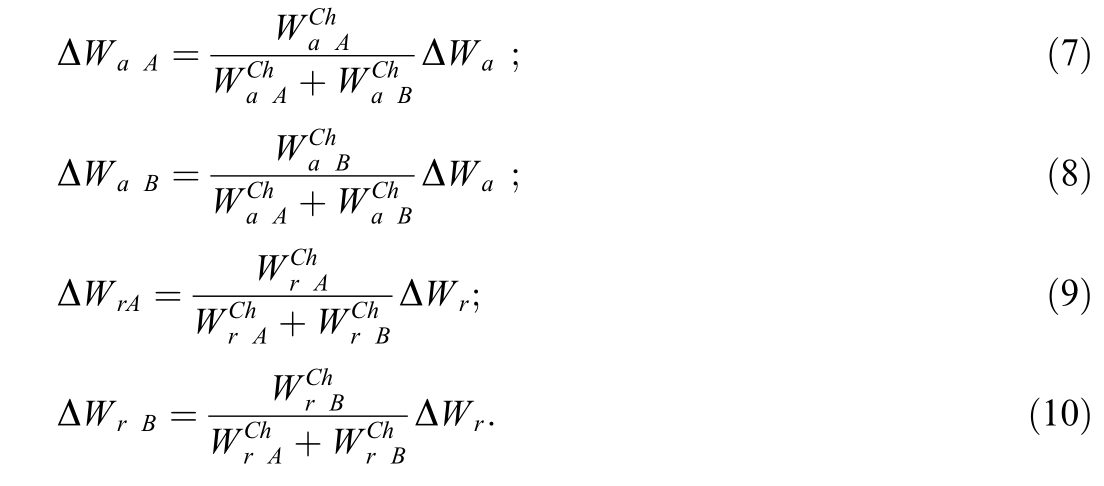
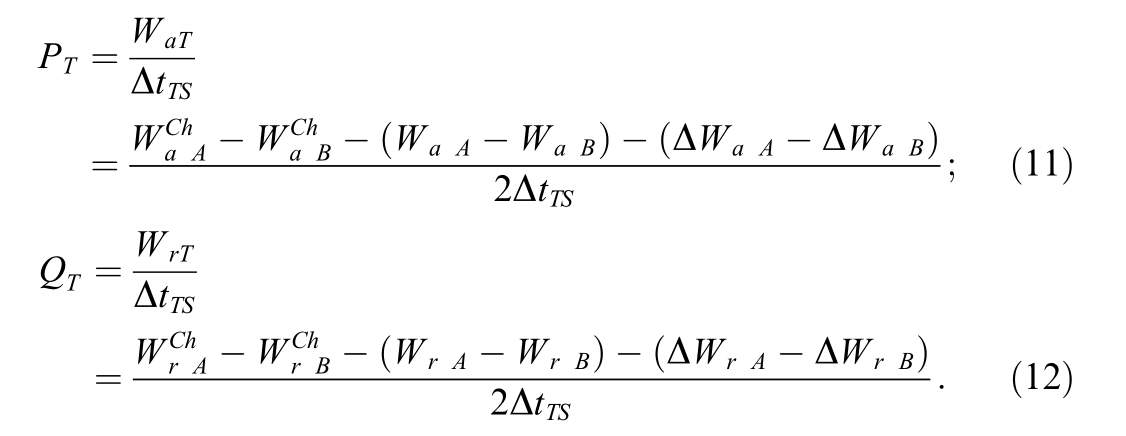
Thus, the average transmission power values can be determined as per the following equations:
Due to the unbalanced load of traction transformers,their loss calculation has a number of unique features outlined below.
2 Loss calculation in traction transformers
Loss calculation in traction transformers requires information on power flows in two adjacent ISAs that receive power from a given transformer.They also need the information on power consumption by the single area of the electrical network that receive power from the single-area winding of the traction transformer.The consumption of electricity during the time ΔtTS with a breakdown by the feeders of single-area customers is recorded by ASCAPC and can be used in loss calculations assuming the singlearea load is stable during the interval ΔtTS.
Transformer losses are made up of semi-fixed losses and load losses.The former group of losses can be calculated,assuming transformer voltages equal to the nominal values, as follows:
where ΔPT xx is the no-load losses of the transformer.
The presence of a single-area three-phase load complicates the algorithm for calculating load losses.A solution to this problem was reported in [19].In the case of the setup considered here, when calculation of traction network losses yields power flows averaged over time Δ tDwith their breakdown by feeders of traction substations, it is reasonable to calculate load losses based on these data.The calculation algorithm is based on the following premises.
The power of the phases of the single-area load is calculated for the time ΔtTS with the breakdown by the feeders of the power supply area assuming that the single-area load is balanced:

where![]() total active and reactive power consumption by the feeders of a single area of the network for the intervalΔtTS.The need to account for traction load unbalance requires phase-by-phase accounting of loads.Limiting the scope covered here to the most common three-phase three-winding transformers, we can establish the relationship between the network winding power and the values of the traction and single-area winding powers by the following equations that are applied separately for each phase:
total active and reactive power consumption by the feeders of a single area of the network for the intervalΔtTS.The need to account for traction load unbalance requires phase-by-phase accounting of loads.Limiting the scope covered here to the most common three-phase three-winding transformers, we can establish the relationship between the network winding power and the values of the traction and single-area winding powers by the following equations that are applied separately for each phase:
where PC F, PTF , PPF , QC F, QTF , QPFare active and reactive powers of phases of network, traction, and single-area windings, respectively.Such relationships are determined by the current and voltage ratios of the transformer winding phases.The voltage values of different phases can be assumed to be the same,and the phase currents of the traction winding can be obtained as follows.
Fig.3 shows the circuit of a three-phase transformer(the single-area winding with the balanced load is omitted).
When the phases are referenced to the AX phase of the network winding, the equations for phase voltages and currents are written as follows:
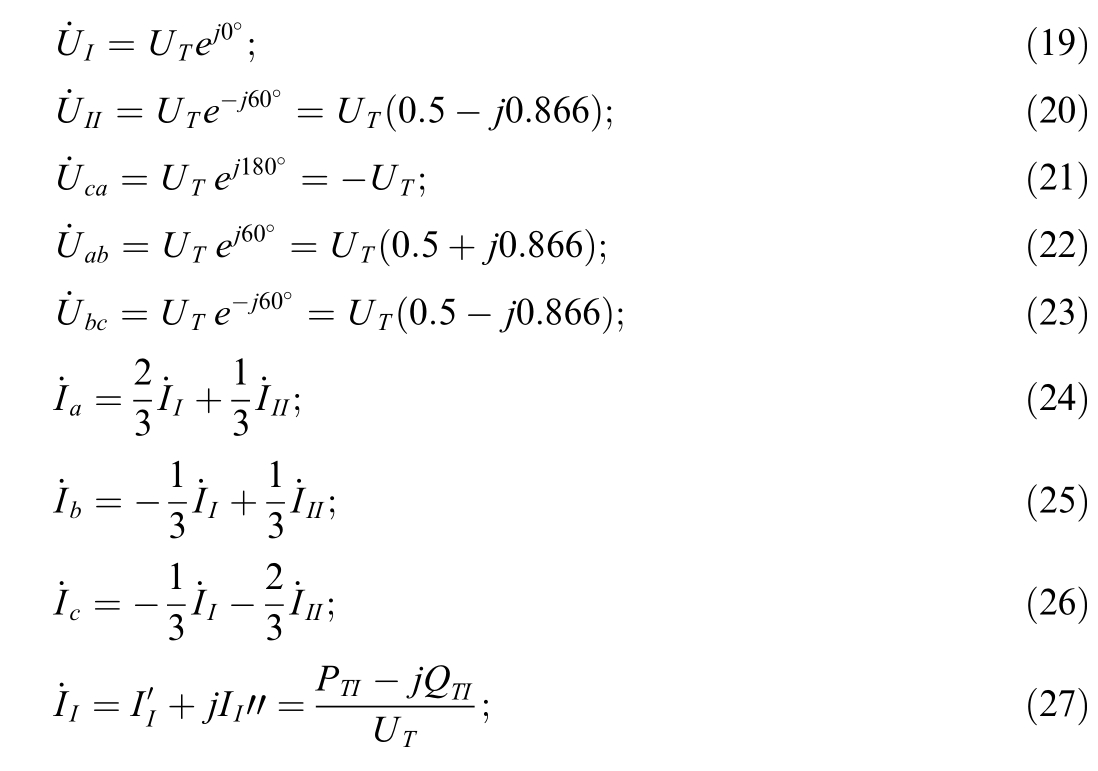
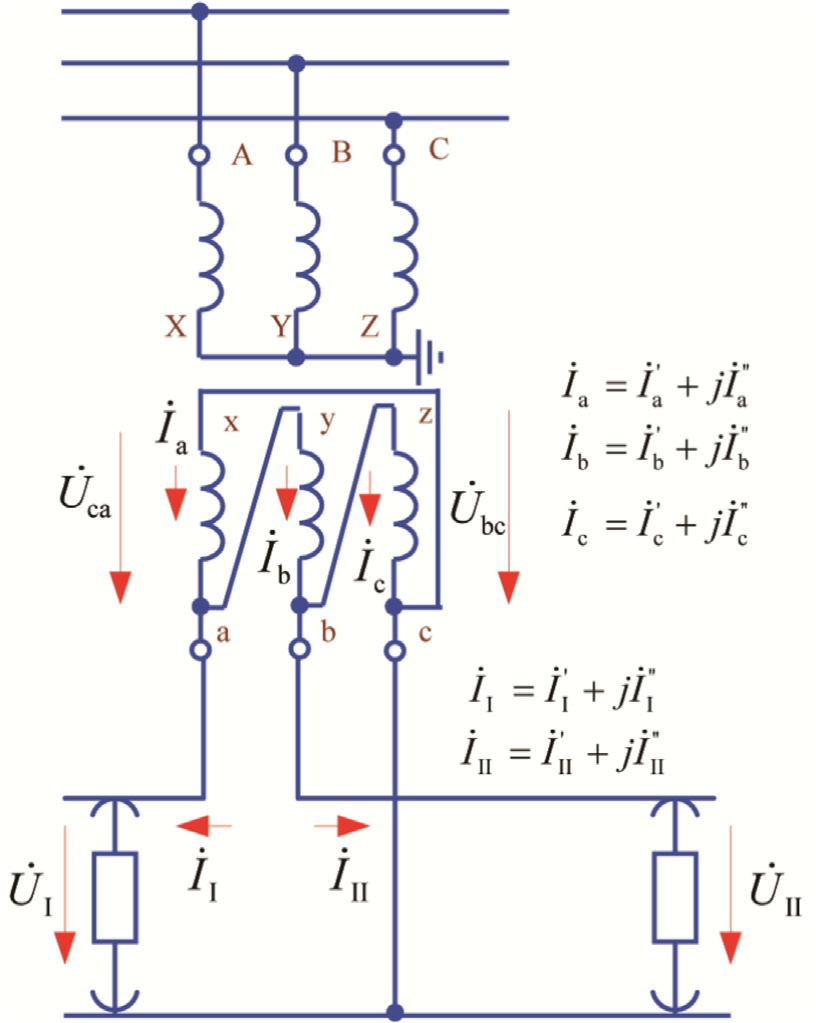
Fig.3.Three-phase transformer circuit.
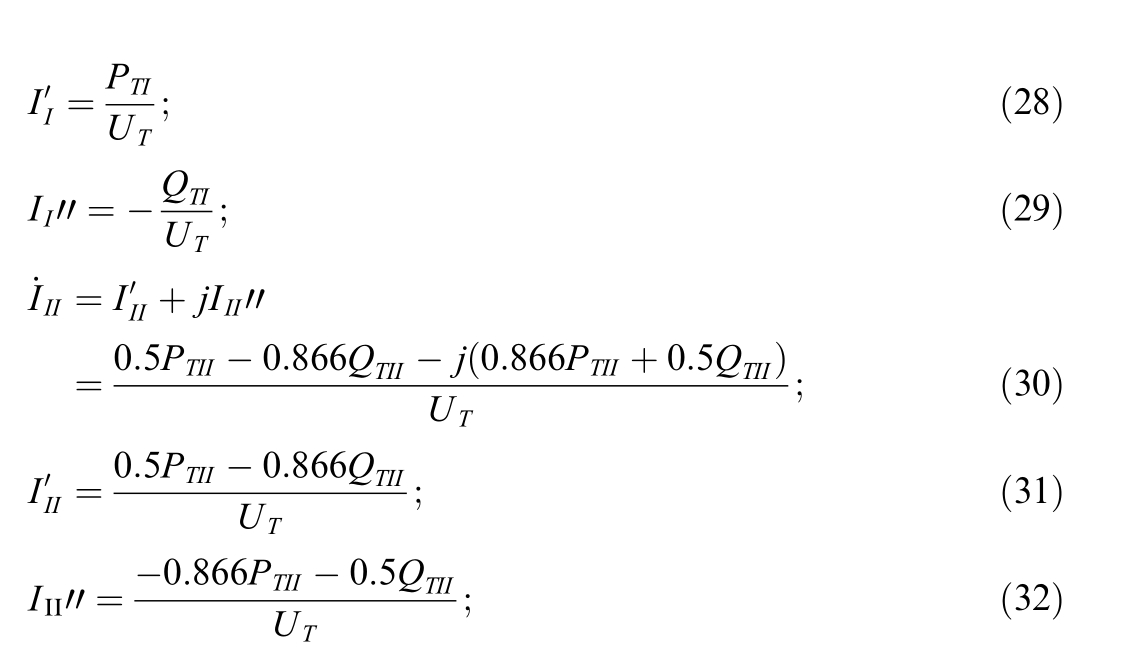
where PT,QT-active and reactive powers for the 27.5 kV input, PTI , QT I, PT II, QTII - active and reactive powers of feeder arms;the other quantities are as indicated in Fig.3.
The currents of the traction winding phases are equal to
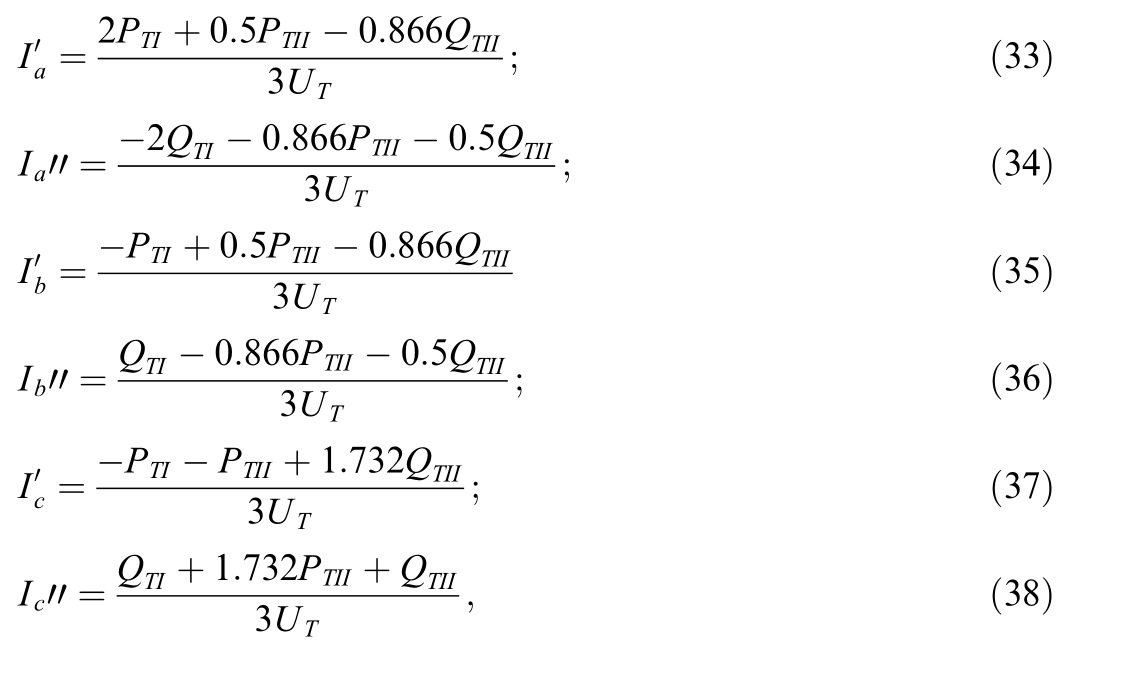
and the phase powers are determined by the following equalities:
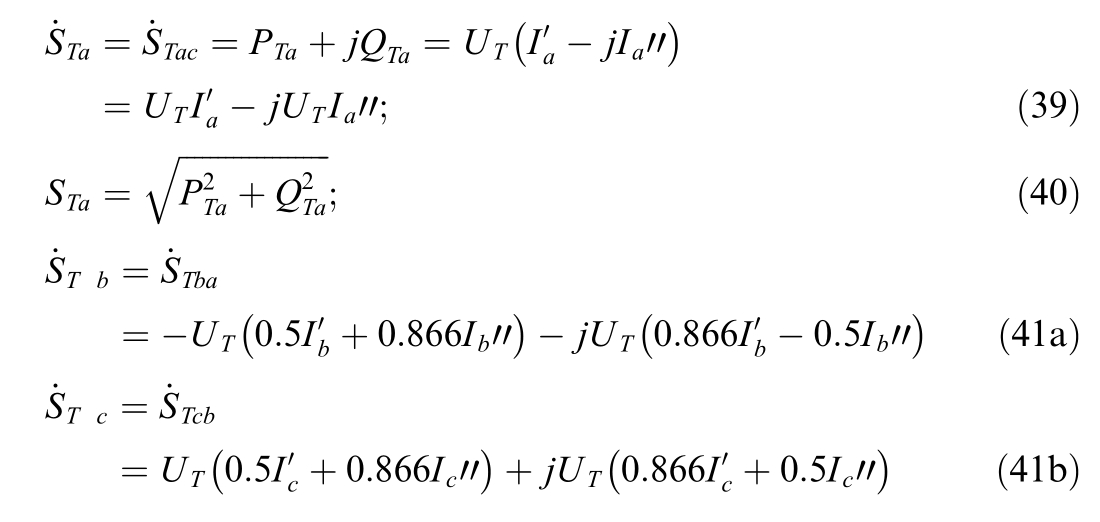
Loads of traction winding phases given that
can be determined as
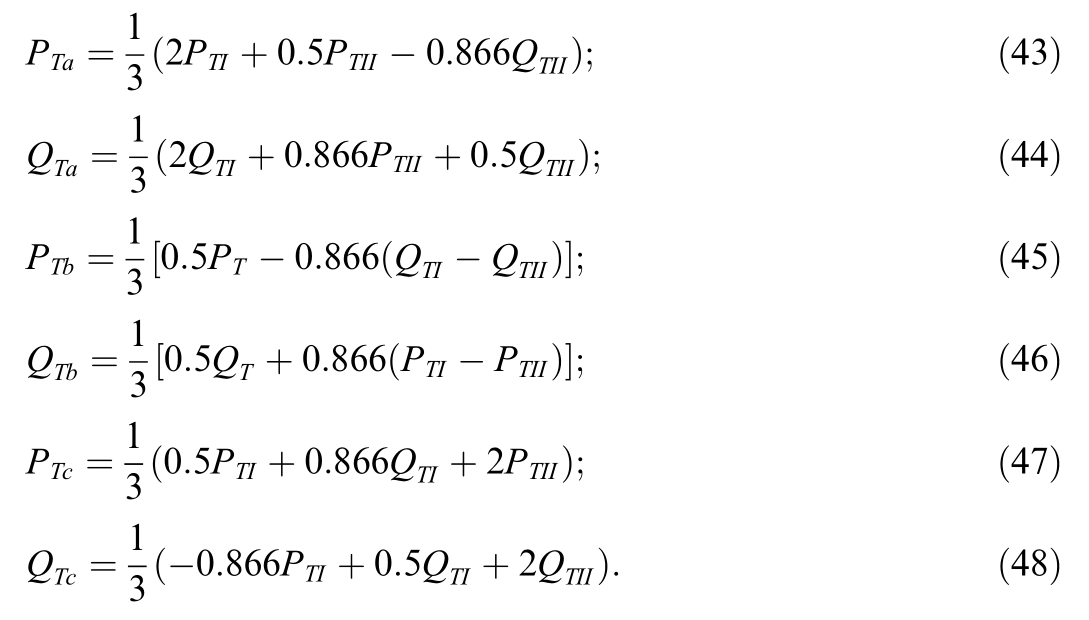
The load of the network winding phase due to the absence of zero sequence currents will be determined by the traction phase load, a third of the single-area load,the losses in the traction,single-area,and network winding phases, and a third of the no-load losses of the transformer:

Given the same rated power of windings, the ohmic resistances of their phases,scaled to the HV side,are equal to:
where UC is nominal voltage of the HV phase (network winding), SH is nominal power, ΔPk is transformer shortcircuit losses.Power losses in the traction winding phase are equal to:


where![]() is the traction-winding phase loading factor.
is the traction-winding phase loading factor.
The losses in the phases of the single-area and network windings are determined in the same way:
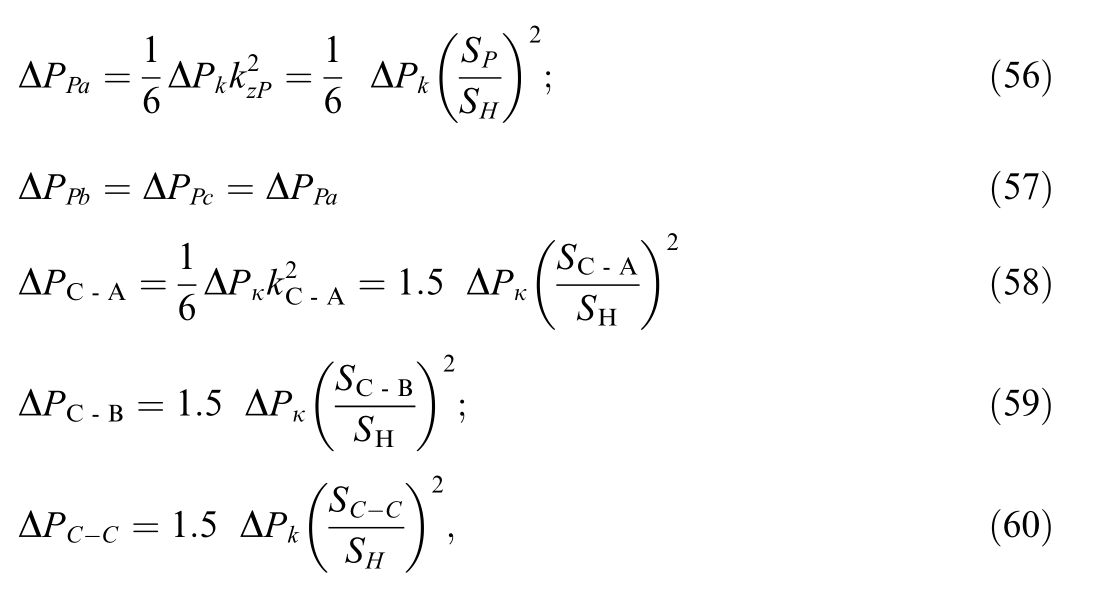

The expressions for reactive power losses due to differences in short-circuit voltages are written differently.The coil reactance’s scaled to the network winding voltage are determined by the short-circuit voltages [20]:
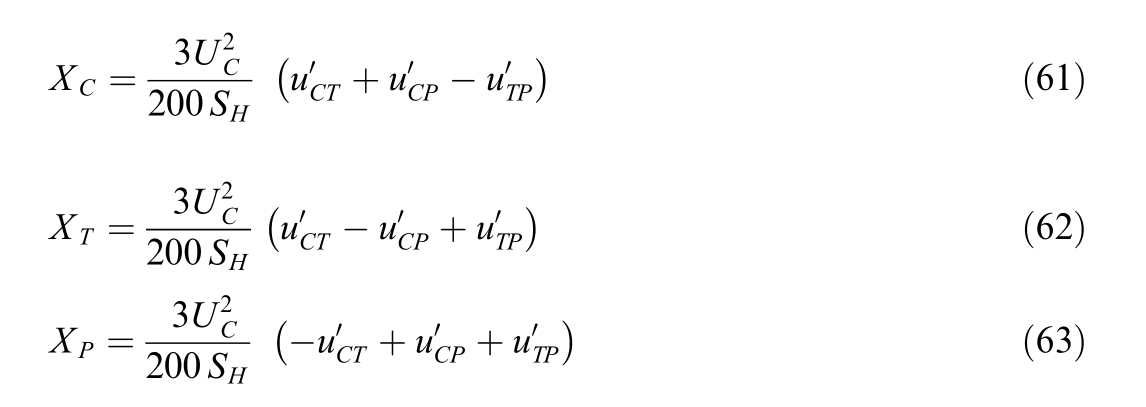
where![]() the short-circuit voltage adjusted for the voltage drop across the ohmic resistance,uij is the short-circuit voltage of the transformer, %; the character ‘‘C” in the index refers to the HV winding (network winding), ‘‘T” - the traction winding, ‘‘P” - the single-area winding.
the short-circuit voltage adjusted for the voltage drop across the ohmic resistance,uij is the short-circuit voltage of the transformer, %; the character ‘‘C” in the index refers to the HV winding (network winding), ‘‘T” - the traction winding, ‘‘P” - the single-area winding.
The reactive losses in the winding phases are calculated as follows:


The no-load reactive power is determined by the noload current ix (as percentage),

A less preferable option for loss calculation in traction transformers is to use, along with information on the investigated ISA,the data on the power consumption with their breakdown by the feeders of the adjacent ISA.The average active and reactive powers of the adjacent feeder arm can be calculated from the power consumption over time ΔtTS.One can obtain the effective values for use in loss calculations by relying on multiplication by the square of the shape factor.The shape factor can be assumed based on the information from the investigated ISA.
Loss calculations in a single-phase traction transformer of a 2 25 kV system are considerably simpler than in a three-phase transformer of a 25 kV system.In particular,a single-phase transformer requires the power flow of only one arm of the substation.The unique features of the algorithm for calculating power losses in a single-phase traction transformer for the next interval ΔtD are as follows.
1) The single-area winding powers of the transformer are determined as per expressions similar to those for a three-phase transformer as the powers of a single phase of the single-area load.
2) The power of the network winding is pre-calculated by summing up the powers of the traction and single-area windings.
3) The load loss powers of the transformer windings are determined by expressions similar to those for a single phase of a three-phase transformer.
Control of errors in measuring electricity is necessary to identify possible errors in recording electricity consumption by traction substations [22].
Calculated losses ΔW ap may differ from reported losses ΔW a by an amount


The error of the active electricity measuring channel is determined by the formula
where δCH,δ TT,δ TH are the permissible errors of meters,current and voltage transformers under normal conditions(accepted according to the value of accuracy classes), %;dL is the limit of permissible voltage losses in the lines connecting meters to the voltage transformer, %.
In addition,the conditional losses contain errors due to the inaccuracy of determining the location of the train, so the total error can be estimated by the value
where nk is the number of 15-second time intervals of train k, which may be less than 60, since the train may be present in the feeder zone for less than a 15-minute period.
3 Algorithm for energy efficiency calculation in traction networks and transformers
The algorithm for breaking down power consumption and calculating losses for a homogeneous intersubstation area (i.e., such an ISA where the traction network is the same throughout its entire length), which is the same for 25 kV and 2 25 kV traction systems,includes the following blocks.
1) Delimit the next feeder area.The first or next feeder area is delimited for power balance calculations for the interval ΔtTS.The feeder area may include either the entire ISA,or a part of it in case of cantilever feeding of the ISA, or yard tracks.
2) Select the next interval ΔtT S.Determine the first or the next interval Δt TSfor calculations.
3) Select the next interval ΔtD.Delimit the first or the next interval ΔtD of the interval to audit power consumption by traction substations.
4) Identify the current location of trains.Based on the ASCAPC data, identify mileposts of the current location of trains of the audited feeder area (Fig.4) that are positioned within the feeder area during the current interval ΔtD.The presence of a reactive power compensation unit (RPCU) at the switching station is accounted for as an additional train that consumes reactive power equal to
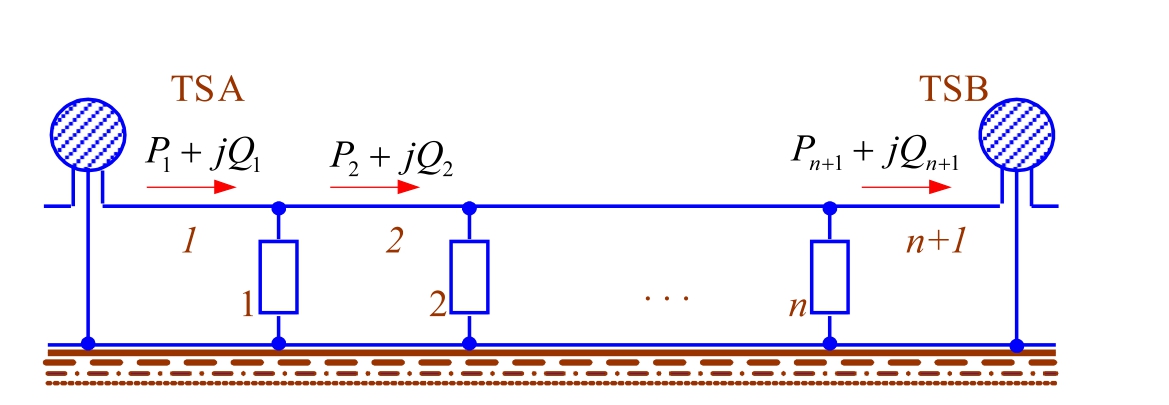
Fig.4.ISA power flow chart.

where QCn is the effective power of the RPCU, Un is the nominal voltage of the RPCU,U is the current value of voltage at the switching station,which can be assumed equal to the voltage at the bow collector of the nearest locomotive.The RPCU at the traction substation is connected to 27.5 kV busbars and does not need to be taken into account when breaking down consumption by source and calculating losses in the traction network.This is due to the fact that the RPCU is located outside the area of power metering by feeder meters, and the power flows generated there will be accounted for as transmission through the traction network.The presence of series compensation units, which are located outside the metering area of feeder meters, also leads to redistribution of power between traction substations with such power accounted for as transmission according to Step 10 of the algorithm.
5) Calculate current RS powers.Train powers for the current interval are calculated based on the electric power consumption by trains![]()

and total power consumption
where k =1,2, ,n;i-current interval number Δ tD,ktrain number,n-number of trains in the ISA at the end of the i-th interval.
Total power is needed for the breakdown of its losses by individual trains since losses occur during both traction and regeneration.They are also due to active and reactive power consumption.
6) Break down train powers by feeder arms.In the case of the one-sided feeder area power supply for the time i,the active and reactive powers![]() of all trains in the feeder area are summed up and the sums are assigned to the corresponding feeder arm of the intersubstation area:
of all trains in the feeder area are summed up and the sums are assigned to the corresponding feeder arm of the intersubstation area:

where n - the number of trains in the feeder area.i k , i k
In the case of the two-sided feeding,the powers P Q
of the trains and compensation units at the switching stations are distributed over the feeder arms A and B inversely proportional to the distances to the traction busbars of the substations:
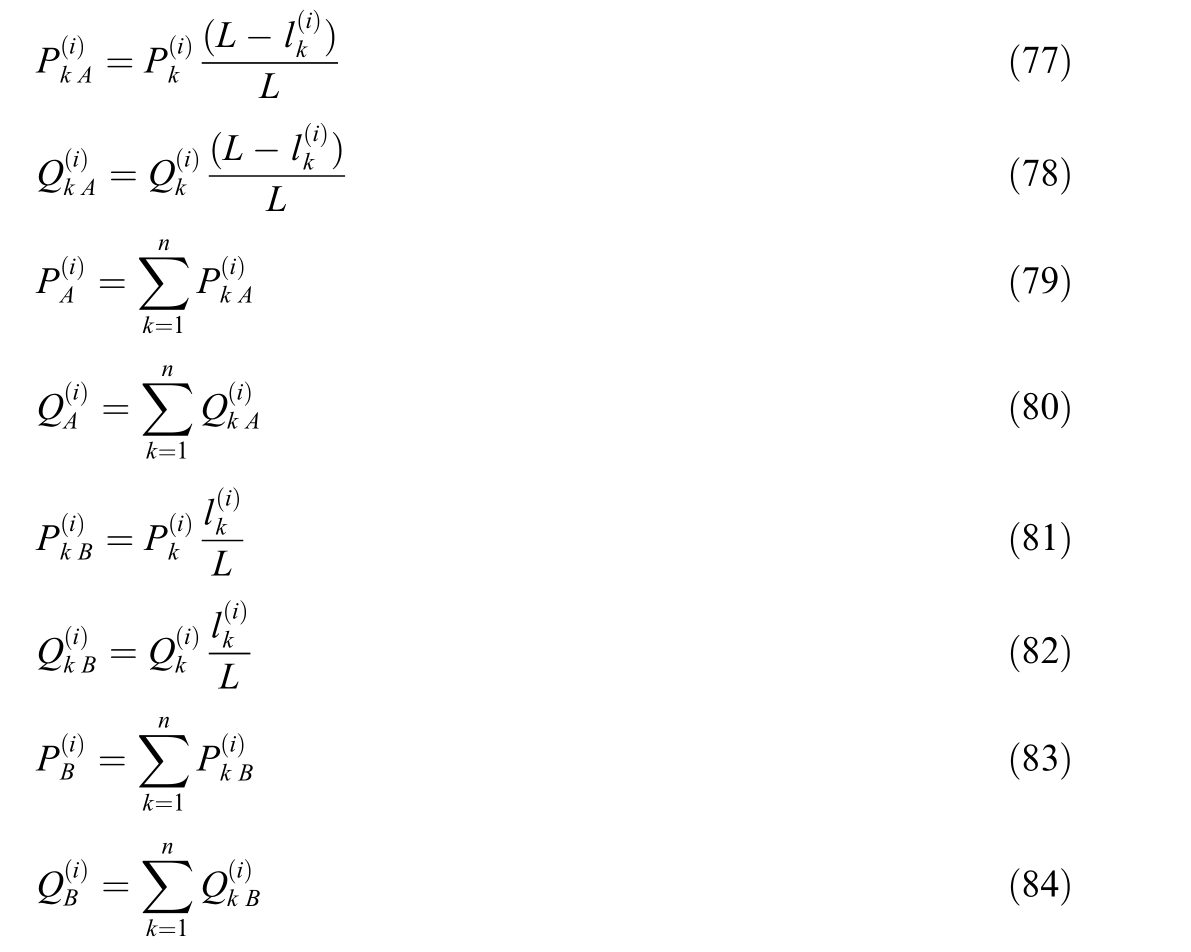
where![]() - the distance from the train k to the substation Afor thecurrent intervalΔtD with thenumberi,L- the distancebetween theadjacent substationsA and B.
- the distance from the train k to the substation Afor thecurrent intervalΔtD with thenumberi,L- the distancebetween theadjacent substationsA and B.
7) Calculate power consumption by feeder arms.Determine active and reactive power consumption of substation feeder arms for the current intervalΔtD:

8) Break down entire power consumption by trains during the interval ΔtTS.Go to Step 3 if the interval of power audit with the breakdown by substations has not yet been exhausted.
9) Calculate reportable losses.Power losses in the traction network for the period ΔtTS are equal to the difference between the power consumption in the inter-substation area,as recorded by the feeder meters of traction substations, and the total consumption by trains:

The losses are caused by actual losses in the traction network, errors of measuring instruments at locomotives and substations, failure to account for non-traction consumers fed from 27.5 kV inputs,and possible malfunctions of electricity metering systems.High values of reported losses indicate faulty measuring instruments, the presence of unaccounted consumers, or gross errors in the processing of measurement data.
For subsequent calculations it is necessary to determine the reported losses of reactive power:

10) Calculate power transmission in the overhead catenary system.The values of transmitted power are calculated using formulas (11), (12).Losses ΔW a A,ΔW a B,ΔW rA,ΔW r B are determined using expressions(7)-(10).
11) Adjust pre-calculated feeder arm consumption for power transmission.The power transmission consumption is added to the estimated active and reactive power consumption of the substation feeder arms for all intervalsΔt TS:

12) Perform power flow analysis in the traction network for each dynamic section of the traction network between trains.For each interval Δ tDwith the number i(i=1,2, ,60)for each section with the number k(k = 1, 2, , n + 1) calculate the active and reactive power flows along the traction network sections between trains with the addition of transmission:

Flows from TS A are positive, flows from TS B are negative.
13) Identify the power flow splitting point and break down consumption by feeder arms.Identify the train
where the sign of![]() changes.The power consumption duringthetimeΔtDforthe train isattributed to both substations accordingto the values ofthe left and right power flows:
changes.The power consumption duringthetimeΔtDforthe train isattributed to both substations accordingto the values ofthe left and right power flows:

The location of the train is the point of power flow splitting.Electricity consumption for the time Δ tDto the left of this train is attributed to substation A,while the consumption by the trains to the right is attributed to substation B.If the value of power flow![]() along the section k is zero,then the point of flow splitting is located inside this section.Or,which is the same,if the flows to the left and right of the train have the same signs, the train’s consumption over the time ΔtD is attributed to the left substation in the case of positive flows or to the right substation in the case of negative flows.The power flows along the outermost dynamic areas are the total estimated train power consumption by trains from the ISA feeder arms ignoring the losses in the traction network:
along the section k is zero,then the point of flow splitting is located inside this section.Or,which is the same,if the flows to the left and right of the train have the same signs, the train’s consumption over the time ΔtD is attributed to the left substation in the case of positive flows or to the right substation in the case of negative flows.The power flows along the outermost dynamic areas are the total estimated train power consumption by trains from the ISA feeder arms ignoring the losses in the traction network:

When the ISA is cantilevered,all power consumption is attributed to a single substation.
14) Calculate technical losses in dynamic sections of the traction network.The estimated technical losses at the k-th section for the i-th interval ΔtDare calculated based on the values of active and reactive power flows and the resistances of traction network sections:
where![]() voltage at the k-th train in the i-th interval;Rk-resistance of the k-th section to the left of the k-th train.For a 2
voltage at the k-th train in the i-th interval;Rk-resistance of the k-th section to the left of the k-th train.For a 2  25 kV Rksystem, the active component of the transmission resistance.
15) Break down losses by wires of the traction network section.The distribution of power losses in a multiwire traction network across individual wires is carried out as follows:

where![]() - losses in the wire j; Ri- ohmic resistance per 1 km of the wire i;α i -current transfer ratios,i.e.moduli of the percentage of current in the wire i;m-the number of wires in the system (contact wires of the catenary system, line feeders, screening wires, rails).
- losses in the wire j; Ri- ohmic resistance per 1 km of the wire i;α i -current transfer ratios,i.e.moduli of the percentage of current in the wire i;m-the number of wires in the system (contact wires of the catenary system, line feeders, screening wires, rails).
16) Calculate losses in autotransformers of the 2 25 kV system.No-load power losses in autotransformers for the i-th interval ΔtD are calculated based on no-load power losses specified in the equipment nameplate data:
where![]() - losses of the j-th autotransformer for the interval ΔtD;Ui-voltage of the overhead catenary system,taken equal to the voltage on the bow collector of the nearest locomotive; UH - nominal voltage of the autotransformer winding connected to the overhead catenary system; ΔPx j - no-load losses of the j-th autotransformer.
- losses of the j-th autotransformer for the interval ΔtD;Ui-voltage of the overhead catenary system,taken equal to the voltage on the bow collector of the nearest locomotive; UH - nominal voltage of the autotransformer winding connected to the overhead catenary system; ΔPx j - no-load losses of the j-th autotransformer.
Load losses of electric power of the j-th autotransformer are determined as per the equation

17) Calculate technical losses in 25 kV traction transformers.To calculate the losses, one needs information on the powers of the feeder arms P TI, Q TI, P TII, Q TII,of the traction transformer, i.e., the results of Steps 12 and 13 for the two ISA.Furthermore, one needs data on auxiliary consumption from the substation’s auxiliary consumption meter.
Calculate the phase powers of the single-area winding of the transformer:

where![]() total active and reactive power consumption by feeders of the area covered by power supply to non-tractions loads for the intervalΔtTS.
total active and reactive power consumption by feeders of the area covered by power supply to non-tractions loads for the intervalΔtTS.
Determine the powers of the auxiliary consumption phases:

where W CH a, WCH r - active and reactive auxiliary power consumption during the interval ΔtTS.
Determine the powers of the traction winding phases for each intervalΔtD:
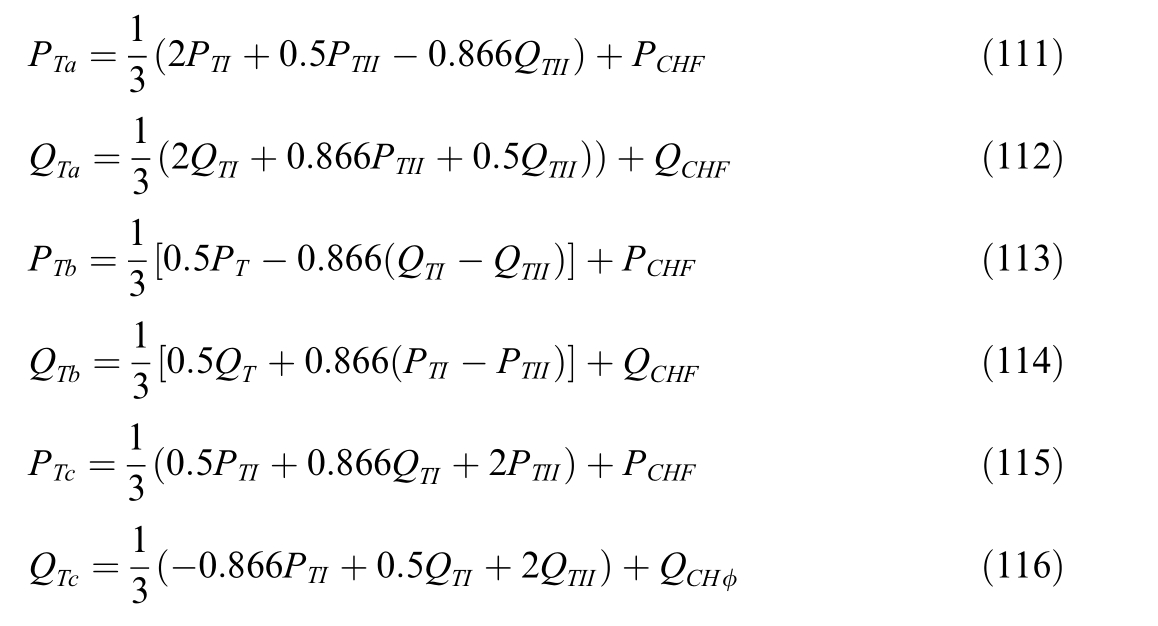
If there are RPCUs installed on substation busbars,the rated effective power of the RPCU is subtracted from the reactive power of the corresponding phase.
Calculate the powers of phase A of the network winding ignoring load losses for each intervalΔtD:
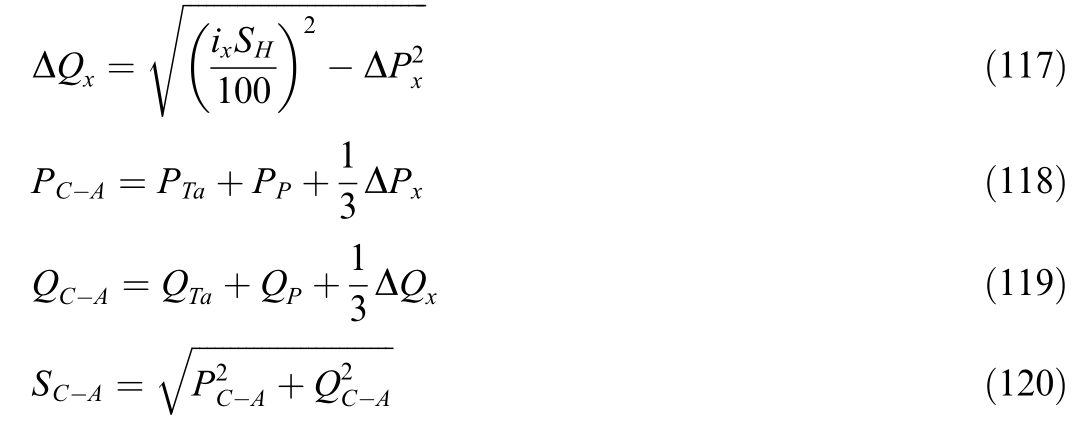
where SH - transformer rated power; ix -no-load current,%; ΔP x, ΔQx transformer no-load losses.The power of the other phases of network mains winding S C - B ,SC - C is determined similarly.
Calculate the powers of load losses of all phases of the transformer traction winding for each intervalΔtTS:
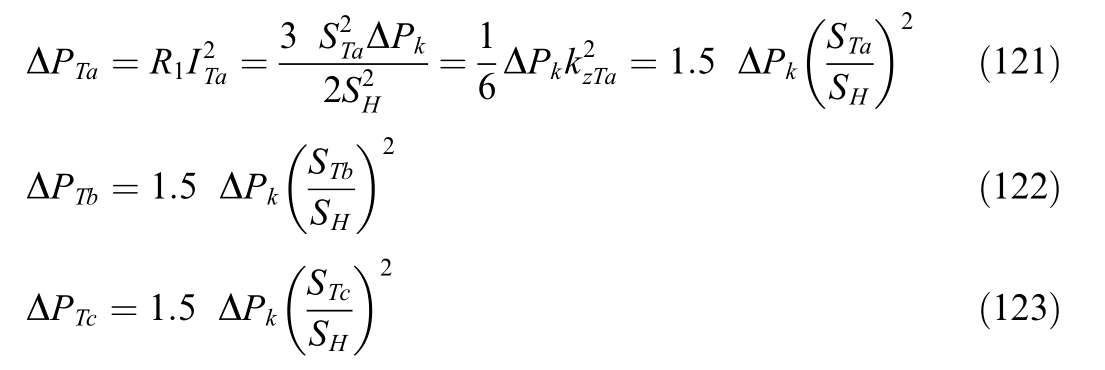
where![]() is the traction-winding phase loading factor.
is the traction-winding phase loading factor.
Calculate the powers of load losses in the phases of the single-area and network windings for each intervalΔtTS:

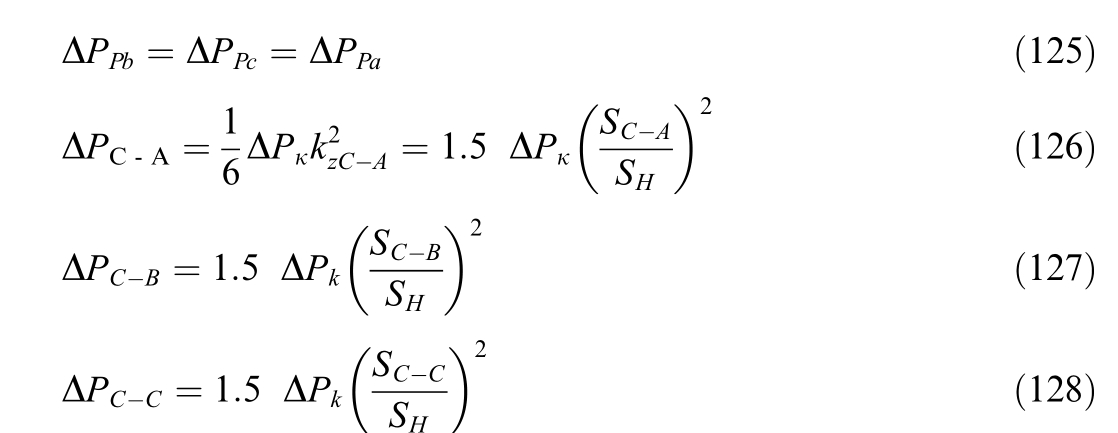

Determine active power consumption from the external network for each time interval Δ tDby the network winding of the transformer:
By multiplying the total power losses per the time interval,calculate the semi-fixed losses and load losses of active energy in the transformer:
Determine the percentage of technical losses in the traction transformer:
The percentage of technical losses attributable to traction and auxiliary losses is determined in proportion to the respective percentages of electricity consumed.
The calculations at Steps 17 are made for the time interval ΔtTS of power consumption audit at substations with summing up the absolute values of losses and calculating their percentages.
18) Calculate technical losses in 2 25 kV traction transformers.For a single-phase three-winding traction transformer, the power consumption for traction is determined by summing up the meter readings of the overhead catenary system and the line feeder of the corresponding arm.When the area is supplied from delta-connected single-area windings of three singlephase transformers,the power of the area is taken into account assuming that the district load is balanced.If there is a separate single-area transformer, the power of the single-area load of traction transformers is zero.We assume that the value of auxiliary active power is also known from meter readings.
Determine the power of the single-area winding of the transformer as the power of a single phase of the singlearea load:

where![]() total active and reactive power consumption by feeders of a single area of the network for the interval ΔtTS.
total active and reactive power consumption by feeders of a single area of the network for the interval ΔtTS.
Determine the powers of the auxiliary phases:

where W CH a, WCH r - active and reactive auxiliary power consumption during the interval ΔtTS.The network winding power is pre-calculated by summing the powers of the traction and single-area windings and no-load losses for each time interval ΔtD:
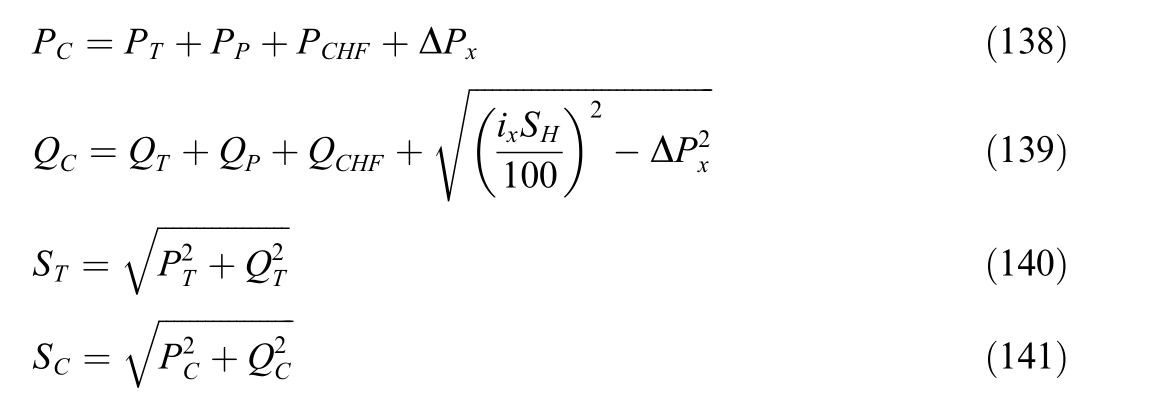
where SH - transformer rated power; ix -no-load current,%; ΔPx - transformer no-load losses.
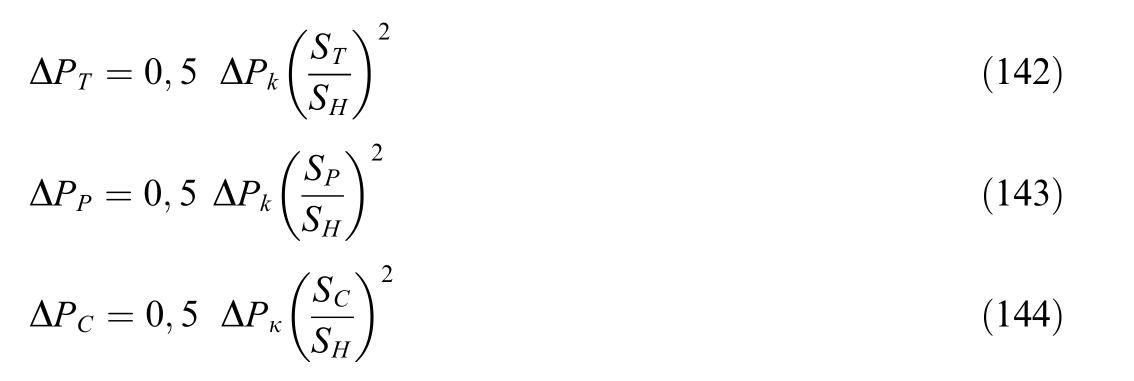
Calculate the power of load losses of the windings for each interval ΔtD:
Calculate active power consumption from the external network for the time interval Δ tD by the network winding:
Calculate active energy losses in the transformer through the corresponding powers:
Calculate the percentage of technical losses in the traction transformer:

The loss values attributable to traction and auxiliary losses are calculated in proportion to the respective percentages of electricity consumed.
Calculations for Steps 17-18 shall be performed for all intervals Δ t D within the time interval equal to Δ tTS, with summing up of the absolute loss values and calculating the percentage of losses.
19) Calculate total technical losses in the traction network and traction transformers.Estimated technical losses resulting from electricity consumption by traction of the investigated ISA for a given time interval are determined as per the following relationship:

where ΔWT A-the value of losses in the transformer of the left substation of the ISA, attributable to the investigated ISA; ΔWT B-the same for the transformer of the right substation;n the number of trains in the ISA;m-the number of autotransformers of the 2  25 kV system in the ISA.
The percentage of losses resulting from traction power supply including losses in the traction transformer is determined as follows:
Calculations are made for all intervals ΔtD within the time interval of power consumption audit at substations ΔtTS with summing up of the absolute values of losses and calculating the percentage of losses:

20) Make calculations for the remaining feeder areas.Go to Step 1 to perform calculations for the remaining feeder areas.
The block diagram of the described algorithm is shown in Fig.5.
4 Validation of the balance-based technology
To illustrate the application of the balance-based technique, we relied on the results of simulating the operation of a real-life railway section using the Fazonord software package [20].The software package calculates losses in components of the traction network, and the losses can then be compared with the results of loss calculations by the balancebased technique.Fig.6 shows the estimated schedule of 5 trains for the interval ΔtTS.Trains 5 and 7 weigh 3000 tons, trains 14 and 18 are 6300 tons and train 16 is 1100 tons.TS A is located at the 4559.95 km milepost and TS B is located at the 4605.79 km milepost.The simulation time interval was 0.25 min (15 s).
The track contact networks are made of PBSM-95+MF-100 suspensions.The analyzed inter-substation zone has three sectioning posts.The reactive power compensation units of the substations are connected to adjacent inter-substation zones.Traction transformers with a capacity of 40,000 kVA are fed from a 110 kV doublecircuit transmission line, which in turn is fed from a 500/110 kV district substation and, on the other hand,from a remote 500/110 kV substation.
The simulation yielded the following energy consumption values by individual feeders during 15 min:

Energy losses in the traction network were equal to 37.3 kWh.
Fig.6 shows the values of train powers.Power flow analysis according to Step 12 of our technique yielded the dependencies of flows on dynamically changing sections of the traction network having the form shown in Figs.7-9.As TS A is approached, the flows change the sign and then grow in absolute terms.
The time dependencies of active and reactive powers consumed by locomotives presented in Fig.6 indicated that the fluctuations in the values of these parameters reached 9 MW and 7 Mvar.We observed the largest spread in the case of train No.14.Fig.6 shows the graphs of active and reactive power flows running through the individual areas of the ETN in question.The graphs allow us to draw the following conclusions concerning the considered time interval of 200-215 min: active power flows running through areas 1 and 2 do not change their direction within the specified period of time; the curves corresponding to the reactive power flows Qij running through these areas cross the X axis; furthermore, flows Qij for Area 1 crossed the axis once, and those for Area 2 did it three times.The reactive power flows for Area 3 preserve their sign, while the active power flows Pij change the direction twice.Similar conclusions concerning Qij hold true for Area 4.The values of Pij change the sign five times.The flows Pij and Qij for Area 5 preserve the sign for the entire period under consideration.However, the value of Pij approaches zero several times.The nature of the dependencies presented in Figs.6-12 is determined by the parameters of the traction power supply system and the rolling stock movement schedule.
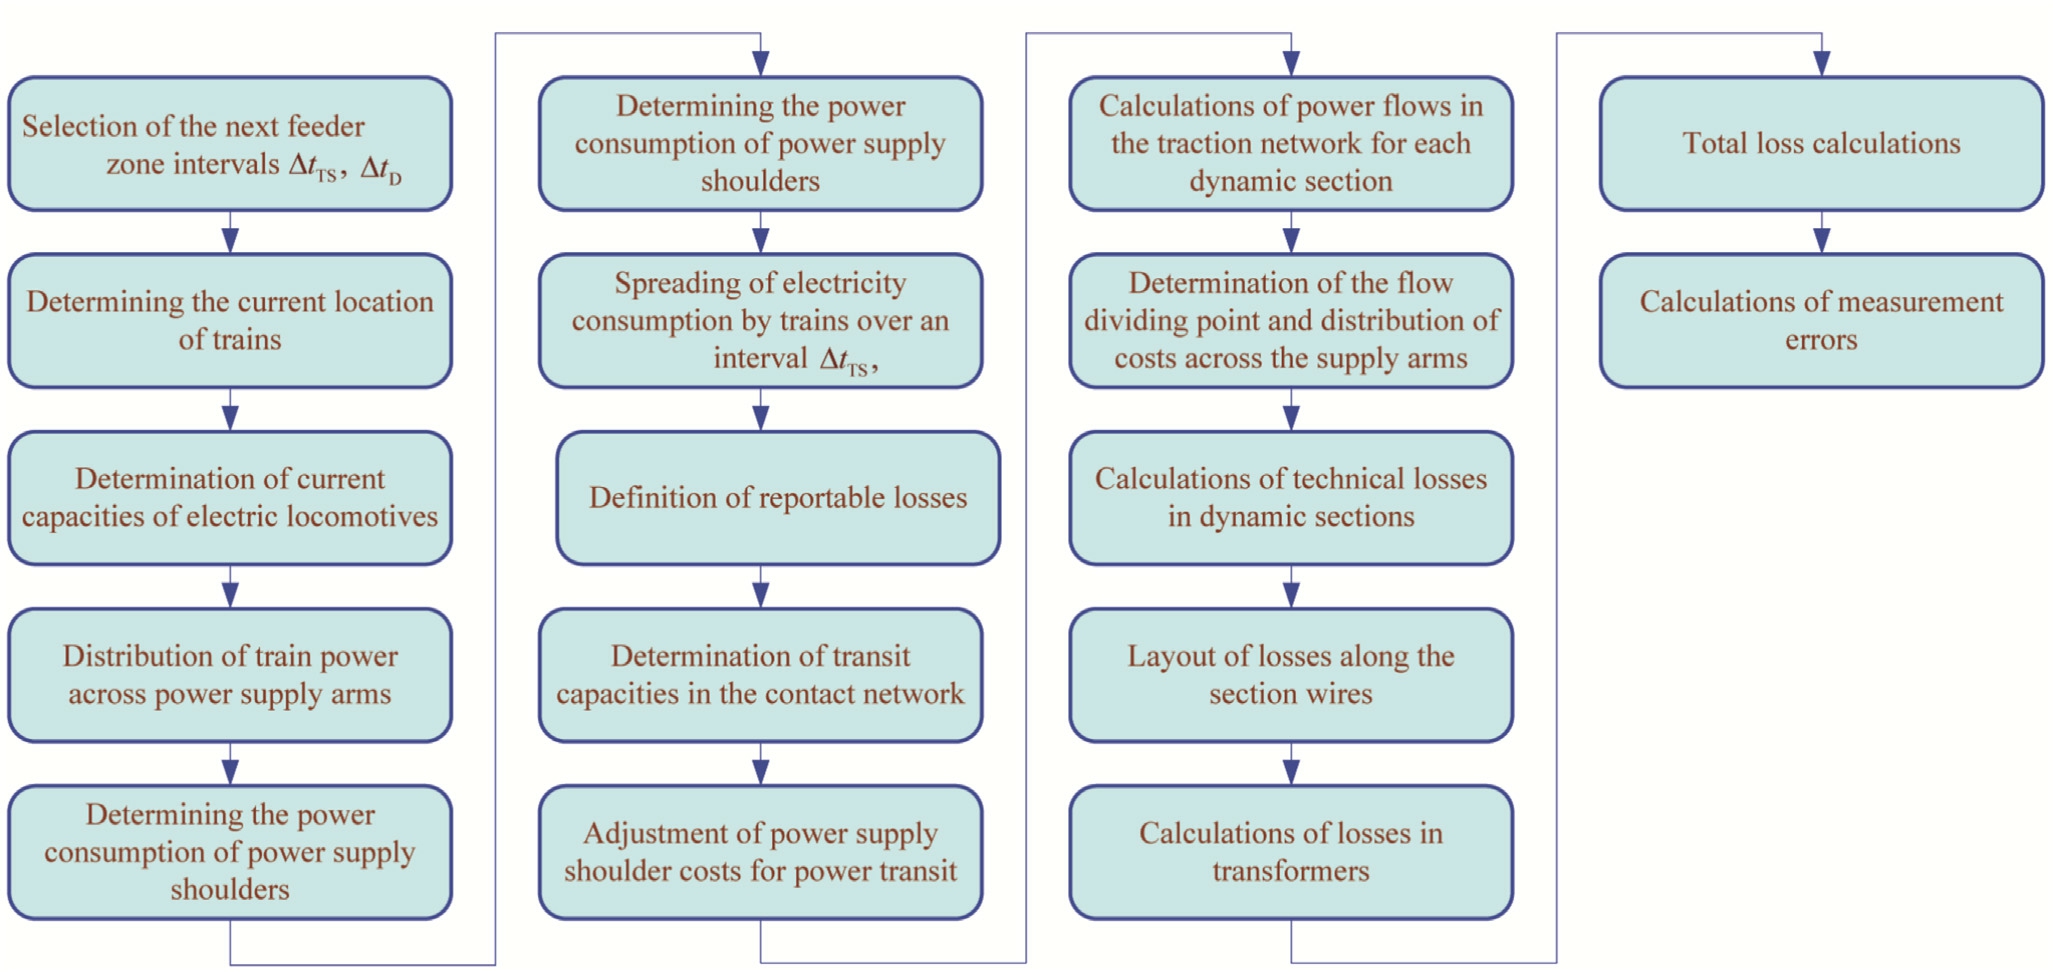
Fig.5.Algorithm block diagram.
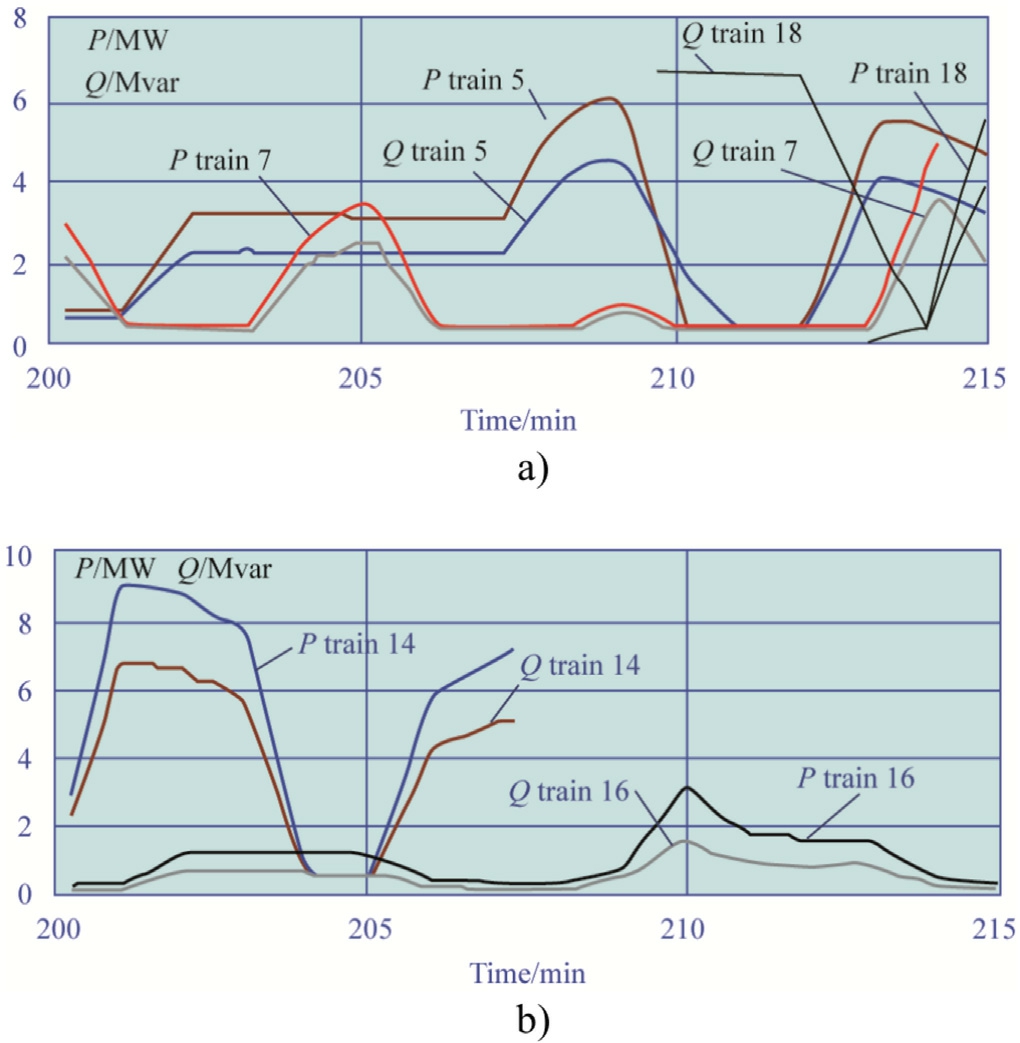
Fig.6.Time charts for train powers:a trains 5,7,18;b trains 14,16.
The interval of 200-215 min corresponds to the complete filling of the inter-substation zone with trains.Figs.10-12 show the time-varying boundaries of the sections between neighboring trains; as the trains move, the sections change their length, and the last section disappears altogether for some time.Trains that make up section boundaries transition to other sections as they move.
The modeling data presented in Figs.6-13 and in Table 1 were obtained in the Fazonord software package and also include the results obtained using the proposed balance methodology.
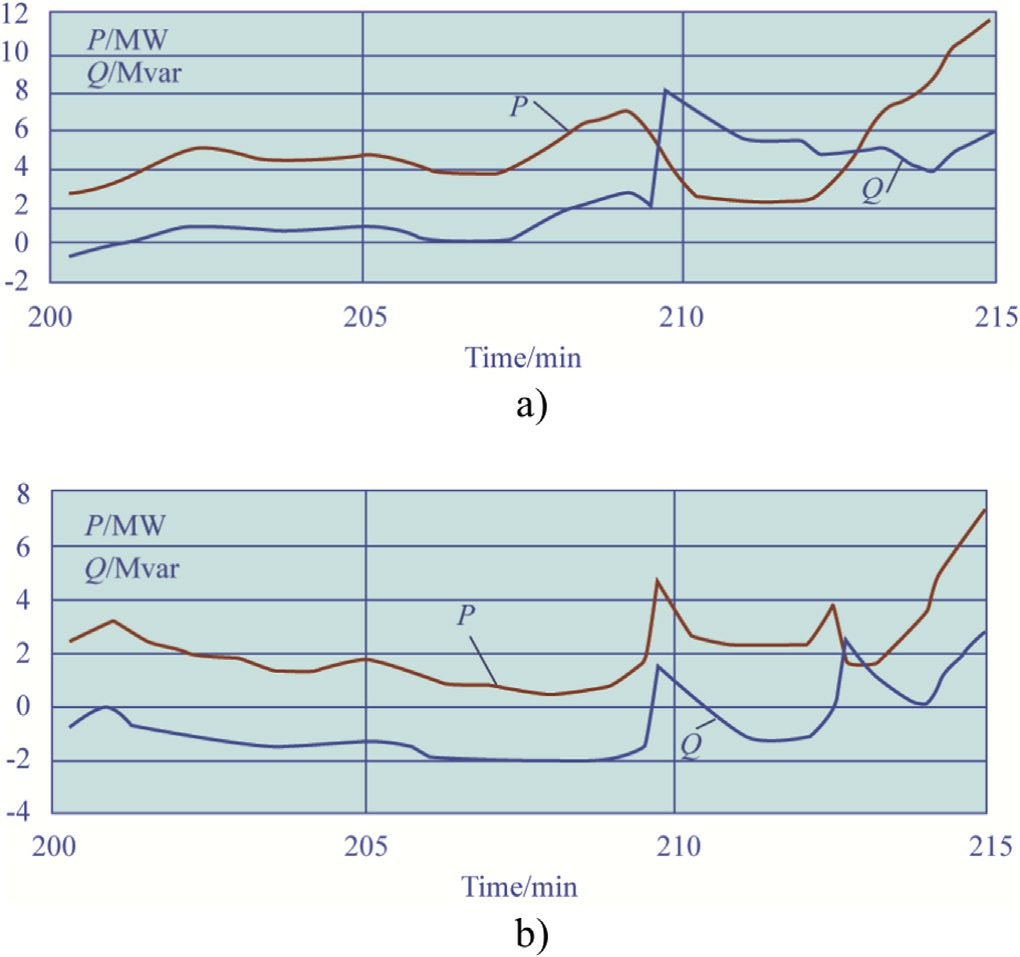
Fig.7.Power flows from TS A to TS B by sections:a section No.1;b section No.2.
The values of power consumption by trains with a breakdown by ISA feeder arms were calculated according to Step 13 of the procedure and are presented in Table 1.Fig.12 shows the time dependencies of power losses along the sections between trains that change in time given traction network ohmic resistance of 0.182 Ω/km.
Calculations of errors due to incomplete accounting of the first and last intervals ΔtD, as well as distribution of losses between individual trains are presented in Table 1.
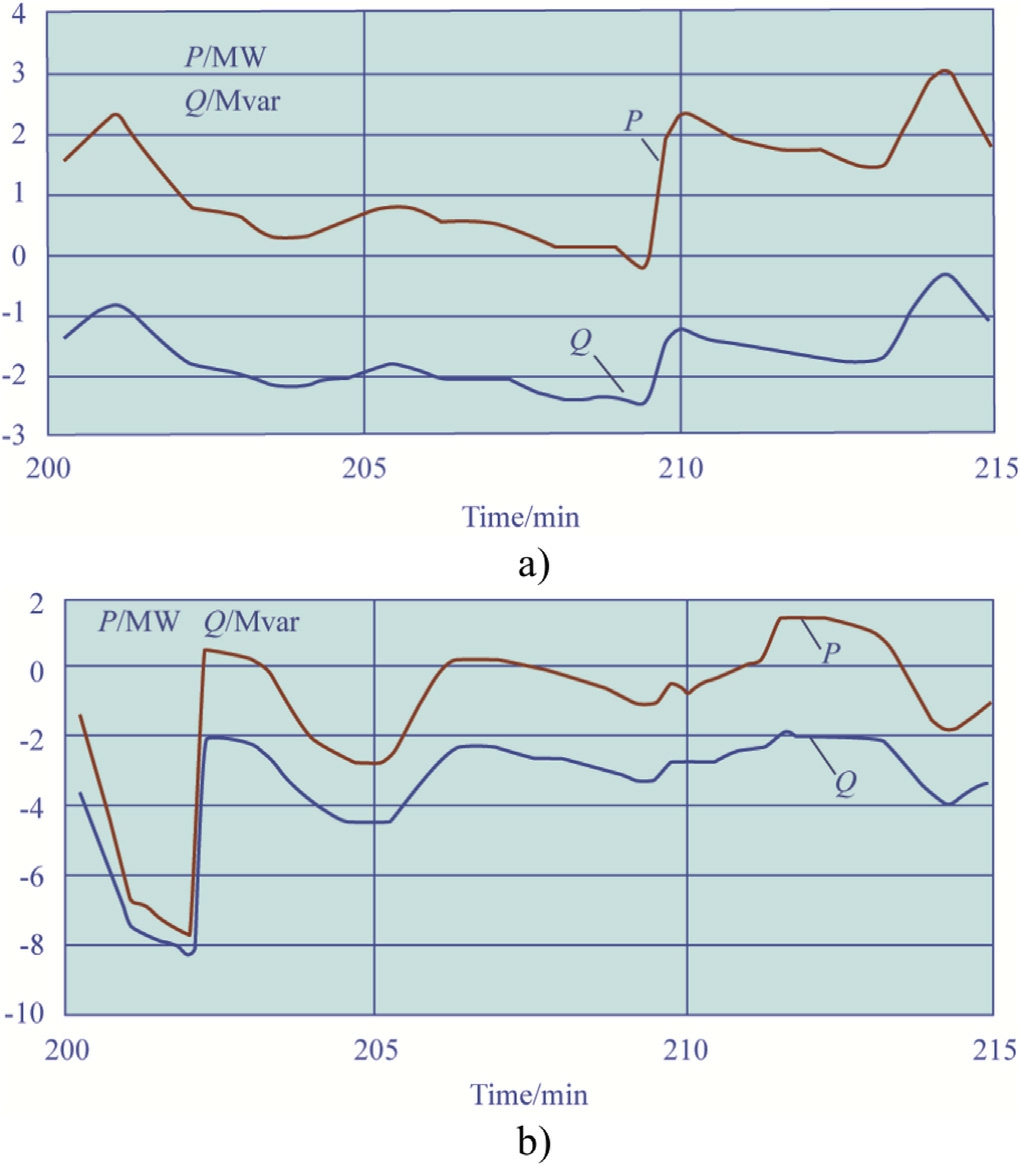
Fig.8.Power flows from TS A to TS B by sections:a section No.3;b section No.4.
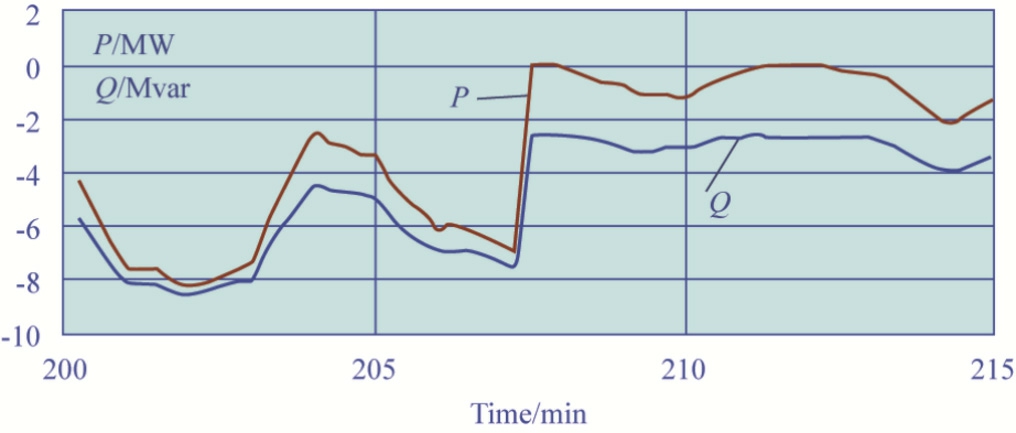
Fig.9.Power flows from TS A to TS B along section No.5.
As follows from the data in Table 1 and calculations using formula (70), the permissible difference between the estimated and conditional losses ΔW Σ is 47.5/5 = 9.5 kW h.Their actual difference was 6.7 kW h, which is within the permissible differences.In addition, Table 1 summarizes the total electricity consumption by trains and the distribution of electricity consumption by adjacent substations.
5 Algorithm for energy efficiency calculation from ASCAPC data
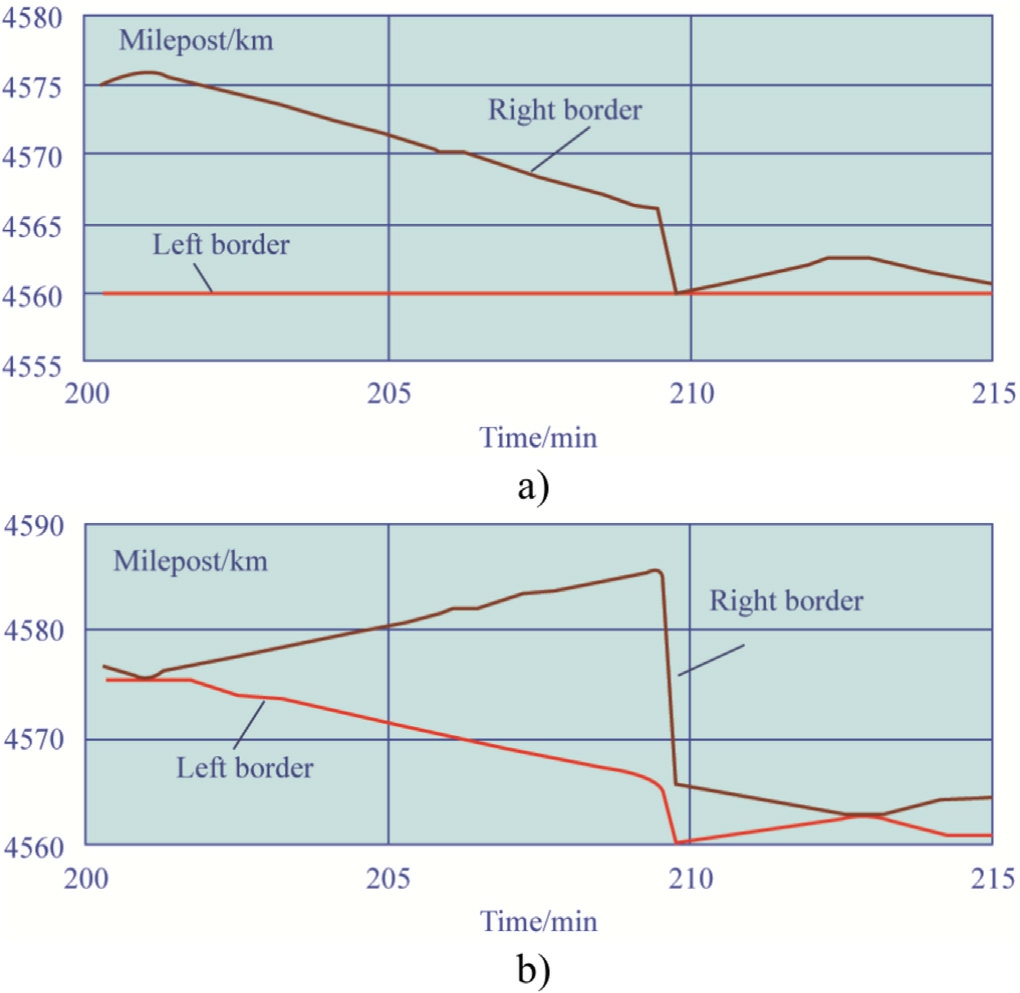
Fig.10.Dynamic boundaries: a Area 1; b Area 2.
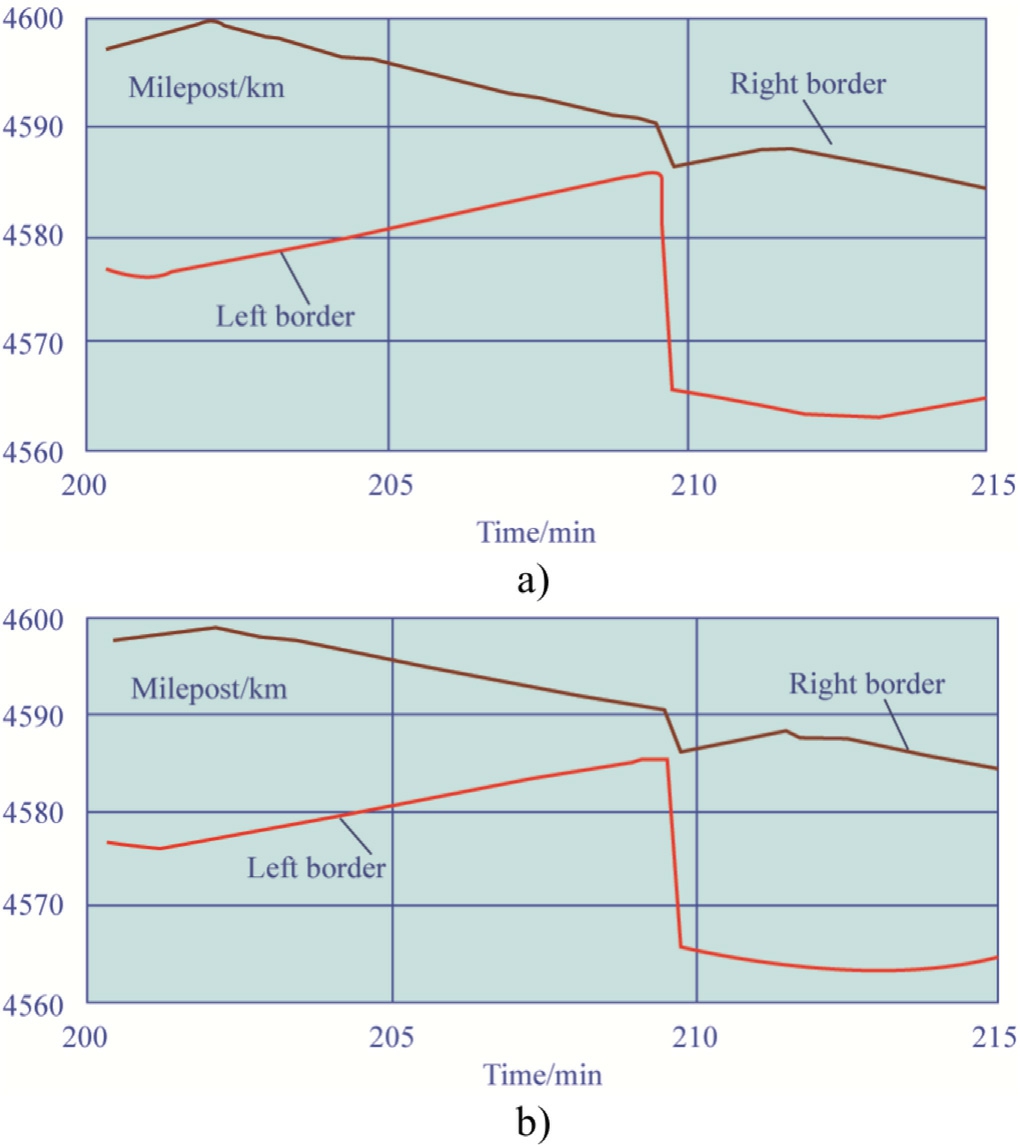
Fig.11.Dynamic boundaries: a Area 3; b Area 4.
A possible way to calculate losses occurring in traction network components is load flow analysis of instantaneous circuits of inter-substation areas at specified time intervals,provided the availability of information about each train and load flow parameters at the feeder arms of adjacent traction substations.This technique is consistent with the on-line calculation method and proves optimal when appropriate ASCAPC data are available.The calculated load flow of the ISA makes it quite simple to break down the power consumed by trains by individual ISA feeder arms and break down power losses by individual trains.Given the values of instantaneous feeder powers of adjacent traction substations,it is possible to monitor the consistency of data on consumption by trains, power losses,and traction substation powers.Assuming constant powers within the time interval up to the next instantaneous circuit,the active and reactive power consumption by traction substations is calculated with their breakdown into consumption by individual trains and with losses attributed to individual trains.
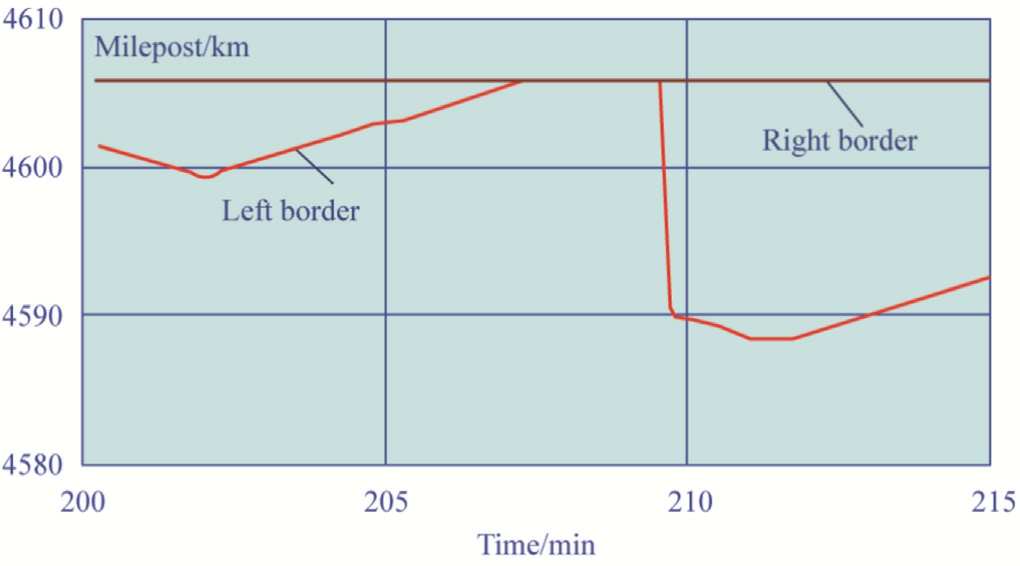
Fig.12.Dynamic boundaries of Area 5.
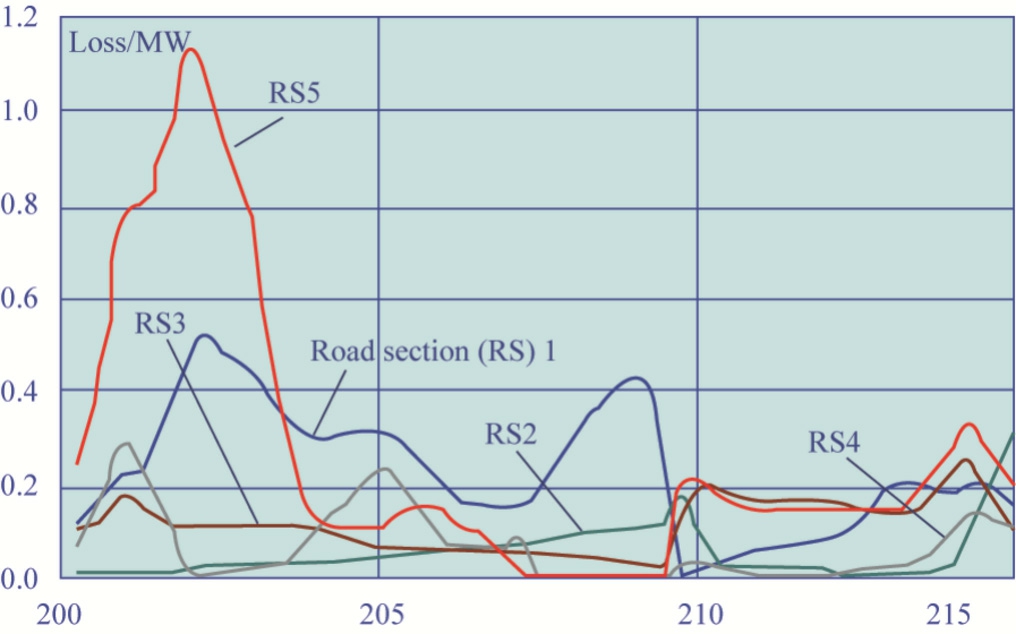
Fig.13.Time dependency of power losses in dynamic sections.
We assume a single-track or double-track railway section between two adjacent substations; no information on the external power supply system is required if load flow measurements are available with a breakdown by ISA feeder arms.Furthermore, it is assumed that there are no non-traction loads connected to the traction network.The permissible unbalances of electricity consumption are estimated by the errors of the measuring instruments used.
The algorithm underpinning the technique for power flow analysis in ISAs is as follows.
1.Based on the information on the structure of the traction network and instantaneous location of trains,determine the topology of the electrical circuit in accordance with Fig.14, where TSS1, TSS2 adjacent traction substations feeding the ISA; LF1, LF2, OCS1,OCS2 line feeds and overhead catenary systems of the double-track section, and there are no line feeds in 25 kV system;trains of odd and even directions are connected, according to the mileposts of their instantaneous position, to the overhead catenary systems of the corresponding track, odd trains are those moving in the direction of decreasing mileposts;R rails,without treating separately individual rail lines;SS1,PCP1-the switching station and parallel connection point located at the corresponding mileposts; AT1 autotransformers of the 2  25 kV system that are absent in the 25 kV ETN; TN1
 TNn
TNn sections of homogeneous traction networks,the lengths of which are determined by the location of stationary facilities and trains.We define a homogeneous section as the one having the same wires along its entire length with the same overall size of their arrangement.If the number of wires is changed(e.g.,when a line feeder is introduced),an independent section must be delimited.
If reactive power compensation units are available, they are accounted for by shunt capacitances at the respective nodes;the conductance’s of the shunts are determined from the effective power of the RPCU and its nominal voltage.
2.Calculate the instantaneous values of train currents (or power consumption), voltages and currents (or power flows)of feeders TS1 and TS2 based on ASCAPC data.For voltages and currents, one needs the moduli and phases of these quantities, and when specifying the power consumed by trains and feeder power,the moduli of traction substation voltages and phase angles between TS1 and TS2 voltages are required.
Table 1 Breakdown of train powers by feeder arms.

Train WakA, kWh WakB, kWh Wak, kWh nk Wak/nk Wsk, kWh Δ Wak + ΔW 5 758.9 0 758.9 60 12.65 960.23 14.6 773.5 7 133.3 185.9 319.2 60 5.32 398.47 6.1 325.3 14 70.6 578.3 648.9 29 22.38 807.53 12.3 661.2 16 209.5 31.3 240.8 60 4.01 271.24 4.2 245.0 18 68.4 0 68.4 22 3.11 458.35 7.0 75.38 W Total 1240.7 795.5 2036.2 47.5 2895.8 44.2 2080.4

Fig.14.ISA generalized circuit.
Load flow analysis based on specified currents has its advantages and downsides as compared to specifying powers.The specified train currents correspond to a system of linear algebraic equations with a unique solution.A more elaborate iterative methods is employed to perform calculations in terms of specified powers.However, in the case of the current of AC locomotives deviating significantly from the pure sine wave, these calculations yield results that align with real-life values better.
The phase angle between the arm voltages of TS1 and TS2 is needed to account properly for possible equalizing currents.If feeder powers of TS1 and TS2 are known, it is possible to do away with information about the voltage angles of feeder arms.In this case TSS1 busbars are assumed to be balancing δU-nodes with a specified voltage and zero voltage angle,and TS2 busbars are assumed to be PU-nodes with a fixed voltage modulus and a given active power generation determined from telemetering data.An alternative option with respect to how to treat TS2 busbars may be to assume them to be a PQ-node with specified active and reactive power generation.The latter option may be the most preferable in terms of consistency of telemetry data.
3.According to the given arrangement of wires of multiwire systems of TS1 TSn and their parameters, perform load flow analysis for equivalent lattice circuits of traction network sections as per the technique reported in[20](or use the ones prepared in advanced).
4.Calculate the parameters of the autotransformer equivalent circuit (or use existing ones).
5.Assemble the equivalent model by combining the lattice circuits of individual components according to Fig.14.One such possible assembly can be the one arrived at by specifying the node numbers of the components to be connected: if two components have the same node number, the node is common to both components.
6.Declare the nodes of feeder arms of TS1 and TS2 to be balancing with moduli and phases of voltages fixed,with a possible variation afforded for by Item 2.Perform instantaneous circuit load flow analysis to determine power flows by traction network sections.
7.Assuming a positive direction of power flow from TSS1 to TSS2, break down active and reactive power consumption by trains fed from traction substations.For this purpose, audit the flow through the traction power network to the left of the train and to the right of the train (Fig.15).The traction network includes all wires, including rails and feeder wires of the 2 25 kV system.
Reactive power is consumed by the AC locomotive regardless of whether it moves in the traction or regeneration mode.Two variants of the combination of active and reactive power flow signs to the left and right of the train are possible:
both flows have the same sign; whereby the difference between the flow to the left and the flow to the right of the train is attributed to TSS1 as the power consumed(or served)by the train if the flows are positive,or the difference between the flow to the right and the flow to the left of the train is attributed to TSS2 if the flows are negative;
flows to the left and right of the train have different signs; and the flow to the left with its sign corresponds to the part of the train power consumed from TS1,whereas the flow to the right of the train, with the minus sign,corresponds to the part of the power consumed from TS2; taking into account the sign is necessary due to the presence of equalizing currents capable of distorting the power flow.
If one or more regenerating locomotives are available,it is advisable to perform the breakdown by source as follows.After preliminary load flow analysis of the instantaneous circuit, the generation of one of the regenerating locomotives is reduced by a certain value (e.g., 10%) and the new load flow is analyzed.The resulting reduction in power consumption by adjacent substations allows the total active power consumption by traction substations from the regenerating locomotive to be recalculated proportionally.Part of the generation output is absorbed by neighboring locomotives operating in the traction mode.Calculations under a small reduction in generation allow keeping the losses close to the initial load flow without introducing noticeable errors.
8.Divide total power losses by traction network components and autotransformers by individual trains in proportion to the percentage of the train’s total power in the consumption from traction substations.
9.Calculate the power consumption values by simply multiplying the powers by the time interval covered by the calculation.
10.According to the data on errors of measuring instruments,check whether deviations between the calculated powers of traction substations and the powers obtained by telemetering from metering devices falls within a permissible range.
In the absence of information on voltages and currents of traction substations, the load flow analysis technique can be coupled with the balance-based technique to expand the possibilities and improve the accuracy of thelatter in case of regenerating locomotives and the availability of an RPCU at switching stations.

Fig.15.Active power flows along the traction network sections near the locomotive k in the traction mode and near regenerating locomotive.
Based on the above, it can be concluded that the proposed algorithm corresponds to the method of operational calculations and is optimal in the presence of ASCAPC data.On its basis, the distribution of power consumed by electric locomotives by power supply arms and power losses by trains can be performed.In this way, the problem of addressability of electricity consumption is solved in the presence of various electricity suppliers.In addition, it is possible to control the consistency of data on consumption by trains, losses and capacities of traction substations.On this basis,it is possible to reasonably approach the selection of measures to improve energy efficiency and reduce financial costs for energy supply of transportation processes.
6 Conclusion
The traction power supply system of AC electrified railways has the following key defining features:
transient and highly variable nature of single-phase traction loads moving in space;
the possibility of regenerative power generation by locomotives with significant reactive power consumption;
notable voltage unbalance on busbars of traction substations due to single-phase traction loads;
electric and magnetic interference of the traction network affecting adjacent lines of automatic block signaling and series power supply.
These features should be taken into account when solving problems of power loss calculation; in particular, they call for a rather brief time interval between power consumption readings and the need to take into account the loads of individual phases of the traction transformer.
We have proposed a balance-based technique for power loss calculation and source breakdown of power consumption in the traction network.The technique is based on data on power consumption by individual feeder arms of traction substations and power consumption by rolling stock.It is also informed by the location of trains in space.The technique has been implemented in the form of an algorithm tested on real-life data and is ready for practical use.
Real-life applications of the techniques and algorithms reported here will be instrumental in reducing losses and cutting expenses resulting from the power supply of transportation processes.As is well known,such processes consume significant amounts of electricity.These tasks are notably gaining in relevance against the current backdrop of a continuous increase in rail traffic.
The described version of the technique has power losses calculated at the fundamental frequency, but it will take only minor adjustments to account for those additional components as well.
The technique aims at the on-line calculation of energy efficiency and breakdown of power consumption by source for AC railroad traction networks.However, generalizing it to DC railway systems would be rather straightforward.This task is the topic of planned future research by the authors.
The tasks formulated in the introduction are solved with correct consideration of all influencing factors and the availability of a large volume of information on the modes of electric rolling stock and traction substations,including currents, voltages, power factors, location of electric locomotives, and power flows flowing in the traction network.To ensure the adequacy of modeling, the use of ASCAPC data is provided and control is implemented to ensure the absence of contradictions between them and the calculation results.
The article presents a balance method for determining the addressability of electric power consumption by trains and calculating technical losses of electric power in the 25 and 2x25 kV traction network,as well as in traction transformers.The proposed method takes into account the asymmetric traction load of the 25 kV system and the features of 2x25 kV traction networks.The method for determining the addressability of electric power losses according to ASCAPC data is described.Relationships for determining errors are presented.Criteria for monitoring the adequacy of the results obtained are proposed.
CRediT authorship contribution statement
Konstantin Suslov: Visualization, Supervision,Resources, Project administration, Investigation, Funding acquisition,Conceptualization.Andrey Kryukov:Writingreview & editing, Writing - original draft, Visualization,Supervision, Software, Methodology, Formal analysis,Data curation, Conceptualization. Aleksandr Cherepanov:Writing -review &editing, Writing - original draft,Visualization, Validation, Supervision, Resources, Methodology, Investigation, Formal analysis, Conceptualization.Andrey Batukhtin: Writing - original draft, Visualization,Resources, Formal analysis, Data curation. Yanhong.Luo:Writing-original draft,Validation,Formal analysis,Data curation.
Declaration of competing interest
The authors declare that they have no known competing financial interests or personal relationships that could have appeared to influence the work reported in this paper.
Acknowledgments
The research was carried out within the state assignment of Ministry of Science and Higher Education of the Russian Federation (theme №123102000012-2 ‘‘Comprehensive study of aerodynamic characteristics of plasma systems of thermochemical fuel preparation”, agreement№075-03-2023-028/1 of 05.10.2023).
References
-
[1]
J.Sˇiroky´, P.Nachtigall,E.Tischer,K.Schejbal,T.Micha´lek, The modelling of traction energy consumption of a container train,Transp.Res.Procedia 77 (2024) 76-84. [百度学术]
-
[2]
H.Hayashiya,T.Suzuki,K.Kawahara,T.Yamanoi,Comparative study of investment and efficiency to reduce energy consumption in traction power supply: a present situation of regenerative energy utilization by energy storage system,2014 16th International Power Electronics and Motion Control Conference and Exposition,2014. [百度学术]
-
[3]
H.Hayashiya, T.Makino, T.Akiyama, S.Kobayashi, M.Ogiwara, M.Nakajima, A.Matsumoto, Evaluation of energy saving effect of traction power supply voltage in urban electric railway system, 2018 20th European Conference on Power Electronics and Applications (EPE’18 ECCE Europe), 2018. [百度学术]
-
[4]
H.Hayashiya, S.Kikuchi, K.Matsuura, M.Hino, M.Tojo, T.Kato,M.Ando,T.Oikawa,M.Kamata,H.Munakata,Possibility of energy saving by introducing energy conversion and energy storage technologies in traction power supply system, 2013 15th European Conference on Power Electronics and Applications(EPE), 2013. [百度学术]
-
[5]
Y.A.Konstantinova, V.N.Li, E.Y.Tryapkin, Enhancing energy efficiency of 25 kV traction power system due to balancing current decrease, 2018 International Multi-Conference on Industrial Engineering and Modern Technologies (FarEastCon), 2018. [百度学术]
-
[6]
T.Hirano, S.Kikuchi, T.Suzuki, H.Hayashiya, Evaluation of energy loss in D.C.traction power supply system, 2015 17th European Conference on Power Electronics and Applications(EPE’15 ECCE-Europe), 2015. [百度学术]
-
[7]
H.Novak,V.Lesˇic´,M.Vasˇak,Hierarchical coordination of trains and traction substation storages for energy cost optimization,2017 IEEE 20th International Conference on Intelligent Transportation Systems (ITSC), 2017. [百度学术]
-
[8]
H.Novak, V.Lesˇic´, M.Vasˇak, Hierarchical model predictive control for coordinated electric railway traction system energy management, IEEE Trans.Intell.Transp.Syst.20 (7) (2019). [百度学术]
-
[9]
W.Liu,J.Zhang,H.Wang,T.Wu,Y.Lou,X.Ye,Modified AC/DC unified power flow and energy-saving evaluation for urban rail power supply system with energy feedback systems, IEEE Trans.Veh.Technol.70 (10) (2021). [百度学术]
-
[10]
S.Zhang, S.Yang, T.He, Q.Liu, M.Wu, Real-time energy management strategy for flexible traction power supply system,Int.J.Electr.Power Energy Syst.156 (2024) 109768. [百度学术]
-
[11]
M.Botte, L.D’Acierno, A.Di Pasquale, F.Mottola, M.Pagano,Optimal motion of a rolling stock fleet under traction power system constraints, IEEE Trans.Transp.Electrif.9 (1) (2023). [百度学术]
-
[12]
H.J.Kaleybar, H.M.Kojabadi, M.Brenna, F.Foiadelli, D.Zaninelli, An intelligent strategy for regenerative braking energy harvesting in AC electrical railway substation, 2017 5th IEEE International Conference on Models and Technologies for Intelligent Transportation Systems (MT-ITS), 2017. [百度学术]
-
[13]
I.Perin,P.F.Nussey,U.M.Cella,T.V.Tran,G.R.Walker,Application of power electronics in improving power quality and supply efficiency of AC traction networks,2015 IEEE 11th International Conference on Power Electronics and Drive Systems,2015. [百度学术]
-
[14]
A.Andreotti, A.Di Pasquale, M.Pagano, Ravichandran, F.Volpe, An optimal centralized control strategy for regenerative braking energy flow exchanges in DC railway traction systems,2022 International Symposium on Power Electronics, Electrical Drives, Automation and Motion (SPEEDAM), 2022. [百度学术]
-
[15]
K.Wang, H.Hu, J.Chen, J.Zhu, X.Zhong, Z.He, System-level dynamic energy consumption evaluation for high-speed railway,IEEE Trans.Transp.Electrif.5 (3) (2019). [百度学术]
-
[16]
A.Bani, K.Awodele, Assessment of energy management opportunities in a DC traction network: case study: passenger rail agency of South Africa,Western Cape,2017 IEEE AFRICON,2017. [百度学术]
-
[17]
Z.Cheng, M.Chen, Y.Liu, Y.Cheng, A two-level energy management model for railway substation with POC and energy storage, 2020 15th IEEE Conference on Industrial Electronics and Applications (ICIEA), 2020. [百度学术]
-
[18]
A.A.Komyakov,M.M.Nikiforov,V.V.Erbes,V.T.Cheremisin,V.I.Ivanchenko, Construction of electricity consumption mathematical models on railway transport used artificial neural network and fuzzy neural network, 2016 IEEE 16th International Conference on Environment and Electrical Engineering (EEEIC), 2016. [百度学术]
-
[19]
I.K.Iliev, A.V.Kryukov, K.V.Suslov, A.V.Cherepanov, N.Q.Hieu, I.H.Beloev, Y.S.Valeeva, Modeling the operating conditions of electric power systems feeding DC and AC traction substations, Energies 17 (18) (2024) 4692. [百度学术]
-
[20]
V.P.Zakaryukin, A.V.Kryukov, in: Complex Unbalanced Load Flows of Electrical Systems, Publishing House of Irkutsk State University, Irkutsk, 2005, p.273 (in Russian). [百度学术]
-
[21]
V.P.Zakaryukin, A.V.Kryukov, ‘‘Determination of electricity losses and targeting of electricity consumption in traction power supply systems according to ASCAPC,Probl.Energy 11-12(2011)72-82 (in Russian). [百度学术]
-
[22]
Y.N.Bulatov, A.V.Cherepanov, A.V.Kryukov, K.Suslov,Distributed generation in railroad power supply systems, in:Proceedings of 2020 3rd International Colloquium on Intelligent Grid Metrology, SMAGRIMET, 2020, pp.54-60(9264013). [百度学术]
Fund Information

