Recommended articles:
-

-
Global Energy Interconnection
Volume 8, Issue 4, Aug 2025, Pages 700-718
Study on the investment and construction models and value assessment of shared energy storage in the context of the new power system
Abstract
Abstract
0 Introduction
Traditional power systems are increasingly struggling to meet the flexible dispatching requirements mandated by the ‘‘carbon peaking and carbon neutrality goals of China”, facing significant challenges in accommodating the variability and uncertainty of renewable energy sources[1-3].To address these bottlenecks, China released the‘‘14th Five-Year Plan” for the Development of New Energy Storage in 2022, noting that: ‘‘New energy storage constitutes a critical technology and foundational equipment for developing a new-type power system, serves as a crucial pillar for achieving carbon peak and carbon neutrality goals”.The plan advocates for exploring and promoting the shared energy-storage model, encouraging new-energy power plants to deploy storage facilities through self-investment, leasing, or purchasing, to maximize the comprehensive benefits of cross-scenario storage sharing.
Shared energy storage,which optimizes energy management and achieves system cost reduction by enabling collaborative utilization of storage resources, is regarded as a viable pathway to enhance renewable energy integration[4,5].Its development not only facilitates improved renewable energy utilization and mitigates environmental externalities,but also optimizes power resource allocation over broader geographical scopes [6].However, conflicting objectives among stakeholders and inherent supply-demand uncertainties pose new management and governance challenges for the large-scale deployment[7,8].Within this emerging paradigm, reducing construction costs and optimizing resource allocation are pivotal for overcoming existing bottlenecks [9].
Existing research predominantly focuses on single economic indicators or individual stakeholders, offering insufficient support for large-scale deployment; while the high upfront investment and operational cost remains a main barrier [10].To tackle the core challenges in the‘‘multi-party collaboration and achieving a closed-loop investment and construction model,” this paper further the investigation in the following aspects:
First, conducting a comprehensive quantitative comparison among Centralized Self-Built Shared Energy Storage model(CSSES),Third Party Investment-Based Shared Energy Storage model(TISES),and Distributed Self-Built Shared Energy Storage model (DSSES) under a unified cost-benefit framework.
Second, integrating the entropy weight-based Analytic Hierarchy Process(AHP)and Technique for Order Preference by Similarity to Ideal Solution(TOPSIS)methodologies to derive robust rankings for these models (CSSES/TISES/DSSES).
Third, performing the sensitivity analysis focusing on the interaction between ‘‘peak-valley electricity price spread” and ‘‘energy storage costs”, while incorporating carbon pricing and renewable energy certificate(REC)revenues to derive the thresholds of Internal Rate of Return(IRR) for all shared storage models.
1 Literature review
1.1 Concept and potential of the shared energy storage
Shared energy storage, as a flexible resource, enhances the resiliency of ECs by storing excess energy during optimal periods,injecting power during high demand or emergencies, ensuring an uninterrupted supply, and mitigating grid dependencies [11].Existing studies agree that shared energy storage creates mutual benefits: storage owners can maximize returns by selling their capacity to multiple users, while users without storage facilities can still access critical energy buffering services.Recent research underscores how effective coordination among multiple users enhances operational efficiency and reduces costs for both parties.In addition to these findings, scholars have explored the integration of digital trading platforms with shared energy storage to enable real-time capacity exchanges and peer-to-peer (P2P) trading, leveraging blockchain or other secure ledger technologies to reduce transaction costs and enhance transparency [12,13].These digital solutions can further streamline operations by automating energy trading contracts and settlement processes.Beyond its economic advantages, shared storage is recognized for its potential to bolster grid stability and reduce carbon emissions by incorporating renewable energy resources, promoting a more sustainable electricity sector overall.
1.2 Investment and construction models and operational strategies
In terms of investment and construction models,multiple approaches have been proposed and evaluated under diverse scenarios.Wu et al.[14] introduced the penalty mechanism of energy storage configuration, and proposed a joint optimization scheme of multiple profit modes of independent energy storage system for independent power producers with self-configuration energy storage.Drawing from real-world deployments on the grid side, Hu et al.[15] analyzed the policy environment and power system reforms in China, outlining regulatory recommendations that would stimulate healthy growth in grid-scale shared storage.Further broadening the analytical perspective,Zhang et al.[16] introduced a multi period power supply chain network model including SES, and studied its operation strategy in a competitive environment, including scheduling, bidding and determination of key energy storage parameters.Similarly,Zhou et al.[17]proposed a benefit evaluation method for self-built, leased and shared energy storage modes of renewable energy power stations,which provides a quantitative reference for the rational selection of energy storage modes of renewable energy projects.In more recent work, researchers have emphasized the role of innovative financing mechanisms—for instance,revenue-sharing contracts and cooperative funds—to mitigate investment risks associated with large-scale storage projects [18-20].Likewise, studies have underscored that government incentives, policy clarity, and stakeholder coordination remain critical to ensuring that the benefits of shared energy storage are fairly distributed across different participants in the energy market.
1.3 Economic and environmental value assessment
Evaluating the value of shared energy storage from a cost-benefit perspective remains a central research topic.The sharing economy mode can promote an optimal allocation and utilization of resources,and its integration with the energy storage and renewable energy can improve their utilization rate and reduce the dispatching deviation.In order to reduce the renewable energy dispatching deviation and improve profits of shared energy storage, this paper proposes a shared energy storage commercial operation mode considering the power transaction satisfaction of renewable energy plants[21].Lin et al.[22]proposed an energy storage coordination and optimization model led by distribution system operator (DSO) and participated by multiple VPPS and SES.Li et al.[29]proposed a shared energy storage system model integrating self-built and lease modes.The proposed shared energy storage planning model can significantly improve the economy of energy storage investment and system operation.Even under budget constraints, compared with the model relying only on self-built or lease modes, it also reduces the dependence of microgrid clusters on shared energy storage and distribution networks.In order to scientifically and reasonably evaluate the operational efficiency of grid side energy storage power plants,Wang et al.[23]proposed an evaluation method based on the combination weight TOPSIS model and established a relatively complete evaluation index system;The subjective and objective weights of the indicators are calculated using the Analytic Hierarchy Process and Entropy Weight Method, respectively.The results validated the rationality and effectiveness of the proposed indicators and evaluation methods.Liu et al.[24]proposed the KPCA-DBO-LSSVM model, a new comprehensive evaluation method for shared energy storage in power systems, which has higher accuracy and robustness.From a game-theoretic angle, Yang et al.[7] constructed an economic social environmental evaluation framework for shared energy storage and quantified the interests,responsibility allocation, and profit potential of stakeholders using the Analytic Hierarchy Process.Finally,the analysis of the positive externalities of subsidy policies and widening the peak valley gap provides policy insights for a cleaner, more resilient, and sustainable energy system, Cui et al.[25] proposed a dual-layer pricing model for shared energy storage systems based on mixed-game theory and its solution method., while He et al.[26] proposed a joint planning method of shared energy storage operator seso and multi-energy microgrid mEMG alliance based on complete information dynamic game.Compared with other corresponding planning methods,the proposed bilevel optimization method can increase the net income of seso by 1.47%, and reduce the average planning cost of each mEMG by at least 1.7%, Recent studies have additionally demonstrated how lifecycle analysis—covering manufacturing, operation, and disposal—helps quantify the broader ecological and economic impacts of these systems[27,28].By integrating sustainability metrics with cost modeling, researchers provide a more holistic appraisal of shared energy storage,confirming its potential as a pivotal technology in the transition toward greener and more resilient power systems.
Overall, the scholars have increasingly focused on the investment and construction models and value assessments of shared energy storage, adopting methods such as costbenefit analyses and comprehensive evaluation index systems.They provide valuable references and theoretical support for the development of shared energy storage;however, several challenges remain unresolved:
First, insufficient Comprehensive Consideration.Existing research tends to emphasize short-term economic benefits and technical feasibility, often overlooking long-term and holistic factors such as environmental impact and social benefits.This gap hinders the sustainable development of shared energy storage.
Second,unclear application scenarios of the investment and construction model.Although numerous investment and construction models have been proposed, the definitions and classifications for specific application scenarios are not yet well-established.There remains a lack of indepth investigation and empirical validation regarding which investment and construction models are most suitable for different contexts.
Third, incomplete Profit Distribution Mechanisms.Current profit-sharing arrangements for multiple stakeholders are still underdeveloped.Determining a fair and efficient allocation of profits across various users and investors, remains a concern.
To overcome these limitations, this paper conducts a value oriented analysis of shared energy storage within the context of the new power system and refines its investment and construction models.Specifically, three models are examined: (1) the Centralized Self built Shared Energy Storage model (CSSES), (2) the Third party Investment Shared Energy Storage model (TISES), and(3)the Distributed Self built Shared Energy Storage model(DSSES).The study then introduces five profit mechanisms—contract energy management, two part tariff,ancillary services market, spot market, and a comprehensive model—and evaluates how each mechanism affects the economic performance of shared energy storage.Finally,to identify the optimal combination,a multi criteria decision making approach is employed,first applying a hybrid entropy weighting analytic hierarchy process(AHP) to obtain composite evaluation scores, and subsequently using the Technique for Order Preference by Similarity to Ideal Solution (TOPSIS) for final model selection.This systematic methodology clarifies the economic outcomes of various shared energy storage strategies and assists stakeholders in selecting the most suitable model for diverse practical scenarios.
2 Design and cost-benefit analysis of investment and construction models for shared energy storage
Shared energy storage is an innovative commercial application that combines traditional energy storage technology with the sharing economy, providing practical solutions to address related challenges.Its investment and construction model are firstly designed and analyzed from the cost-benefit perspective, in order to optimize resource allocation, reduce initial capital requirements, balance the interests of all parties, and provide theoretical and practical guidance for the sustainable deployment of shared energy storage.
2.1 Investment and construction models of shared energy storage
Investment in shared energy storage can be undertaken by a single investor, joint investors, or social capital through leasing models.Different investment and construction models result in variations in the operation,profit, and benefit distribution of shared energy storage.Therefore, before designing an investment and construction model, it is essential to clarify the investment entities of shared energy storage and analyze the corresponding profit and benefit distribution patterns.Based on the relationship between public energy storage and user participants, the investment and construction models for shared energy storage can be categorized into three types: Centralized Self Built Shared Energy Storage (CSSES), Third party investment based shared energy storage (TISES)and Distributed Self Built Shared Energy Storage(DSSES).
Under the framework of the CSSES model, multiple users pool their funds to jointly construct a public energy storage facility that provides services to multiple users,meeting their respective storage needs.This model reflects the core principles of resource-intensive utilization and the shared economy, as illustrated in Figs.2-1.
For residential and small-scale commercial users,whose storage demands are modest and who are price-sensitive,finding a suitable storage module can be challenging.Thus, the TISES model (as shown in Figs.2-2) provides an efficient solution.In this model,a third-party operator,acting as an independent entity, is responsible for the investment, construction, operation, and maintenance of public energy storage facilities.The operator offers users storage capacity and charging/discharging services,thereby achieving optimal resource allocation and efficient utilization.
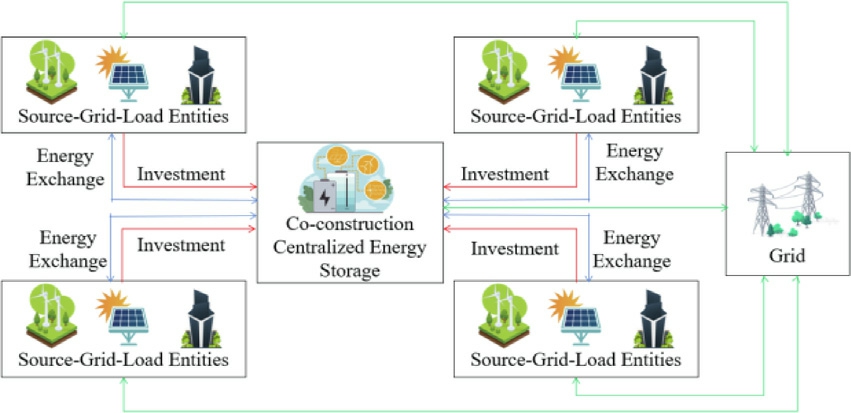
Fig.2-1.CSSES.
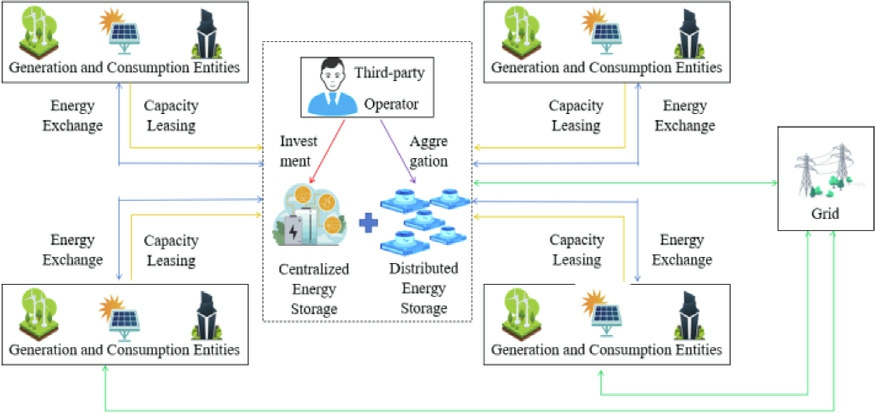
Fig.2-2.TISES.
In the DSSES model, each user installs independent storage equipment and can participate in energy trading(Figs.2-3).This model can be divided into two types:internal sharing among user groups, where users can both share their own storage with others and utilize others’storage, representing a bidirectional sharing; and external sharing with entities such as the grid, where users share their own storage with the grid but do not receive shared storage from the grid, representing unidirectional sharing.
Tables 1-1 summarizes the advantages and disadvantages of the aforementioned three models[1].This classification method distinctly clarifies the ownership and usage rights of shared energy storage,as well as the differences in their physical characteristics, which are core factors influencing the understanding of the interests and strategic choices among shared energy storage participants.Furthermore, based on different interest demands, the three major categories of shared energy storage models have been meticulously divided at the strategic level, aiming to more comprehensively and deeply reveal the uniqueness and complexity of each type of shared energy storage approach.
2.2 Methods and assumptions for cost and revenue accounting of the models of the shared energy storage
Estimating revenues and expenses is a crucial foundation for analyzing the profitability of shared energy storage systems.The accuracy and reliability of these estimates significantly impact the feasibility of the project.Below, the methods for cost accounting and revenue accounting of shared energy storage are introduced respectively.
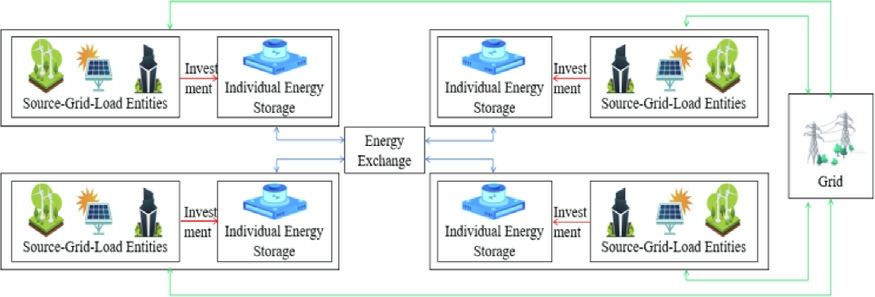
Fig.2-3.DSSES.
Table 1-1 Comparative analysis of the investment and construction models of the shared energy storage.
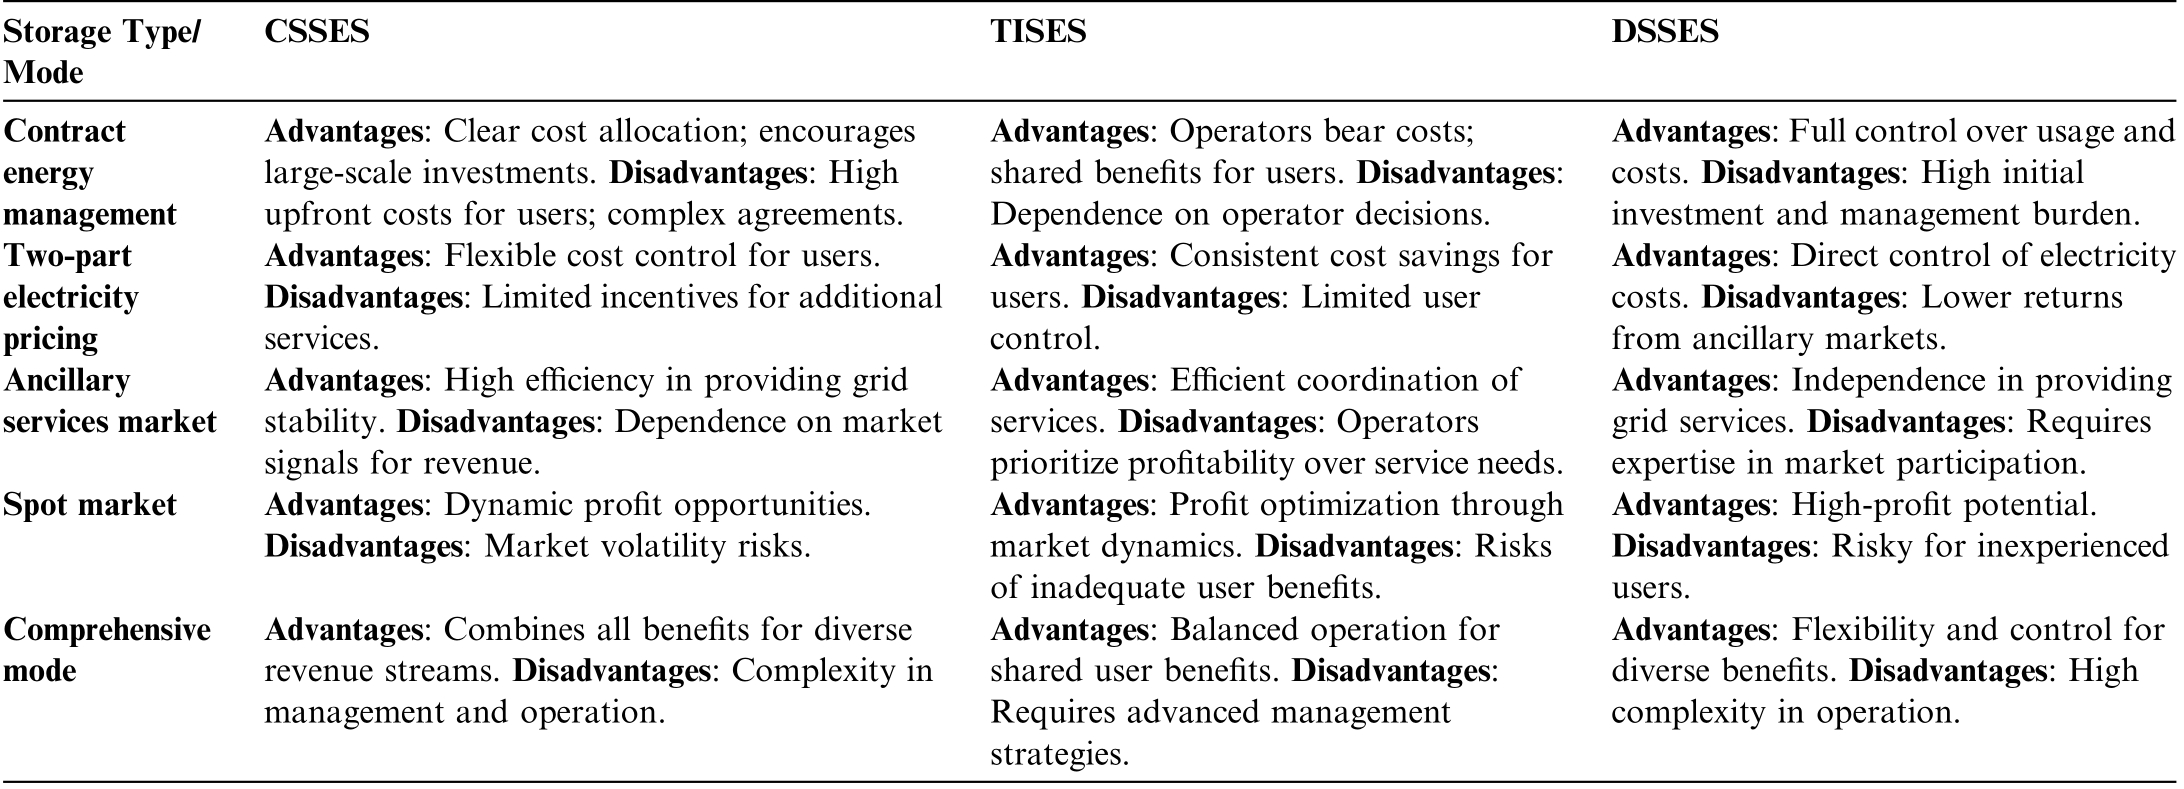
Storage Type/Mode CSSES TISES DSSES Contract energy management Advantages: Clear cost allocation; encourages large-scale investments.Disadvantages: High upfront costs for users; complex agreements.Advantages: Operators bear costs;shared benefits for users.Disadvantages:Dependence on operator decisions.Advantages:Full control over usage and costs.Disadvantages: High initial investment and management burden.Two-part electricity pricing Advantages: Direct control of electricity costs.Disadvantages: Lower returns from ancillary markets.Ancillary services market Advantages: Flexible cost control for users.Disadvantages:Limited incentives for additional services.Advantages: Consistent cost savings for users.Disadvantages: Limited user control.Advantages: High efficiency in providing grid stability.Disadvantages:Dependence on market signals for revenue.Advantages: Efficient coordination of services.Disadvantages: Operators prioritize profitability over service needs.Spot market Advantages: Dynamic profit opportunities.Disadvantages: Market volatility risks.Advantages: Profit optimization through market dynamics.Disadvantages: Risks of inadequate user benefits.Comprehensive mode Advantages: Independence in providing grid services.Disadvantages: Requires expertise in market participation.Advantages: High-profit potential.Disadvantages: Risky for inexperienced users.Advantages: Combines all benefits for diverse revenue streams.Disadvantages: Complexity in management and operation.Advantages: Balanced operation for shared user benefits.Disadvantages:Requires advanced management strategies.Advantages: Flexibility and control for diverse benefits.Disadvantages: High complexity in operation.
2.2.1 Selection and accounting methods of cost indicators for shared energy storage systems
The cost accounting of shared energy storage systems can be divided into five components,as shown in(2-1)[21].
Inthe formula,CI C represents the installation costof the energy storage batteries; CRC represents the replaceme ntcost of theenergy storage batteries per occurrence;COCrepresents the operation and maintenance costs;and CDCrepresents the recoverable valueoftheenergystorage system.
1) Installation cost
The installation cost of the energy storage batteries is the primary component of the shared energy storage system’s installation expenses.The energy storage battery equipment mainly consists of the battery itself,energy conversion devices, and necessary auxiliary facilities.The installation cost CIC is calculated as shown in (2-2).
In the formula, Cbat represents the cost of the batteries,Cpcs represents the cost of the energy conversion devices,and Cbop represents the cost of the necessary auxiliary facilities.
2) Replacement cost
The current project cycle for energy storage typically ranges from 5 to 20 years.However, the lifespan of the battery units generally does not reach 20 years.Consequently,there arises the issue of replacing the battery units within the project.The cost of a single battery replacement is calculated as shown in (2-3).
In the formula, α represents the annual average decline rate of the installation cost of the energy storage batteries;k represents the number of battery replacements; N represents the project cycle in years; and n represents the lifespan of the energy storage batteries in years.When![]() is not an integer, k is rounded up to the nearest integer.
is not an integer, k is rounded up to the nearest integer.
3) Annual operation and maintenance cost
The annual operation and maintenance cost of the shared energy storage system can be expressed as shown in (2-4).
Among them, CFOC represents fixed operation and maintenance costs; CVOC represents variable operation and maintenance costs.Management costs and labor costs are important components of CFOC.This part is unrelated to the operation process and mainly depends on fixed parameter indicators such as the technology type and power size of the energy storage system,as shown in(2-5).
In this equation, COMC is the operation and maintenance cost per unit power, and Prate is the rated power of the energy storage system.
In addition, CVOC includes many factors, such as electricity costs,fuel costs,new energy subsidies,CO2 emission c osts, etc.This causes CVOC to change with the external environment of the shared energy storage system as well as its own operating status.Considering the many factors,this section mainly selects the electricity co stCc, which accounts for a relatively large proportion in CVOC, to represent the size of CVOC, as shown in (2-6).
In this equation, Caec is the annual electricity cost per unit power of shared energy storage, calculated as shown in (2-7).
In this equation, Cp is the charging electricity price,t is the rated discharge time,η is the system efficiency,and D i s the number of operating days.
For the overall system, the relationship between the rated capacity and rated power is shown as follows.
In this equation, Erat e is the rated capacity of the shared energy storage system.
4) Recoverable value
Recoverable value refer to the recovery costs or secondary use costs incurred at the end of the service life of the energy storage system.Recoverable value is often a parameter that changes with the market and quotation.The Recoverable value is calculated by using the scrap cost rate, which refers to the ratio of the cost when the energy storage system is scrapped to the cost required for the initial construction of the energy storage system.The calculation formula is shown in (2-9).
In this formula, FE OL is the scrap cost rate.Some materials and devices in the energy storage power station have the value of recycling.The recycling cost of specific energy storage projects can be calculated directly by the sum of the costs of cleaning, disassembly, recycling and regeneration.
2.2.2 Selection and accounting methods of profitability indicators for shared energy storage systems
The main profitability indicators of shared energy storage projects include operating income obtained after project implementation, initial investment, financial internal rate of return,financial net present value,payback period,and others.Under the CSSES and DSSES, operating income refers to the cost savings from charging at low electricity prices and discharging at high electricity prices.In contrast, under the TISES, operating income comes from lease payments and peak-valley arbitrage income.
1) Total investment
The estimation of the total investment amount consists of the total investment of the multi-energy complementary project and the calculation of the annual investment expenditures required during the construction period of the multi-energy complementary project.The calculation formula is as follows [29]:
In this formula, ITP is the total investment of the project, IC is the construction investment, CID is the interest during the construction period, an dCW is the working capital.
2) Operating cost expenses
Operating costs and expenses refer to the various expenditures and their compensatory values incurred during the operation of the multi-energy complementary project.The calculation formula is as follows:
In this formula, CO is the operating cost,C T i s the total cost and expense, CD is depreciation,and C IE is the interest expense.
In this formula, CPE is personnel cost, C M is the material cost,![]() is the operation and maintenance cost,and COE is other expenses.
is the operation and maintenance cost,and COE is other expenses.
3) Operating income
In the centralized co-investment sharing model and the self-owned sharing model, operating revenue refers to the electricity cost savings achieved through low-price charging and high-price discharging, as shown in (2-13).In the TISES, operating revenue consists of lease payments and arbitrage income from peak and valley pricing, as shown in (2-14):
Operating Revenue for Centralized Co

Operating Revenue for TISES

4)Related taxes
Related taxes refer to the taxes paid from profit income due to business operations or the provision of services during the project’s operational production period.They mainly consist of city maintenance and construction tax,local education surcharge,education surcharge,etc.,based on the value-added tax payable.
5)Operating profit
Operating profit comprehensively reflects the results of the company’s production and business activities.The calculation formula is as follows:

6) Loan repayment of principal and interest
Loan repayment of principal and interest is an important indicator for measuring the project’s ability to repay.It refers to the repayment of the principal of fixed asset investment loans according to the requirements of national funding sources and lending institutions after the multi-energy complementary power system project is put into operation.The total annual production costs must account for interest expenses.The calculation formula based on equal principal repayment and interest payment is as follows:
In this equation, At represents the repayment amount of principal and interest in year t; Ic represents the construction investment(including interest during the construction period); n represents the loan term in years; and i represents the interest rate.
7) Recovery value
The recovery value mainly refers to the revenue obtained from the residual equipment through recycling after the operational period of the energy storage system ends.The calculation is as shown in (2-17).
In this equation, Cres is the residual value recovery rate of the energy storage equipment.
8) Internal rate of return (IRR)
As one of the project profitability indicators, the internal rate of return refers to the discount rate at which the net present value of cash flows equals zero during the project’s calculation period.When the financial internal rate of return is the benchmark return rate, the project can be considered financially acceptable.The calculation formula is as follows:
In this equation, FIRR represents the financial internal rate of return; CI represents the cash inflow in year t; CO represents the cash outflow in year t; and n represents the project’s calculation period.
9) Net present value (NPV)
Net present value is also an important indicator for evaluating the project’s profitability.It refers to the sum of the present values of net cash flows during the project’s calculation period, calculated using the discount rate set based on the benchmark return rate.When the financial net present value 0,the project can be considered financially acceptable.The calculation formula is as follows:
In this equation,FNPV is the net present value;C Iand COrepresent the cash inflow and outflow in year t,respectively; n represents the project duration; and r is the discount rate.
10) Present value of equity cash flows
The present value of equity cash flows refers to the sum of the present values of the project’s annual cash inflows minus cash outflows over the project’s lifespan, excluding the construction period.A larger value indicates better project feasibility.The calculation formula is as follows:

11) Price-to-book ratio (PB)
The price-to-book ratio is the present value of the project’s equity cash flows divided by the project’s own capital investment.It is used to describe the return on capital.When the price-to-book ratio>1,it indicates that the project has good feasibility.The calculation formula is as follows:

In this equation, PB represents the price-to-book ratio.
12) Static payback period
The static payback period is typically used to evaluate the financial feasibility of a project.It refers to the time required to repay the original investment using the project’s profits from the start of construction.When the static payback period the project’s lifespan, the project is considered feasible.The calculation formula is as follows:
In this equation,Pa represents the year when the cumulative net cash flow turns positive, Pb represents the absolute value of the cumulative cash flow in the previous year,and Pc represents the cash flow in the year when the cumulative cash flow turns positive.
13) Dynamic payback period
The dynamic payback period considers the time value of money in recouping the investment.When the dynamic payback period the project’s lifespan, the project is feasible.The calculation formula is as follows:
In this equation, Pd represents the year when the present value of the cumulative net cash flow turns positive,Pe represents the absolute value of the cumulative net cash flow present value in the previous year, and Pf represents the present value of the net cash flow in the year when the cumulative net cash flow turns positive.
2.2.3 Assumptions for case indicator values of three investment and construction models for shared energy storage
1) Basic assumptions
According to the ‘‘Notice on Matters Related to Formulating Pilot Electricity Pricing Policies to Support the Development of Independent Energy Storage,” the capacity of independent energy storage power stations participating in the competition should generally not be less than 100 MW, and the duration of continuous fullpower discharge should not be less than 4 h.To more comprehensively and accurately measure the operating revenue of shared energy storage, it is assumed that the rated power of shared energy storage is 100 MW, the rated capacity is 400 MWh, the charge and discharge time is 4 h,the depth of charge and discharge is 90%,and the effi-ciency is 90%.It is assumed that the unit installed investment is ¥1.12/Wh (the initial investment cost includes energy costs,PCS costs,BMS costs,EMS costs,and other costs; the average EPC quotation for 4-hour storage from March 1 to 31, 2024, is ¥1.12/Wh), and the unit battery price is ¥0.71/Wh (calculated based on data disclosed in the financial reports of 16 listed energy storage companies,with the battery price accounting for approximately 58%of the installed investment on average).
2) Revenue assumptions
According to the ‘‘Notice on Matters Related to Formulating Pilot Electricity Pricing Policies to Support the Development of Independent Energy Storage” released by the Hebei Provincial Development and Reform Commission on January 27, 2024, and the ‘‘Work Plan for the Continuous Trial Operation of the Hebei Southern Power Grid Electricity Spot Market” released on May 24, 2024, the revenues of shared energy storage mainly include peak-valley arbitrage income,demand charge electricity fee income, capacity price compensation, participation in frequency regulation auxiliary service compensation, and capacity leasing income, without considering dynamic capacity expansion, demand response,and increased self-use rate of new energy income.
The ‘‘Notice on Matters Related to Formulating Pilot Electricity Pricing Policies to Support the Development of Independent Energy Storage”clearly defines the charge and discharge pricing policies for independent energy storage projects.The charging electricity is ‘‘temporarily executed according to the proxy purchase price for commercial and industrial electricity by grid enterprises,”and the discharging electricity is ‘‘temporarily settled at the weighted average price (flat period price) of the monthly centralized bidding transactions within the province.” Therefore, referring to the peak-valley electricity prices in the proxy purchase price announcement of State Grid Hebei Power Co., Ltd., it is assumed that the peak-valley electricity price difference is ¥0.7234/kWh,and the maximum demand electricity price for commercial and industrial users is ¥35/kW month.Additionally, the document clearly sets the upper limit for capacity electricity prices at ¥100/kW year, and the capacity electricity price for energy storage connected to the grid from June 2024 will decrease monthly.Therefore, it is assumed that the capacity electricity price is the monthly average of¥75/kW year,and the document stipulates that the validity period for capacity electricity fees obtained by energy storage projects is 12 months.The‘‘Work Plan for the Continuous Trial Operation of the Hebei Southern Power Grid Electricity Spot Market” clearly defines the compensation for frequency regulation auxiliary services as frequency regulation mileage compensation.The price limit range for frequency regulation mileage compensation declarations is ¥0-15/MW.Therefore, it is assumed that the frequency regulation mileage price for energy storage is¥8.85/MW (the average frequency regulation mileage clearing price during the fourth settlement from April to June 2021 in Zhejiang was¥8.85/MW).According to more than 30 energy storage capacity leasing service tender projects announced by major power groups such as the Five Major Power Generating Companies, Three Gorges,China National Nuclear, China Energy Conservation,China Resources Power, Jingneng, Zheneng, and Jinkai New Energy from 2023 to January 2024,with a total leasing scale exceeding 674 MW/1308MWh, the winning bids for energy storage capacity leasing were concentrated between ¥105-135/kWh year, with an average winning bid of approximately ¥109/kWh year.Therefore, it is assumed that the shared energy storage capacity leasing price is ¥109/kWh year.
3) Operation and maintenance cost
Assume an annual battery cost decline rate of 5%, a material cost rate of ¥150/kW, an insurance cost rate of 3.5% of the total investment, a repair cost rate of 3.5%of the total investment, and other expenses of ¥150/kW.The number of employees is as follows: CSSES requires 15 employees,TISES requires 20 employees,and d DSSES requires 25 employees.Employee salaries are¥150,000 per person per year,and the social security contribution rate is 47.5%.4)System lifespan
The service life of lithium batteries varies between 5-15 years, depending on the application scenario.Assume a lithium battery storage lifespan of 10 years and an energy storage system operational lifespan of 20 years.Batteries are replaced once every 10 years, and the recovery value of the batteries is the same each time.
5)Number of operations
According to the assessment mechanism outlined in the‘‘Notice on Matters Related to Formulating Pilot Electricity Pricing Policies to Support the Development of Independent Energy Storage,” the annual number of complete charge and discharge cycles for energy storage should generally not be less than 330.Therefore, it is assumed that shared energy storage undergoes 400 charge and discharge cycles per year.
6)Cycle efficiency and depth of discharge
The energy efficiency range of lithium batteries is between 85-98%.Assume a charge-discharge efficiency of 90% for energy storage.Additionally, assume a depth of discharge of 90% and a charge-discharge time of 4 h.
7)Financial assumptions
Assume an equity ratio of 30%,a discount rate of 6%,a residual value rate of 5%,a loan interest rate of 4%,and a loan term of 15 years with equal principal and interest repayments.The value-added tax (VAT) rate is 13%, with 50% deducted immediately.The urban maintenance and construction tax rate is 5%, the education surcharge rate is 3%, and the income tax rate is 25%.Additionally, there are tax incentives of three exemptions and three half reductions.
8) Carbon trading and green certificate trading revenues.
Based on the previous assumptions—rated power of 100 MW, rated capacity of 400MWh, charge-discharge time of 4 h, depth of discharge of 90%, and efficiency of 90%—the actual capacity per charge-discharge cycle is approximately 324MWh.Each charge-discharge cycle results in approximately 291.6 tons of carbon dioxide emissions.At an average price of ¥63.5 per ton of carbon dioxide, the carbon trading revenue per charge-discharge cycle is approximately ¥18,516.6.
Regarding green certificate trading, each charge-discharge cycle generates 324 green certificates, as green certificates are typically traded based on 1 certificate per 1MWh of generated electricity.Therefore,the green certificate trading revenue per charge-discharge cycle is approximately ¥41,666.4.
2.3 Cost-benefit analysis of three investment and construction models for shared energy storage
2.3.1 Cost and revenue indicator analysis of CSSES
In the CSSES model, users jointly construct energy storage facilities and share the construction costs of energy storage equipment.The cost expenditures include: construction costs of energy storage equipment, regular replacement costs, and various costs and management expenses.The revenue composition includes: peak-valley arbitrage income, savings from demand charge electricity fees,participation in frequency regulation auxiliary service compensation income,and capacity compensation income.Under the core assumptions, the cost-benefit analysis is shown in Tables 2-1.
Under the CSSES model and core assumptions, the total cost of the energy storage project is ¥1.415 billion,and the total revenue is ¥1.51 billion.The internal rate of return is 11.5%, which is 5.5 percentage points higher than the basic discount rate, indicating a good project return rate.The net present value is ¥95 million, demonstrating that the project’s cash flow is sufficient to cover the initial investment costs and has substantial profitability.Both the static payback period and the dynamic payback period are less than the project’s operational lifespan, allowing the investment cost to be recovered in the early stages of project operation.Based on the above cost-benefit analysis indicators, the CSSES is considered to have investment feasibility.
Table 2-1 Comprehensive cost benefit analysis indicators for shared energy storage models (CSSES, DSSES, TISES).
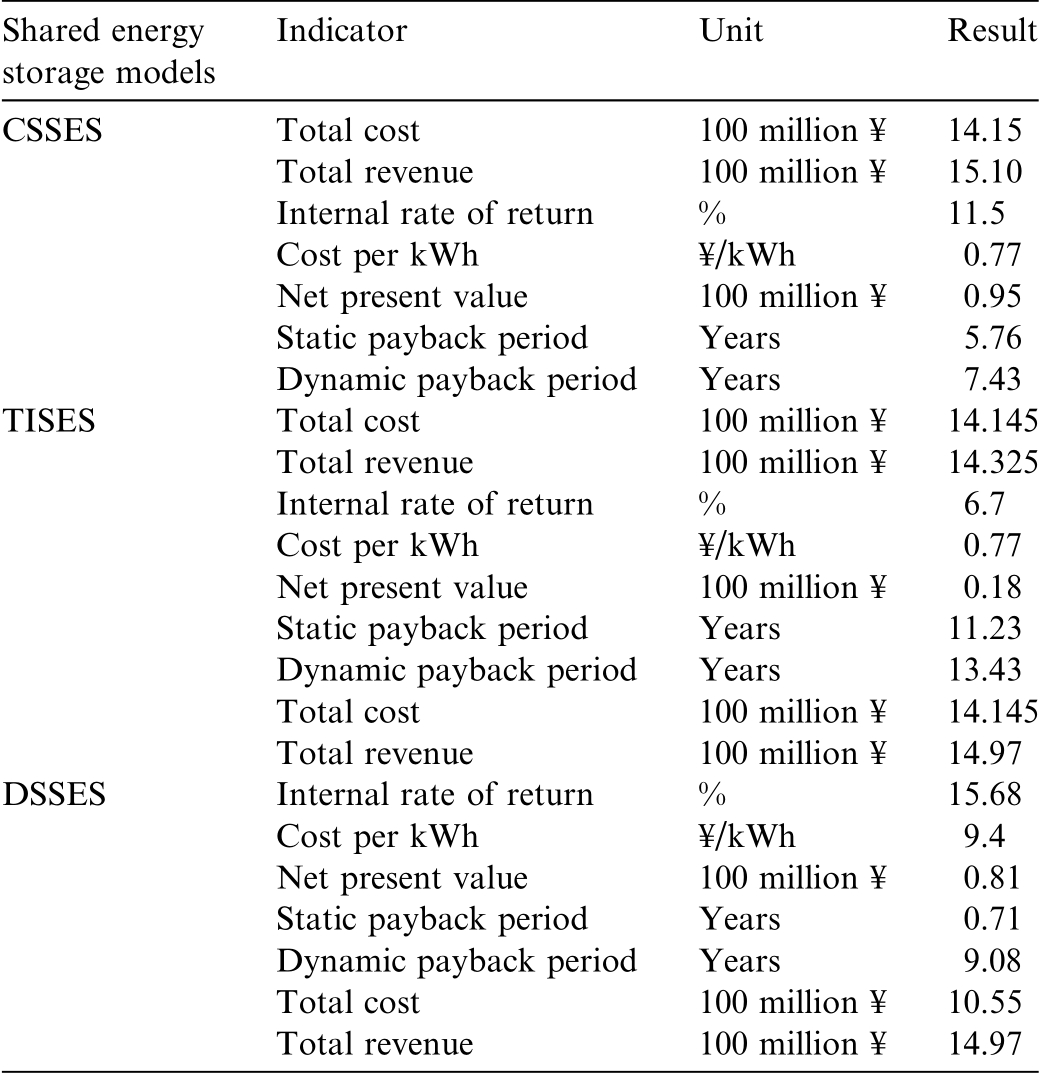
Shared energy storage models Indicator Unit Result CSSES Total cost 100 million ¥ 14.15 Total revenue 100 million ¥ 15.10 Internal rate of return % 11.5 Cost per kWh ¥/kWh 0.77 Net present value 100 million ¥ 0.95 Static payback period Years 5.76 Dynamic payback period Years 7.43 TISES Total cost 100 million ¥ 14.145 Total revenue 100 million ¥ 14.325 Internal rate of return % 6.7 Cost per kWh ¥/kWh 0.77 Net present value 100 million ¥ 0.18 Static payback period Years 11.23 Dynamic payback period Years 13.43 Total cost 100 million ¥ 14.145 Total revenue 100 million ¥ 14.97 DSSES Internal rate of return % 15.68 Cost per kWh ¥/kWh 9.4 Net present value 100 million ¥ 0.81 Static payback period Years 0.71 Dynamic payback period Years 9.08 Total cost 100 million ¥ 10.55 Total revenue 100 million ¥ 14.97
2.3.2 Cost and revenue indicator analysis of TISES
In the TISES, the energy storage demand side does not bear the construction costs of energy storage equipment.A third-party company is responsible for constructing the energy storage system and leasing part of its capacity to the energy storage demand side.For the third-party company, the cost composition includes: construction costs of energy storage equipment, regular replacement costs, and various costs and management expenses.The revenue composition includes: capacity leasing income, peakvalley arbitrage income,savings from demand charge electricity fees,and capacity compensation income.Under the core assumptions, the cost-benefit analysis is shown in Tables 2-1.
Under the TISES and core assumptions, the total cost of the energy storage project is ¥1.4145 billion, and the total revenue is¥1.4325 billion.The internal rate of return(IRR) is 6.7%, which is 0.7 percentage points higher than the basic discount rate, indicating that the capital return is relatively low.The net present value (NPV) is ¥18 million, suggesting that the project’s cash flow can cover the initial investment costs.However, the capital return is poor.Both the static payback period and dynamic payback period are shorter than the project’s operational lifespan, indicating that the investment costs can be recovered in the mid-term of project operation.Based on the above cost-benefit analysis indicators, the TISES is considered to have limited feasibility.
2.3.3 Cost and revenue indicator analysis of DSSES
In the DSSES model, each entity needs to construct its own energy storage equipment.After meeting their own usage needs, any surplus capacity can be shared.Overall,the total cost for users to build their own energy storage includes: construction costs of energy storage equipment,regular replacement costs, and various costs and management expenses.The revenue composition includes: peakvalley arbitrage income,savings from demand charge electricity fees, participation in frequency regulation auxiliary service compensation income, and capacity compensation income.Under the core assumptions, with participation in frequency regulation auxiliary service compensation,the cost-benefit analysis is shown in Tables 2-1.
Under the DSSES model and core assumptions, the total cost of the energy storage project is ¥1.497 billion,and the total revenue is ¥1.568 billion.The internal rate of return (IRR) is 9.4%, which is 3.4 percentage points higher than the basic discount rate,indicating a good project return rate.The net present value (NPV) is ¥71 million, demonstrating that the project’s cash flow can cover the initial investment costs and generate profit.This suggests that the capital return is favorable, and the present value after discounting can cover the initial costs.Both the static payback period and dynamic payback period are shorter than the project’s operational lifespan,indicating that the investment costs can be recovered in the midterm of project operation.Based on the above cost-benefit analysis indicators, the DSSES is considered to have investment feasibility.
2.4 Sensitivity analysis of three models of the shared energy storage
2.4.1 Sensitivity analysis of indicators for CSSES
In the sensitivity analysis of the CSSES,the peak-valley electricity price difference is set at ¥0.72/kWh as the baseline, with an adjustment range of ±¥0.05/kWh.The unit installed capacity investment is set at ¥1.12/Wh as the baseline, with an adjustment range of ±¥0.05/Wh.The internal rate of return (IRR) is calculated when adjusting the peak-valley electricity price difference and unit installed capacity investment.Sensitivity analysis is then conducted based on these two factors.
Since the discount rate is assumed to be 6%, when the internal rate of return exceeds 6%,it indicates that,at this level of peak-valley electricity price difference and unit installed capacity investment, the system can recover its investment costs during the operational cycle, and the energy storage project is feasible.The sensitivity analysis of the centralized shared energy storage model is shown in the figure below.
From the Figs.2-4, it can be seen that when the unit installed capacity investment is ¥0.87/Wh, ¥0.92/Wh,¥0.97/Wh, ¥1.02/Wh, ¥1.07/Wh, ¥1.12/Wh, ¥1.17/Wh,¥1.22/Wh,¥1.27/Wh,¥1.32/Wh,and¥1.37/Wh,the corre-
Fig.2-4.Cost-benefit sensitivity analysis of CSSES.sponding peak-valley electricity price differences need to be at least ¥0.57/kWh, ¥0.57/kWh, ¥0.62/kWh, ¥0.62/kWh,¥0.67/kWh, ¥0.67/kWh, ¥0.72/kWh, ¥0.72/kWh, ¥0.77/kWh, ¥0.77/kWh, and ¥0.82/kWh respectively, in order to ensure the internal rate of return exceeds 6%.Overall,as the ‘‘peak-valley electricity price difference unit installed capacity investment” factors change, the internal rate of return also varies.The lower the unit installed capacity investment, the smaller the required peak-valley electricity price difference, and vice versa, which aligns with practical expectations.
2.4.2 Sensitivity analysis of indicators for TISES
In the sensitivity analysis of the TISES,the peak-valley electricity price difference is set at ¥0.72/kWh as the baseline, with an adjustment range of ±¥0.05/kWh.The unit installed capacity investment is set at ¥1.12/Wh as the baseline, with an adjustment range of ±¥0.05/Wh.The internal rate of return (IRR) is calculated when adjusting the peak-valley electricity price difference and unit installed capacity investment.Sensitivity analysis is then conducted based on these two factors.
Since the discount rate is assumed to be 6%, when the internal rate of return exceeds 6%,it indicates that,at this level of peak-valley electricity price difference and unit installed capacity investment, the system can recover its investment costs during the operational cycle, and the energy storage project is feasible.The sensitivity analysis of the TISES is shown in the figure below.
From the Figs.2-5, it can be seen that when the unit installed capacity investment is ¥0.87/Wh, ¥0.92/Wh,¥0.97/Wh, ¥1.02/Wh, ¥1.07/Wh, ¥1.12/Wh, ¥1.17/Wh,¥1.22/Wh,¥1.27/Wh,¥1.32/Wh,and¥1.37/Wh,the corresponding peak-valley electricity price differences need to be at least ¥0.52/kWh, ¥0.57/kWh, ¥0.62/kWh, ¥0.67/kWh,¥0.67/kWh, ¥0.72/kWh, ¥0.77/kWh, ¥0.82/kWh, ¥0.82/kWh, ¥0.87/kWh, and ¥0.92/kWh or higher to ensure the internal rate of return exceeds 6%.Overall, as the‘‘peak-valley electricity price difference unit installed capacity investment” factors change, the internal rate of return also varies.The lower the unit installed capacity investment,the smaller the required peak-valley electricity price difference,and vice versa,which aligns with practical expectations.
2.4.3 Sensitivity analysis of indicators for DSSES
In the sensitivity analysis of the DSSES,the peak-valley electricity price difference is set at ¥0.72/kWh as the baseline, with an adjustment range of ±¥0.05/kWh.The unit installed capacity investment is set at ¥1.12/Wh as the baseline, with an adjustment range of ±¥0.05/Wh.The internal rate of return (IRR) is calculated when adjusting the peak-valley electricity price difference and unit installed capacity investment.Sensitivity analysis is then conducted based on these two factors.
Since the discount rate is assumed to be 6%, when the internal rate of return exceeds 6%,it indicates that,at this level of peak-valley electricity price difference and unit installed capacity investment, the system can recover its investment costs during the operational cycle, and the energy storage project is feasible.The sensitivity analysis of the DSSES is shown in the figure below.
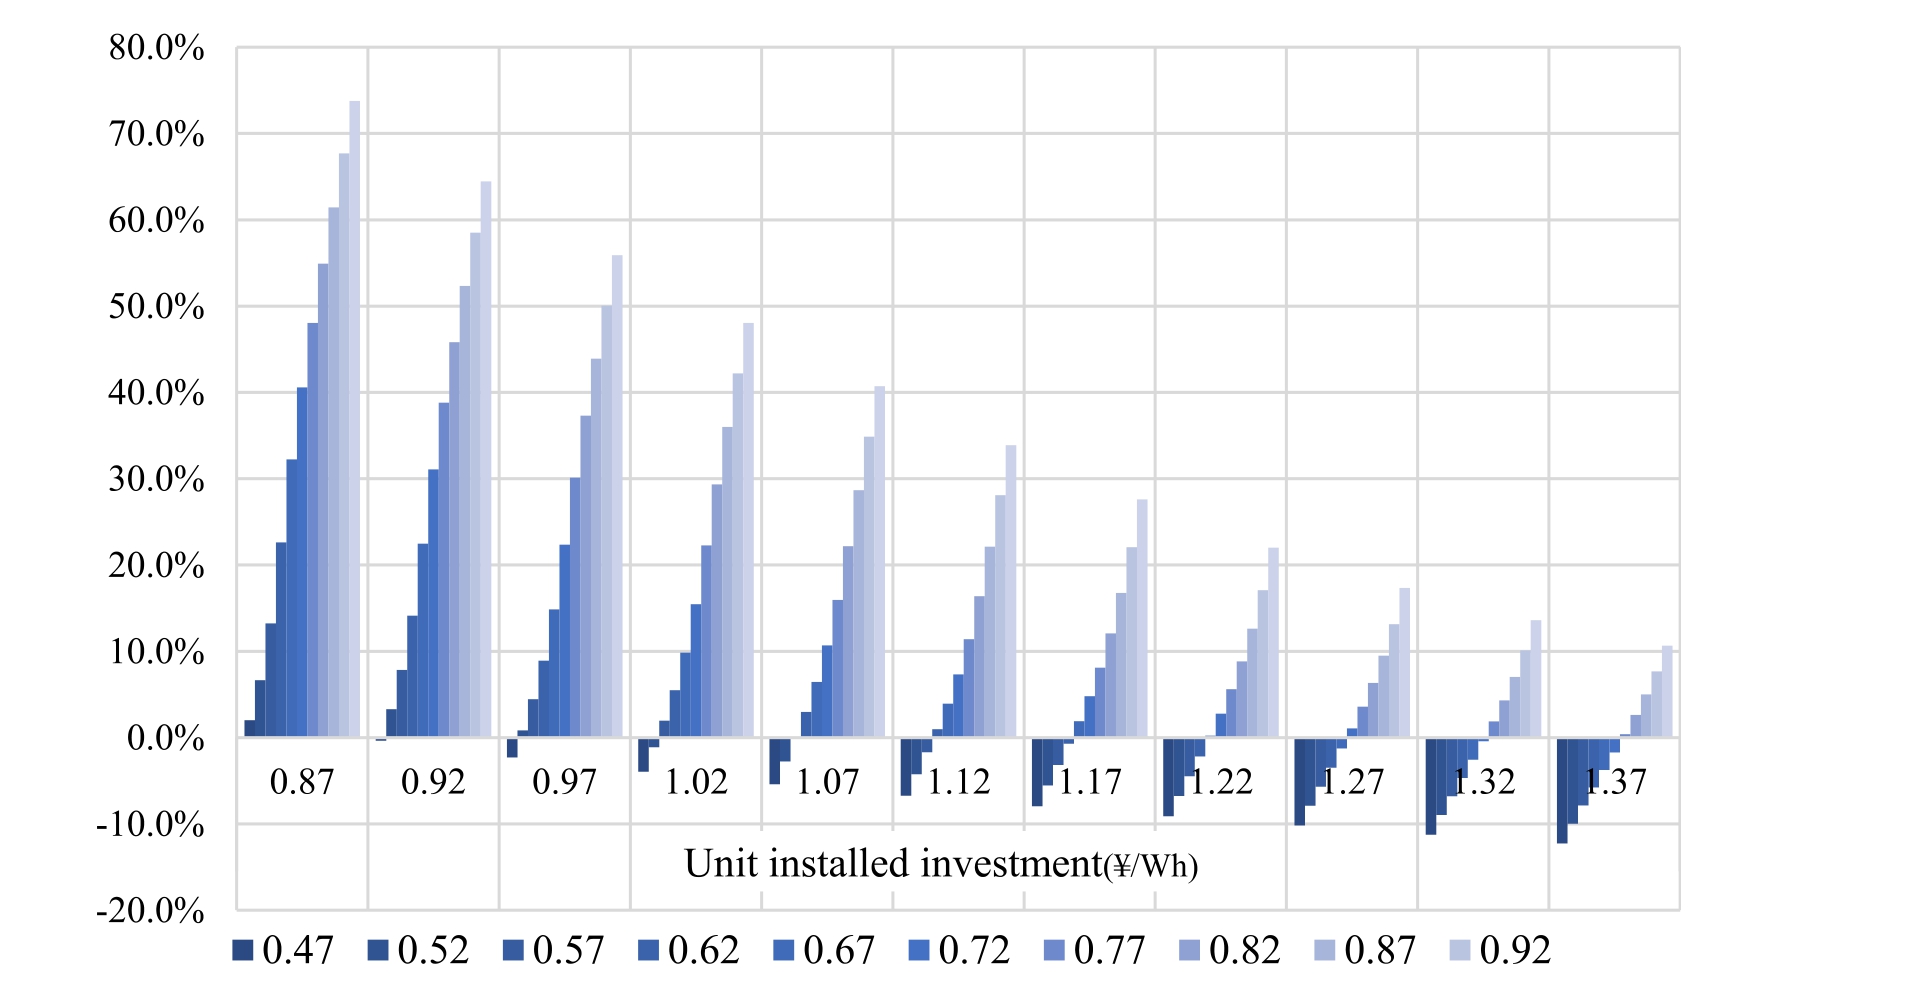
Fig.2-5.Cost-benefit sensitivity analysis of TISES.
From the Figs.2-6, it can be seen that when the unit installed capacity investment is ¥0.87/Wh, ¥0.92/Wh,¥0.97/Wh, ¥1.02/Wh, ¥1.07/Wh, ¥1.12/Wh, ¥1.17/Wh,¥1.22/Wh,¥1.27/Wh,¥1.32/Wh,and¥1.37/Wh,the corresponding peak-valley electricity price differences need to be at least ¥0.57/kWh, ¥0.57/kWh, ¥0.62/kWh, ¥0.62/kWh,¥0.67/kWh, ¥0.72/kWh, ¥0.72/kWh, ¥0.77/kWh, ¥0.77/kWh, ¥0.82/kWh, and ¥0.82/kWh or higher to ensure the internal rate of return exceeds 6%.Overall, as the‘‘peak-valley electricity price difference unit installed capacity investment” factors change, the internal rate of return also varies.The lower the unit installed capacity investment,the smaller the required peak-valley electricity price difference,and vice versa,which aligns with practical expectations.
3 Evaluation of the operational value of shared energy storage in the new power system
The comprehensive evaluation method for shared energy storage is the process of comparing various shared energy storage technologies and evaluating the feasibility of specific projects based on their technical and economic characteristics.Effective evaluation can identify development issues, clarify technological gaps, and subsequently formulate promotion measures.At present, cost-benefit analysis is commonly used for evaluation.This method treats shared energy storage in isolation, and although its economic and technical feasibility are studied separately, it ignores the multi value characteristics of the system and the economic impact of the project on other social entities.It is both one-sided and difficult to fully tap into its potential.Therefore, comprehensive evaluation methods need to analyze feasibility and effectiveness from a broader perspective,such as examining the views of multiple stakeholders on energy storage construction, or simulating and predicting the social benefits of shared energy storage after investment and operation.By highlighting strengths and avoiding weaknesses, the comprehensive benefits brought by energy storage can be enhanced,achieving better overall performance and benefits.
3.1 Construction of the shared energy storage evaluation index system
3.1.1 Principles for the indicator selection
Whether shared energy storage can achieve satisfactory economic benefits will determine its widespread construction and application, while its beneficial impact on society and the environment will determine its sustainable development.Shared energy storage projects can improve the consumption of clean energy, reduce the phenomenon of abandoned wind and light through distributed power sources, and obtain economic profits by utilizing the peak and valley electricity price difference, thus having good comprehensive benefits.The evaluation of the operational benefits of shared energy storage involves multiple stakeholders and requires a scientific and comprehensive index system for evaluation.The comprehensive evaluation system is nonlinear and complex, requiring multiple indicators to be organized into a corresponding evaluation system according to their internal connections and a certain hierarchical structure.Generally, it is important to adhere to the principles of comprehensiveness, scientific rigor, hierarchical structure, independence, systematic approach, operational practicality, and forward-looking development.
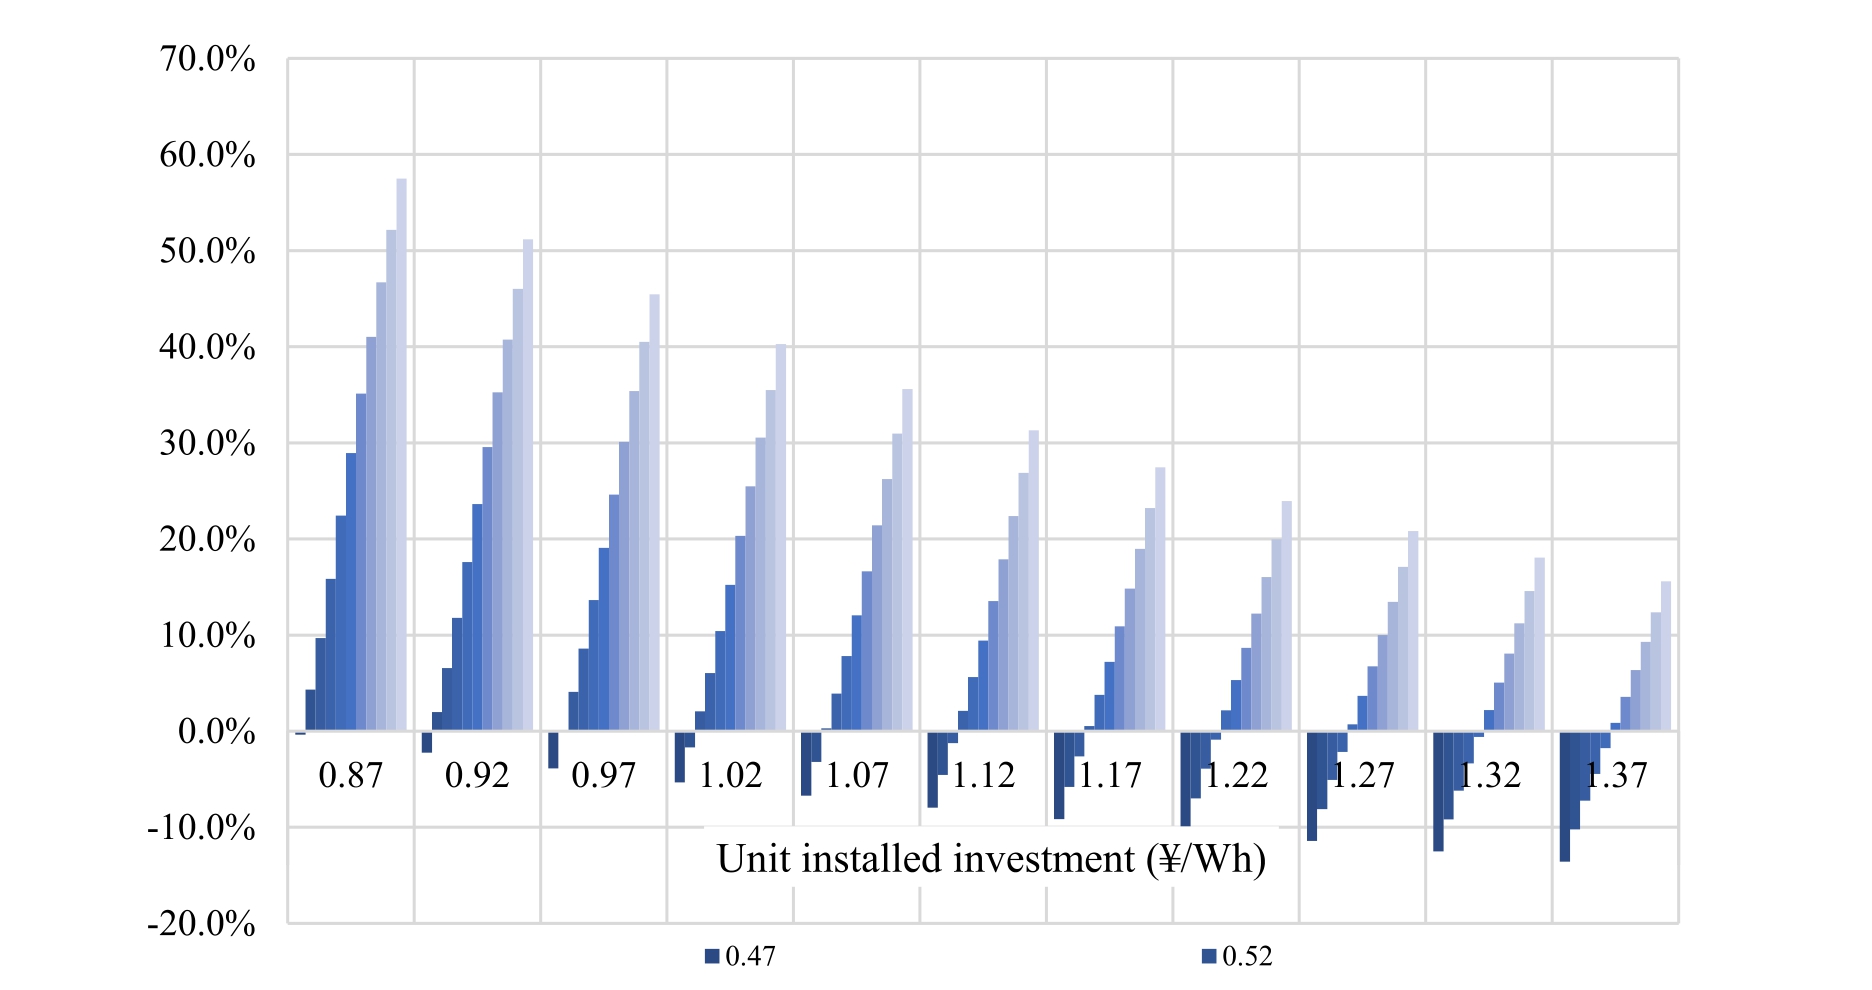
Fig.2-6.Cost-benefit sensitivity analysis of DSSES.
3.1.2 Construction of the index evaluation system
1)Cost,benefit indicators,and calculation methods for Shared Energy Storage Systems
For the cost, benefit indicators, and calculation methods of the shared energy storage system, please refer to Section 3.2.
2)Environmental indicators and calculation Methods for Shared Energy Storage Systems
The environmental indicators and calculation methods for the shared energy storage system [30].
1) Carbon trading calculation formula
Where, RCrepresents the carbon trading revenue (yuan);PCrepresents the revenue per ton of carbon dioxide, and ECO2 represents the carbon dioxide emissions from a single charge and discharge cycle (tons).
2) Green certificate revenue formula
where, Rgrepresents the revenue from green certificate trading; C represents the actual capacity of a single charge and discharge cycle; Grepresents the number of green certificates generated per MWh (units/MWh); Pg represents the revenue per green certificate (yuan/unit).
According to the selection principles of the shared energy storage operation benefit evaluation indicators, it is necessary to conduct an in-depth analysis of the interests of all parties involved in the shared energy storage system.In conjunction with the ultimate goals and basic characteristics of shared energy storage operations,the criteria layer for operational benefits is determined to be four dimensions: economic indicators, environmental indicators,social indicators, and technical indicators.Based on this,a shared energy storage operation benefit evaluation index system is constructed.The specific shared energy storage operation benefit evaluation index system is shown in Tables 3-1 below:
3.2 Indicator preprocessing and weight determination
3.2.1 Indicator preprocessing
After constructing the shared energy storage operation benefit evaluation index system, due to the diversity in types and units of indicators, it is necessary to perform standardized preprocessing on the indicators to facilitatefurther calculations and comparative analysis, laying the foundation for comprehensive evaluation.During the preprocessing, indicators need to be normalized and dimensionless.When constructing the comprehensive benefit evaluation model for shared energy storage,it is important to consider that some indicator values are better when larger, known as positive indicators; some indicator values are better when smaller, known as negative indicators;and there are also indicators that perform best near a moderate value, known as moderate indicators.Therefore,before comprehensive evaluation, all types of indicators need to be standardized, typically by converting negative and moderate indicators into positive indicators to align their trends.There are usually two methods for the positive transformation of negative and moderate indicators:reciprocal transformation and penalty reciprocal transformation.This paper adopts the penalty reciprocal transformation method for the standardization of indicators,converting negative indicator values into positive indicator values through linear transformation,thereby unifying the directionality of the indicators and making the comprehensive evaluation more scientific and reasonable.
Table 3-1 Economic evaluation indicator system of the shared energy storage.
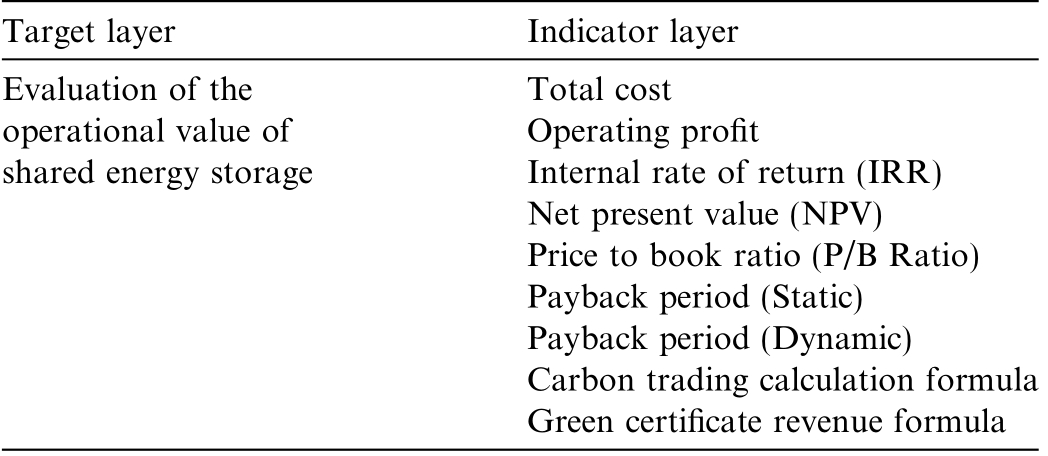
Target layer Indicator layer Evaluation of the operational value of shared energy storage Total cost Operating profit Internal rate of return (IRR)Net present value (NPV)Price to book ratio (P/B Ratio)Payback period (Static)Payback period (Dynamic)Carbon trading calculation formula Green certificate revenue formula
The formula for the positive transformation of moderate indicators is:
where xijyij are the indicator values before and after transformation,respectively,and A is the moderate value of the moderate indicator.
Different indicators in the evaluation system have their own units of measurement and dimensions, and direct comparison and analysis of them lacks practical significance.Therefore, it is necessary to convert these indicator values into dimensionless relative numbers for comprehensive comparison.This transformation process is called the dimensionless normalization of indicators, which is the foundation for comprehensive evaluation and has a significant impact on the evaluation results.This paper will use the range transformation method for dimensionless normalization, with specific operations as follows:
First, determine the lower limit of a certain indicator based on its minimum value in historical data or among all schemes; then, take the desired or actual maximum value as the upper limit.Next, calculate the dimensionless normalized indicator values using the corresponding formula.
The range transformation method is simple and convenient, and the processed indicator values are within the range of 0-1, preserving the differentiated information,which is conducive to subsequent comprehensive evaluation and analysis.
3.2.2 Weight determination
The Analytic Hierarchy Process(AHP)is a widely used subjective weighting technique that effectively integrates quantitative and qualitative analysis and is suitable for complex multifactor and multi-objective evaluation systems.Below are the detailed steps of this method:
1)Construct the hierarchical structure model
When conducting an in-depth study of the stakeholders involved in the shared energy storage system, the factors related to the operational benefits of shared energy storage can be categorized into multiple levels based on their logical relationships.These factors influence each other at the same level or belong to the level above,and are affected by or dominated by the factors at the next level.In this article,the multi-level evaluation index system previously established can be considered as the hierarchical structure model, so there is no need to construct a new model separately.
2)Establish the judgment matrix
The construction of the judgment matrix begins from the second level of the hierarchical structure model, using the pairwise comparison method.This involves comparing each factor at the same level that is affected by the indicators at the upper level, continuing all the way to the last level.The results of the comparison are represented by scale values indicating the degree of importance between the indicators.For specific content, please refer to Tables 3-2:
In order to determine the weight of a criterion within the shared energy storage evaluation index system, for the m third-level indicators under that criterion, experts from various fields have been employed to comparatively evaluate the importance of the indicators,resulting in their respective scores.By calculating the average score of each indicator, the degree of importance and a pairwise comparison judgment matrix are calculated as follows:
Table 3-2 Scale values of importance degrees.
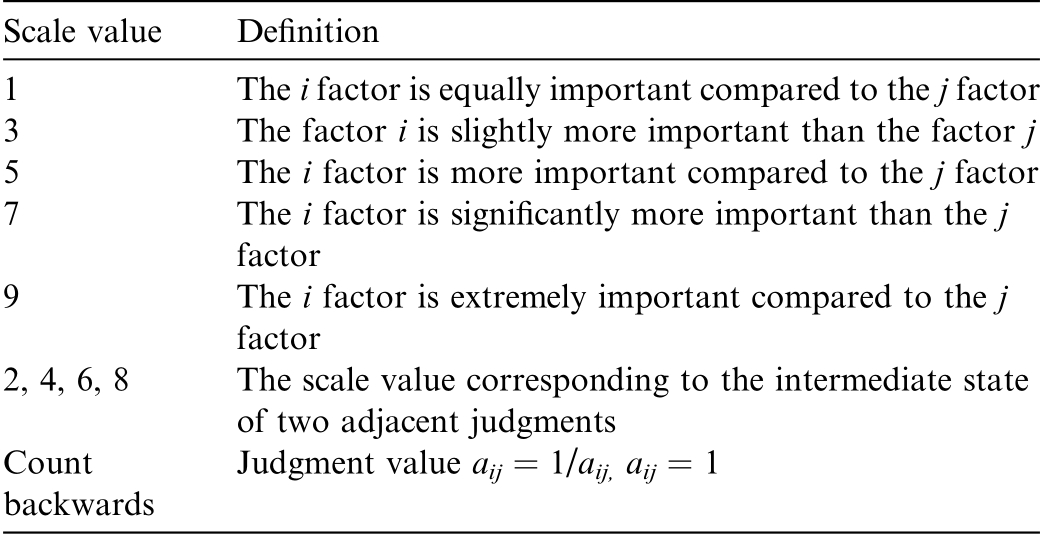
Scale value Definition 1 The i factor is equally important compared to the j factor 3 The factor i is slightly more important than the factor j 5 The i factor is more important compared to the j factor The i factor is significantly more important than the j factor 7 9 The i factor is extremely important compared to the j factor 2, 4, 6, 8 The scale value corresponding to the intermediate state of two adjacent judgments Count backwards Judgment value aij = 1/aij, aij = 1

where, aijrepresents the average score obtained from the comparative evaluation between factor i and factor j.
3) Determination of the Weight Vector for Individual Indicator Ordering
Summing the judgment matrix row-wise to obtain the weight vector before normalization![]() the superscript T denotes the transpose of a matrix (the same notation is used throughout), where:
the superscript T denotes the transpose of a matrix (the same notation is used throughout), where:
Normalization of the weight vector is performed to obtain the final single-layer weight vector for these m indicators![]() where:
where:
4) Consistency check
To determine the final single-sorting weight, a consistency test should be conducted, which is to ascertain the degree of inconsistency of the judgment matrix Aij.This can be accomplished by calculating the consistency index(CI).The smaller the CI value, the higher the consistency.The eigenvector corresponding to the largest eigenvalue of the judgment matrix is utilized as the single-layer weight vector for the indicators at that level.The higher the degree of inconsistency, the greater the judgment error.The eigenvector that passes the test can be used as the final weight vector;otherwise,it is necessary to rebuild the judgment matrix.
The inconsistency of the judgment matrix Aij is measured by the magnitude of λmax m, and the Consistency Index (CI) is calculated using the formula:
Subsequently,the Consistency Ratio(C R)is calculated,with the specific formula as follows:
In this context,RI refers to the Random Index,which is the average random consistency index.The specific values for RI can be obtained by consulting Tables 3-3.
When the Consistency Ratio (CR) is less than 0.1, it is considered that the consistency test has passed, and the single-layer sorting result is satisfactory,which can be used as the final weight vector.Subsequently, the Entropy Weight Method should be used to confirm the weights of the third-level indicators.The calculation steps are as follows: Assuming the evaluation involves m shared energy storage projects involved in the evaluation, each evaluation object includes n evaluation indicators, and the raw data of the ith project on the jth indicator is denoted as xij.First, construct the original data matrix with the following formula:
Subsequently, perform dimensionless and normalization processing on each indicator to obtain the standardized matrix X.Next, calculate the proportion of each indicator in different projects, that is, the proportion yij of the jth indicator in the ith project’s indicator value, as follows:
Thus, the weight matrix is obtained![]() and the information entropy value ej of the jth indicator is calculated as follows:
and the information entropy value ej of the jth indicator is calculated as follows:
Among them, k > 0, k = 1/ln (m).Finally, the weights obtained by entropy weight method and analytic hierarchy process are combined to determine the weight zj of the shared energy storage project indicator system.The calculation method is as follows:
Table 3-3 Standard values of the average random consistency index (RI).
Matrix order 2 3 4 5 6 7 8 9 10 RI 0.00 0.58 0.91 1.12 1.24 1.35 1.42 1.45 1.49

Finally, the composite weight combination![]() is obtained.
is obtained.
3.3 Shared energy storage multiple investment and construction model evaluation case analysis
Based on the evaluation index system for shared energy storage projects established earlier, it can be inferred that these indicators are quantifiable and easy to calculate or identify.Based on the characteristics of the above indicator system and the purpose of comprehensive evaluation,this paper conducted research using the AHP-TOPSIS method.Compared with other multi-criteria decisionmaking methods such as fuzzy comprehensive evaluation,grey relational analysis, or single AHP/TOPSIS approaches, the AHP-TOPSIS method offers better integration of expert judgment and objective data analysis.AHP ensures logical and consistent weight assignment through pairwise comparisons, while TOPSIS provides a clear and data-driven ranking based on the distance to ideal solutions.This combined approach improves result reliability and is especially suitable for evaluating energy storage photovoltaic projects with both technical and strategic indicators [31,32], which is shown as Tables 3-4:
Using the composite weight calculation method of entropy method-AHP,the subjective and objective weights of the indicators are calculated respectively.The calculation of subjective weights is obtained through questionnaire surveys that collect experts’ judgments on the importance of the indicators.The importance of subjective and objective weights is set to 0.5, and the final comprehensive weights are shown in the following Tables 3-5.
In the context of utilizing the entropy weight-AHP to determine the weight of indicators, the TOPSIS comprehensive evaluation is conducted for the benefits of different operational schemes of the microgrid.Firstly,based on the normalized indicator values, the positive and negative ideal points of the microgrid operation benefits are calculated, as shown in Tables 3-6.
Calculate the distances between each scheme and the positive and negative ideal points separately, as shown in Tables 3-7.
Table 3-4 Initial data preprocessing results.
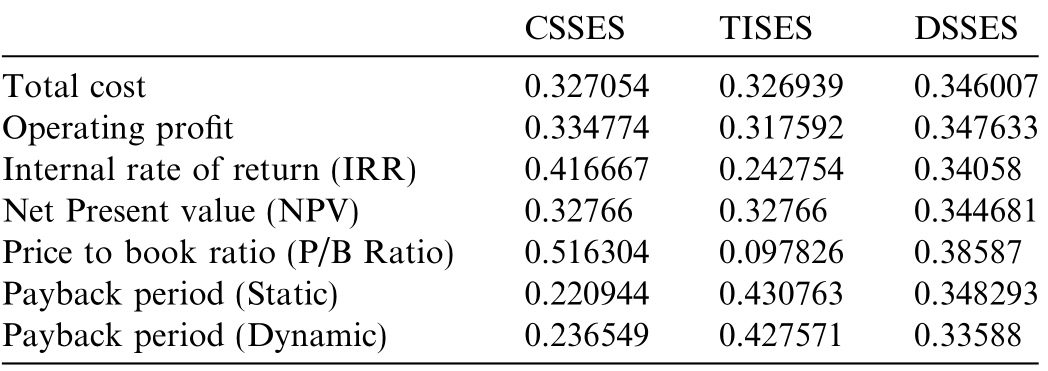
CSSES TISES DSSES Total cost 0.327054 0.326939 0.346007 Operating profit 0.334774 0.317592 0.347633 Internal rate of return (IRR) 0.416667 0.242754 0.34058 Net Present value (NPV) 0.32766 0.32766 0.344681 Price to book ratio (P/B Ratio) 0.516304 0.097826 0.38587 Payback period (Static) 0.220944 0.430763 0.348293 Payback period (Dynamic) 0.236549 0.427571 0.33588
Table 3-5 Indicator weights for shared energy storage.
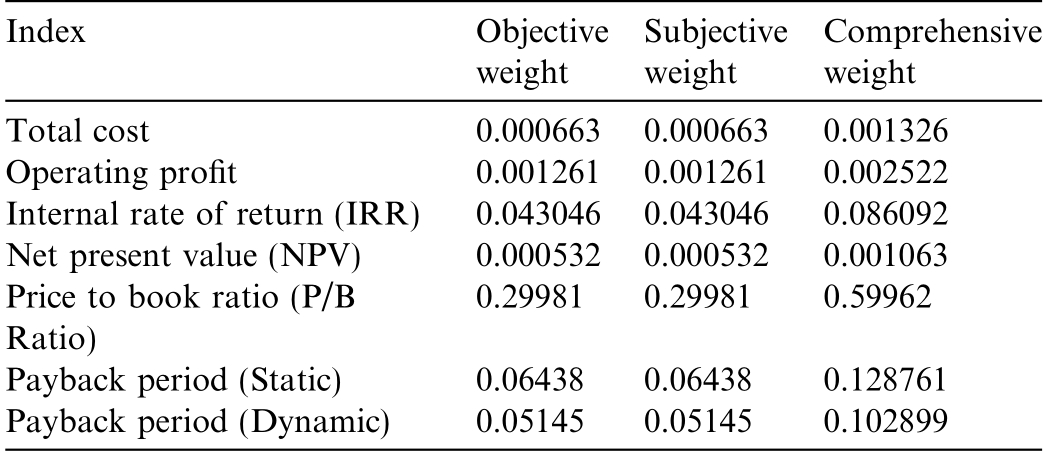
Index Objective weight Comprehensive weight Total cost 0.000663 0.000663 0.001326 Operating profit 0.001261 0.001261 0.002522 Internal rate of return (IRR) 0.043046 0.043046 0.086092 Net present value (NPV) 0.000532 0.000532 0.001063 Price to book ratio (P/B Ratio)Subjective weight 0.29981 0.29981 0.59962 Payback period (Static) 0.06438 0.06438 0.128761 Payback period (Dynamic) 0.05145 0.05145 0.102899
Table 3-6 Positive and negative ideal points of evaluation indicators.
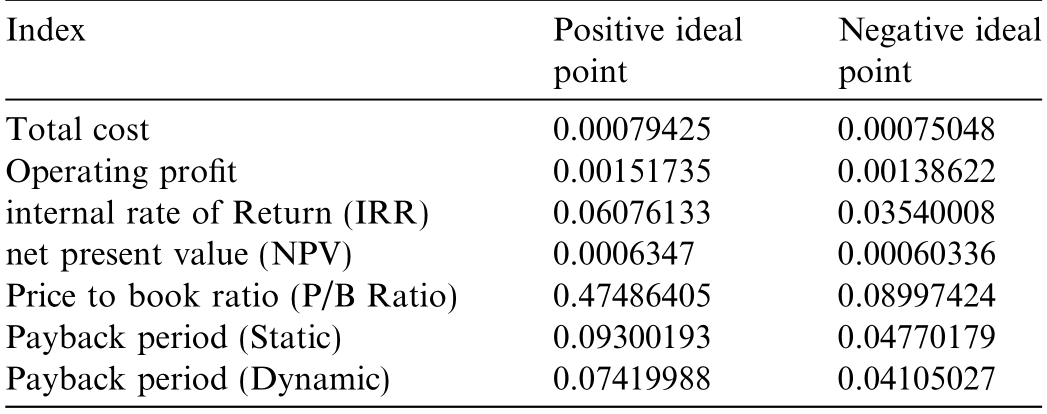
Index Positive ideal point Negative ideal point Total cost 0.00079425 0.00075048 Operating profit 0.00151735 0.00138622 internal rate of Return (IRR) 0.06076133 0.03540008 net present value (NPV) 0.0006347 0.00060336 Price to book ratio (P/B Ratio) 0.47486405 0.08997424 Payback period (Static) 0.09300193 0.04770179 Payback period (Dynamic) 0.07419988 0.04105027
Table 3-7 Distance between each plan and the positive and negative ideal points.

Index Distance from the positive ideal point Distance from the negative ideal point CSSES 0.06028435 0.38572447 TISES 0.38588104 0.05719964 DSSES 0.12282136 0.2681877
Furthermore, calculate the relative closeness of all schemes for comparison and optimal ranking, and obtain the TOPSIS comprehensive evaluation results, as shown in Tables 3-8.
Based on the TOPSIS comprehensive evaluation results,it is evident that Option CSSES emerges as the optimal solution.
1) Within the comprehensive evaluation criteria, the internal rate of return, net present value, and payback period of the project are the most weighted indicators.This suggests that the primary objective of energy storage project operations is to ensure eco-nomic benefits while enhancing the financial performance of the project through sound investment and operational strategies, thereby reducing investment risks.This aligns with the purpose and significance of shared energy storage construction and is crucial for assessing the scientific rationality of shared energy storage project operation schemes.
Table 3-8 TOPSIS comprehensive evaluation results.

Case Closeness Rank CSSES 0.86483596 1 TISES 0.12909531 3 DSSES 0.68588615 2
Table 3-9 Extended application scenario 1.

Scenario Electricity price differential Discounted payback period CSSES 0.52 14.15 10.92 -11.1% 0.77 -3.23 0 0 TISES 0.52 14.08 12.56 -3.2% 0.76 -1.52 0 0 DSSES 0.52 14.97 11.87 -8.7% 0.81 -3.10 0 0 Total cost Total revenue Internal rate of return Levelized cost of electricity Net present value Simple payback period
Table 3-10 Extended application scenarios 2.

Electricity price differential Scenario Total cost Total revenue Internal rate of return Levelized cost of electricity Net present value Simple payback period Discounted payback period CSSES 0.92 14.15 16.19 18.4% 0.77 1.98 3.12 4.96 TISES 0.92 14.08 15.77 27.8% 0.76 1.69 2.17 3.74 DSSES 0.92 14.97 17.08 17.4% 0.81 2.11 4.45 5.43
2) The TOPSIS method sorts the options based on the distance from the ideal and negative ideal solutions.A higher closeness score indicates that the solution is closer to the ideal,making it a more preferred choice.The optimal solution,CSSES and DSSES are the top two with the highest closeness scores,ranking 1st and 2nd with scores of 0.86483596 and 0.68588615,respectively.This indicates that these two shared energy storage models under centralized and decentralized self-built models perform the best.The higher closeness solution, TISES, although with a lower score, still possesses a certain level of investment feasibility.
3) Comparing the results calculated by different methods reveals consistent outcomes regarding the superiority or inferiority of the options.The distinct differences in evaluation results among various schemes clearly identify the optimal solution,demonstrating the effectiveness of the comprehensive evaluation model constructed in this paper, which can assist decision-makers in selecting the best operational plan.
3.4 Expansion analysis of shared energy storage application scenarios
For the expansion analysis of shared energy storage application scenarios, the scenarios may change with fluctuations in electricity prices,costs,and returns.Therefore,the shared energy storage models are further analyzed under different application scenarios as shown in Tables 3-9 and Tables 3-10.
After resetting based on the above electricity prices,the TOPSIS comprehensive evaluation results are shown in Tables 3-11 and Tables 3-12.
It is observable that when the electricity price difference falls below 0.52, the order of preference for the schemes is as follows:TISES,CSSES,and DSSES.Conversely,when the electricity price difference exceeds 0.92, the order of preference rearranges to: TISES, DSSES, and then CSSES.In the practical application of shared energy storage, adjustments can be made based on specific parameters.
Table 3-11 Comprehensive evaluation results of TOPSIS extended application scenario 1.

Case Closeness Rank CSSES 0.83628425 2 TISES 0.85795642 1 DSSES 0.80355953 3
Table 3-12 Comprehensive evaluation results of TOPSIS extended application scenario 2.

Case Closeness Rank CSSES 0.72954325 3 TISES 0.76569566 1 DSSES 0.69875662 2
4 Conclusion
This study constructs three shared energy storage models, namely Centralized Self Built Shared Energy Storage(CSSES), Distributed Self Built Shared Energy Storage(DSSES), and Third Party Investment Shared Energy Storage (TISES), and evaluates their economic feasibility in terms of internal rate of return (IRR), net present value (NPV), and payback period.The assessment shows that CSSES delivers the best financial performance,DSSES ranks second, and TISES performs the worst.The detailed findings are as follows:
1) CSSES delivers the strongest investment returns.It records the highest IRR (11.5%), the largest NPV(approximately ¥95 million), and the shortest payback period.These metrics indicate faster cost recovery and substantial profits, making CSSES particularly attractive for large scale projects and investors seeking high returns.
2) DSSES is feasible but offers more moderate returns.Its IRR (9.4%) is lower than that of the centralized model, yet it still yields a positive NPV (about¥71 million) and a reasonably short payback period.Greater siting flexibility suits smaller scale or decentralized projects, although lower profitability requires investors to balance expected gains against risk carefully.
3) TISES presents limited investment appeal.It shows the lowest IRR (6.7%) and only a modest NPV(around ¥18 million).A wider peak-valley price spread is generally needed to achieve satisfactory returns.Although the NPV covers initial costs, the relatively poor capital efficiency constrains attractiveness, limiting suitability to markets with pronounced tariffdifferentials or to investors willing to accept lower returns.
In summary, CSSES is the most financially viable model, DSSES remains a practical option for small or decentralized projects, whereas TISES is less attractive because of its comparatively low returns and higher risk profile.
CRediT authorship contribution statement
Yuanying Chi: Writing - review & editing, Supervision,Funding acquisition,Conceptualization.Zihang Jin:Writing-review&editing,Methodology.Xufeng Zhang:Data curation, Methodology, Software, Validation, Writing -review & editing. Yanzhao Zhang: Data curation. Yuxi Wu: Supervision, Visualization, Writing - original draft.Junqi Wang: Visualization, Writing - review & editing.
Declaration of competing interest
The authors declare that they have no known competing financial interests or personal relationships that could have appeared to influence the work reported in this paper.
Acknowledgments
This work was supported by the Humanities and Social Sciences of Ministry of Education Planning Fund of China(Grant No.21YJA790009) and the National Natural Science Foundation of China (Grant No.72140001).
References
-
[1]
Y.B.Shu,G.P.Chen,J.B.He,et al.,Building a new electric power system based on new energy sources,Chin.J.Eng.Sci.23(6)(2021)61. [百度学术]
-
[2]
D.L.Ren,L.Liu,X.J.Gong,et al.,Effect evaluation of ecological compensation for strategic mineral resources exploitation based on VIKOR-AISM model, Sustainability 14 (23) (2022) 15969. [百度学术]
-
[3]
X.Z.Li, L.J.Chen, X.L.Du, et al., A review of operation mechanism and transaction mode of shared energy storage on the generation side, Proc.CSEE 18 (01) (2023) 188-200. [百度学术]
-
[4]
Y.J.Wu, Q.T.Guo, C.L.Zheng, et al., Joint optimized operation and bidding strategy of wind-solar-storage cluster considering energy storage sharing, Proc.CSEE 18 (01) (2023) 219-227. [百度学术]
-
[5]
M.Zeng, Y.Q.Wang, M.Zhang, et al., Research on business model and economic benefits of independent energy storage under the sharing economy, Price (Theor.Pract.) 1 (2023) 179-183. [百度学术]
-
[6]
B.Chen,Z.K.Li,B.J.Liu, et al., Dynamic cooperative scheduling and adaptive benefit allocation for multi-microgrid systems with shared energy storage under source-load uncertainty, J.Storage Mater.128 (2025) 117213. [百度学术]
-
[7]
X.H.Yang,X.L.Yi,H.Y.Wang,et al.,Shared energy storage with multi-microgrids: coordinated development and economic-socialenvironmental comprehensive assessment under supply-demand uncertainties, Renew.Energy 249 (2025) 123101. [百度学术]
-
[8]
W.Y.Zhang, W.Wei, L.J.Chen, et al., Service pricing and load dispatch of residential shared energy storage unit, Energy 202(2020) 117543. [百度学术]
-
[9]
C.Zhang,D.C.Chen,X.P.Chen,et al.,Economic benefit analysis of optimal configuration of energy storage under multiple application scenarios, Energy Storage Sci.Technol.(2024) 1-12. [百度学术]
-
[10]
J.L.Li, Y.R.Jiang, L.J.Zhang, Policy recommendations and business model exploration of electrochemical energy storage in Qinghai Province, Energy Technol.19 (05) (2021) 7-12. [百度学术]
-
[11]
M.Khojasteh, P.Faria, Z.Vale, Distributed robust optimization model for resiliency analysis of energy communities with shared energy storage systems, Energy 320 (2025) 135337. [百度学术]
-
[12]
J.W.Xiao, Y.B.Yang, S.C.Cui, et al., A new energy storage sharing framework with regard to both storage capacity and power capacity, Appl.Energy 307 (2022) 118171. [百度学术]
-
[13]
X.Chen,Z.B.Liu,P.C.Wang,et al.,Multi-objective optimization of battery capacity of grid-connected PV-BESS system in hybrid building energy sharing community considering time-of-use tariff,Appl.Energy 350 (2023) 121727. [百度学术]
-
[14]
N.Wu,Q.Wu,H.B.Ren,et al.,Hierarchical game optimization of independent shared energy storage system considering multiple profits and penalty, Energy 321 (2025) 135448. [百度学术]
-
[15]
J.Hu,Q.H.Li,B.C.Huang,K.H.Feng,Research on the business model of grid-side energy storage adapting to China’s application scenario demands and policy environment, Global Energy Interconnect.2 (04) (2019) 367-375. [百度学术]
-
[16]
H.Zhang, T.Liu, J.L.Jiang, Equilibrium operation strategy for shared energy storage in power system based on the network equilibrium model, J.Storage Mater.106 (2025) 114831. [百度学术]
-
[17]
S.C.Zhou,W.J.Wu,Y.J.Sun,et al.,Energy storage configuration and benefit evaluation method for new energy power plants based on game theory, J.Electr.Eng.Technol.20 (4) (2025)1959-1973. [百度学术]
-
[18]
A.M.Elberry, J.Thakur, A.Santasalo-Aarnio, et al., Large-scale compressed hydrogen storage as part of renewable electricity storage systems, Int.J.Hydrogen Energy 46 (29) (2021) 15671-15690. [百度学术]
-
[19]
A.Ho, D.Hill, J.Hedengren, et al., A nuclear-hydrogen hybrid energy system with large-scale storage:a study in optimal dispatch and economic performance in a real-world market, J.Storage Mater.51 (2022) 104510. [百度学术]
-
[20]
S.Bi, C.J.Li, W.Zhang, et al., The prospect of methanol-fuel heating in northern China, Renew.Energy 237 (2024) 121663. [百度学术]
-
[21]
H.J.Yang, Z.C.Yang, M.C.Gong, et al., Commercial operation mode of shared energy storage system considering power transaction satisfaction of renewable energy power plants, J.Storage Mater.105 (2025) 114738. [百度学术]
-
[22]
M.H.Lin, J.Liu, Z.Tang, et al., Coordinated DSO-VPP operation framework with energy and reserve integrated from shared energy storage: a mixed game method, Appl.Energy 379(2025) 125006. [百度学术]
-
[23]
D.J.Wang,H.Y.Sun,Y.M.Ge,et al.,Operation effect evaluation of grid side energy storage power station based on combined weight TOPSIS model, Energy Rep.11 (2024) 1993-2002. [百度学术]
-
[24]
J.C.Liu,Y.N.Song,X.J.Xue,et al.,Value evaluation model study on shared energy storage adapted to the needs of new power system, Energy 330 (2025) 136977. [百度学术]
-
[25]
J.D.Cui, Z.C.Zhu, G.L.Qu, et al., Demand-side shared energy storage pricing strategy based on Stackelberg-Nash game, Int.J.Electr.Power Energy Syst.164 (2025) 110387. [百度学术]
-
[26]
Q.B.He,C.M.Chen,X.Fu,et al.,Joint planning method of shared energy storage and multi-energy microgrids based on dynamic game with perfect information, Energies 17 (19) (2024) 4792. [百度学术]
-
[27]
Y.Jiao, D.Ma˚nsson, Greenhouse gas emissions from hybrid energy storage systems in future 100% renewable power systems-a Swedish case based on consequential life cycle assessment, J.Storage Mater.57 (2023) 106167. [百度学术]
-
[28]
H.Kang, S.Jung, M.Lee, et al., How to better share energy towards a carbon-neutral city?A review on application strategies of battery energy storage system in city,Renew.Sustain.Energy Rev.157 (2022) 112113. [百度学术]
-
[29]
L.X.Li, X.L.Cao, S.Zhang, Shared energy storage system for prosumers in a community: investment decision, economic operation, and benefits allocation under a cost-effective way, J.Storage Mater.50 (2022) 104710. [百度学术]
-
[30]
B.M.Fang,W.Q.Qiu,M.C.Wang,et al.,Evaluation index system of shared energy storage market towards renewable energy accommodation scenario: a China’s Qinghai province context,Global Energy Interconnect.5 (1) (2022) 77-95. [百度学术]
-
[31]
C.J.Li, M.Negnevitsky, X.L.Wang, Prospective assessment of methanol vehicles in China using FANP-SWOT analysis, Transp.Policy 96 (2020) 60-75. [百度学术]
-
[32]
L.Yang, Y.R.Hao, B.Wang, et al., Evaluation of the water resources carrying capacity in Shaanxi Province based on DPSIRM-TOPSIS analysis, Ecol.Indic.173 (2025) 113369. [百度学术]
Fund Information

